
Free Social Media Analytics Tools: What Actually Stays Free
Table of Contents
Yes, free social media analytics tools can still cover a genuinely useful reporting stack without paying for a single subscription. X, Meta, LinkedIn, Google Analytics and TikTok all still hand over real, usable data for free, though what counts as “free” has shifted noticeably during 2026. The gap between free and paid has moved, not closed.
This guide covers the five tools worth building a stack around, what changed this year, and where a newer arrival, Threads, now fits in. If you would rather hand the reporting and the strategy behind it to a specialist, social media marketing for businesses from ProfileTree covers exactly this kind of ongoing account management.
Why Free Social Media Analytics Tools Still Matter
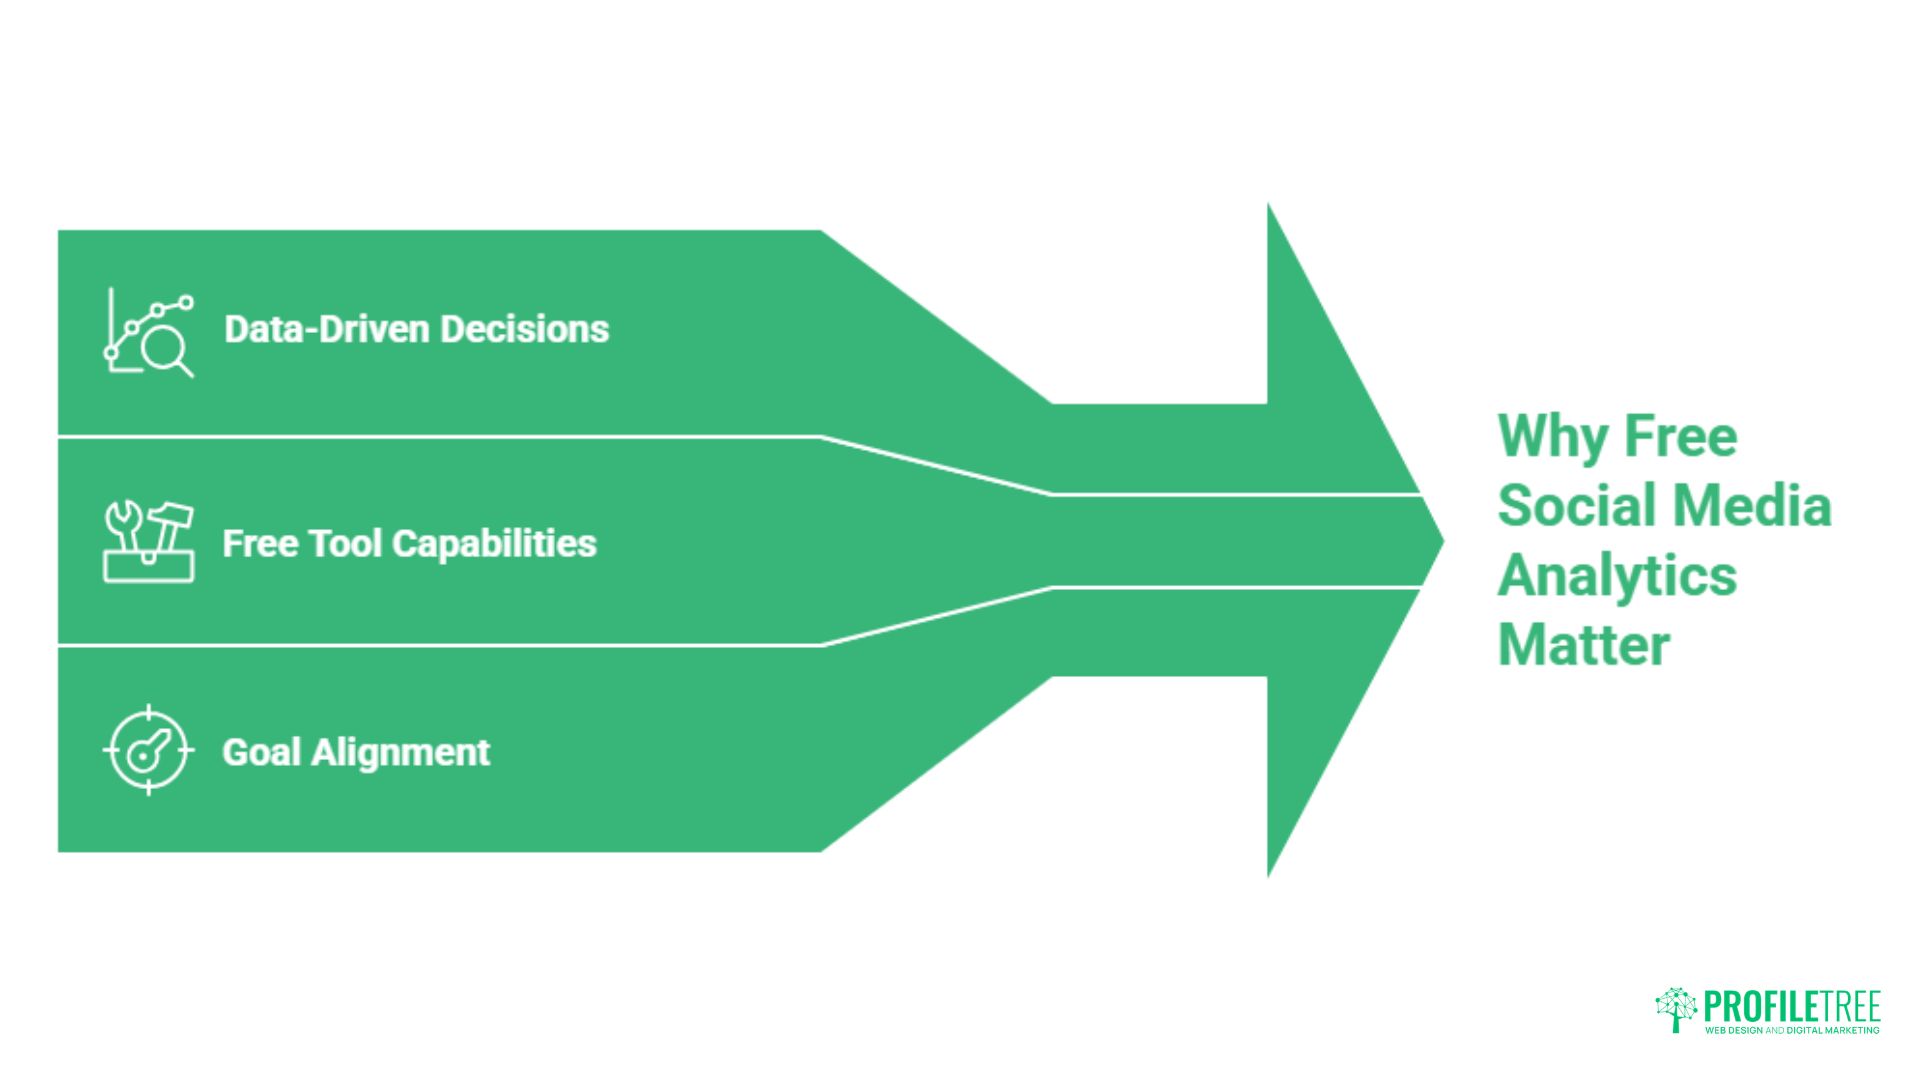
Guesswork costs money. Once you can see which posts drive real engagement and which do nothing, you stop spending time on content that goes nowhere. Free social media analytics tools give small teams the same starting point a paid agency works from: real numbers on reach, engagement and audience makeup.
That clarity counts most when budgets are tight. A clear read on performance tells you where to put effort next. If you want a team to turn that data into a running plan rather than a report nobody reads, ProfileTree’s digital strategy support builds that process around your numbers.
Free tiers cover the basics well: impressions, engagement rate, follower changes and top posts. Where they still fall short is long-term storage, deep cross-platform reporting and competitor tracking. Most SMEs and content creators won’t ever hit those limits; a paid plan only earns its cost once reporting volume genuinely outgrows what the free tools store.
Pick tools around the question you’re actually trying to answer. Want to know if a post landed? Native analytics do that job on their own. Want to know if social traffic turns into sales? You need website-side tracking too, which is where GA4 earns its place in the stack.
Comparing the Five Free Tools
You don’t need a large budget for useful insight. These five free social media analytics tools cover the platforms that matter most for UK and Irish SMEs, and each one has moved somewhere different over the past year.
| Tool | What’s free | 2026 change | Best for |
|---|---|---|---|
| X (Twitter) | Per-post stats on mobile: impressions, engagement, profile visits, link clicks | Full dashboard now needs X Premium ($8/month+); free tier lost the account-wide view | Brands posting mainly text updates and replies |
| Meta Business Suite | Cross-platform Facebook and Instagram reporting, Reels and Stories insight | Added Skip Rate and Share Rate for Reels; Views replaced Impressions as the core metric | Businesses running Facebook and Instagram together |
| Profile visits, content engagement, connection growth, company page reach | Added Saves and Sends as new free intent-based metrics | B2B and professional services marketing | |
| Google Analytics (GA4) | Social traffic analysis, conversion tracking, custom reports | New Source Group dimension cleans up messy social traffic names | Linking social activity to website conversions and sales |
| TikTok | Views, watch time, average watch duration, traffic source, territory | Full analytics stay free on any Business or Creator account | Short-form video performance tracking |
X (Twitter) Analytics
X’s own numbers have got harder to reach for free. Since 2024, the full account-level dashboard, follower trends, audience demographics, the monthly summary, has sat behind a paid plan. As of 2026, that plan is X Premium, which starts at $8 a month for the tier that switches on the desktop analytics dashboard.
Free accounts keep per-post analytics on mobile: tap the bar chart icon under any of your own posts and you’ll still see impressions, engagement, profile visits and link clicks for that post. For most SMEs, that per-post view plus a weekly spreadsheet rebuilds the trend line the free dashboard used to give you, at no cost.
Anyone whose reporting leans mainly on X will get more detail from ProfileTree’s dedicated guide to free Twitter analytics, which goes further into the platform than a general roundup can.
Regular exports matter here, since the free view doesn’t hold historical trends the way the old dashboard did. Watch engagement rather than raw follower counts, since engagement shows what’s actually connecting, and check peak posting times so content goes out while the audience is active.
Meta Business Suite (Facebook and Instagram)
Meta Business Suite still gives the biggest practical advantage on this list: joined-up reporting across Facebook and Instagram from one dashboard, all free.
2026 brought a real overhaul to the Instagram side. Reels insights added two new free metrics: Skip Rate, the share of viewers who scrolled past before the video played meaningfully, and Share Rate, the share of viewers who sent a Reel on to a Story, DM or elsewhere. Together they give a clearer read on whether content held attention rather than just whether it was seen. Meta also unified its measurement approach so Views now count from the moment content appears on screen, replacing the older Impressions metric and bringing Instagram’s reporting closer in line with TikTok’s.
Setting the suite up well takes a few steps: connect both accounts, build a dashboard around your actual goals, and check audience overlap between the two platforms so you’re not double-counting the same people. A fuller programme built around that data starts with a clear content plan, not just better dashboards.
LinkedIn Analytics
LinkedIn’s free analytics give B2B marketers a clear read on how content lands with a professional audience: profile visits, content engagement, connection growth and company page reach are all available at no cost.
2026 added two metrics worth watching closely: Saves, which tracks how many people bookmark a post, and Sends, which tracks how often a post gets shared through LinkedIn’s own messaging. Both signal genuine interest in a way a like doesn’t, since bookmarking or forwarding something takes more intent than a quick reaction.
Because LinkedIn carries so much of the UK and Ireland professional services market, consistent posting tends to beat occasional polished pieces. A steady run of useful content outperforms sporadic effort almost every time.
Google Analytics (GA4)
GA4 is mainly a website tool, but its free social tracking is still a key part of any stack, and it’s had one of the more useful updates of the year for anyone tired of messy attribution.
In June 2026, Google introduced a new Source Group dimension that cleans up scattered traffic source names. A Facebook campaign that used to show up across reports as facebook, fb, m.facebook.com and similar variants now rolls into one clean value, which matters because that fragmentation used to quietly split a single campaign’s numbers across several rows and understate its real impact. GA4 also added a Conversion Attribution Analysis Report, still in beta, which separates single-touch conversions from multi-touch journeys instead of giving all the credit to whichever channel closed the sale last.
To get value from this, set clear social goals, track the paths that lead to a conversion, and check whether the traffic your social channels send is actually converting once it lands. A well-built site makes this tracking far easier to read, which matters as much as the dashboard itself.
TikTok Analytics
TikTok’s built-in analytics stay free for any Business or Creator account, and they’re still the most detailed native dashboard here for video performance specifically. Switching account type takes a minute in settings, and it’s free.
The Content tab covers views, watch time, average watch duration, traffic source and territory breakdown for every video. The metric worth watching is average watch duration measured against video length rather than the view count on its own. A video held to most of the way through tells you far more about whether the idea landed than one with a big view number and a two-second drop-off. Territory data matters too for UK and Irish businesses, since a video pulling most of its views from outside your service area is entertaining people who can’t become customers.
The limit is the same as ever: TikTok reports on TikTok, and there’s a short reporting window on most metrics, so exporting your own numbers regularly still matters if you want a longer trend line.
What’s Changed in Free Analytics This Year
The market for free social media analytics tools hasn’t moved in one consistent direction this year, and that’s worth understanding before you build a reporting routine around any single platform.
X moved the opposite way to almost everyone else. Its full analytics dashboard, once free to any account, now sits behind a Premium subscription starting at $8 a month, part of a wider shift in which X’s own developer API dropped its free tier entirely in February 2026 in favour of pay-per-use pricing. If X carries a lot of your reporting, budget for that shift.
Meta, LinkedIn and Google all moved the other way, adding free depth rather than removing it. Instagram’s Skip Rate and Share Rate give a genuine read on whether a Reel held attention, not just whether it was seen. LinkedIn’s Saves and Sends surface intent-based signals that used to be invisible. GA4’s Source Group dimension fixes a data quality problem that had been quietly undercounting social campaigns for years, and it costs nothing to switch on.
The practical takeaway: don’t assume the tool you used to rely on for a metric still gives it away free, and don’t assume the platform that used to be limited still is. Check each one on its current terms rather than last year’s.
Threads: The Newest Addition to a Free Stack
Threads passed 300 million monthly active users in early 2026, which is enough scale that it’s worth a section of its own rather than a footnote under Instagram.
Native Threads Insights are free to anyone on a Professional or Creator account, and switching from a personal profile takes seconds. The dashboard covers six core metrics: views, likes, replies, reposts, quotes and follower changes, plus audience demographics by country, city, age range and gender. Business accounts see that demographic data from their very first post; personal and creator accounts need 100 followers before it becomes available.
The gaps are real, though. Threads doesn’t expose per-post link click data, engagement is calculated at the account level rather than per post the way Instagram does it, and there’s no built-in way to benchmark against competitors. For a platform this new, that’s a fair trade-off, but it means Threads works best as a supplement to the other five tools here, not a replacement for any of them.
Turning Analytics Into Decisions
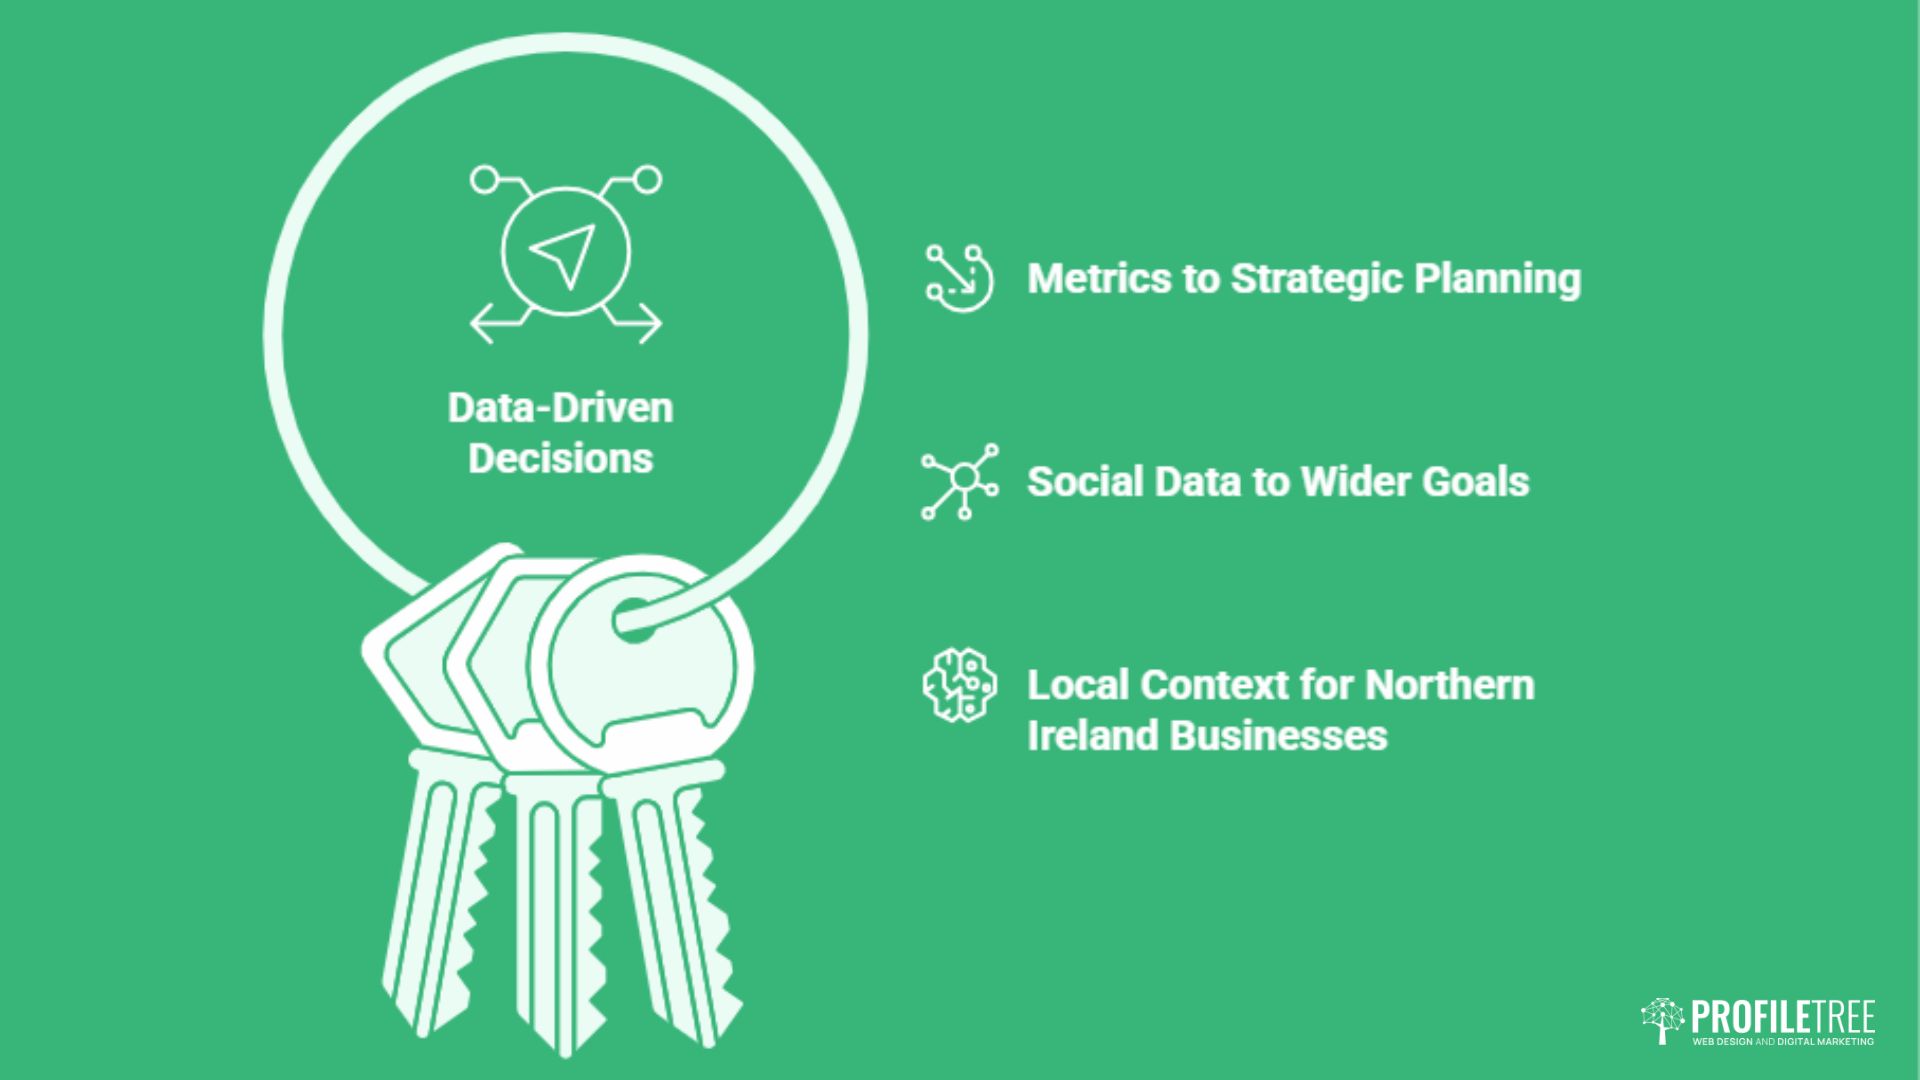
Free social media analytics tools only earn their keep once the numbers actually change what you do next. Collecting them is only half the job; it’s the reading on a rhythm and acting on what you find that pays off.
A weekly look at core metrics catches short-term shifts early. Monthly reviews reveal broader trends, and a quarterly check gives room for bigger strategic changes. Competitor benchmarking fits into this same rhythm, and it matters more for Northern Ireland businesses competing in tight regional markets than the raw numbers do on their own.
Once you know which posts perform, the next steps follow: refine posting schedules around peak times, work on the formats with weak engagement, and tighten targeting based on who actually responds. Track follower growth alongside retention too, since a loyal audience that stays engaged converts far better than one that churns through after a single viral post.
Social numbers mean more read alongside website and sales data. A spike in engagement only matters if it moves people toward an enquiry or a purchase, and pairing social analytics with GA4 closes that loop. The practical method: tag social links with UTM codes, set conversion goals in GA4, then check which platforms send traffic that actually converts rather than traffic that bounces. Reading the two data sets side by side stops you over-investing in reach for its own sake, and it’s the same logic ProfileTree walks through in more depth in this guide to how social media activity increases sales.
As ProfileTree founder Ciaran Connolly puts it, “The businesses that win on social media are the ones that read their own numbers honestly, not the ones chasing whatever worked for someone else.”
FAQs
Are free social media analytics tools accurate enough for business use?
Yes. Free tools track engagement, reach, impressions and follower growth accurately enough for the everyday needs of SMEs and content creators. The gaps show up in long-term historical data, deep cross-platform reporting and competitor tracking. Most businesses only need a paid plan once reporting volume genuinely outgrows what the free tiers store.
Can I track all social platforms with one free tool?
Rarely, since most native tools don’t cover more than one platform each, and full visibility across Facebook, Instagram, LinkedIn, TikTok, X and Threads usually means combining several. Building one custom report that pulls from each platform gives a single working view without paying for a consolidated dashboard.
How often should I review my social media analytics?
Review core metrics weekly to catch short-term changes and monthly to spot trends worth acting on. During an active campaign, check daily or twice a week so you can respond while a post is still live. A quarterly and annual review then covers the bigger strategic picture.
Can free analytics tools show a return on social media activity?
To a degree. Free tools mostly track on-platform metrics, but pairing them with GA4 through UTM parameters and goal tracking shows how social traffic feeds website conversions and sales. That combination gives a far clearer read on commercial return than social metrics alone.
What changed most in free social media analytics in 2026?
X moved the most, locking its full dashboard behind a paid Premium plan. Instagram, LinkedIn, GA4 and TikTok all went the other way, adding free metrics rather than restricting them. Threads also crossed 300 million users, making it worth tracking alongside the more established platforms.