Google Analytics for Content Marketing: A UK Measurement Guide
Table of Contents
Most content teams open Google Analytics, glance at a few traffic numbers, and close it again, none the wiser. The reports look busy, but they rarely answer the question that matters: Is this blog actually working? Google Analytics for content marketing only earns its keep when the data tells you what to write next, what to refresh, and what to quietly retire.
This guide is built around Google Analytics 4 (GA4) and written for UK and Irish marketers who need accurate measurement without breaking data protection rules. It covers the metrics worth watching, how to read engagement properly, and how to turn reports into editorial decisions.
You will also find practical setup steps, GDPR considerations under UK law, and a simple audit framework for deciding which posts to keep, improve, or remove.
Why GA4 Changed Content Measurement
GA4 replaced the old session-based model with an event-based one, and that shift matters more for content marketers than for almost anyone else. Where Universal Analytics counted pageviews and bounces, GA4 records what people actually do: how far they scroll, what they click, how long they stay genuinely engaged. The result is a clearer picture of whether your blog holds attention or just collects passing clicks.
From Sessions to Events
Every interaction in GA4 is an event. A pageview is an event, a scroll is an event, and a file download is an event. This gives content teams far finer detail than the old model allowed, because you can see the moments where readers commit or drop away. Understanding that a single change makes the rest of the interface far less intimidating.
The practical benefit of a blog is flexibility. Under Universal Analytics, tracking something like a click on an embedded video meant fiddly custom code. In GA4, enhanced measurement captures many of these interactions out of the box, so you spend less time configuring and more time reading what readers do. You can also build custom events for actions unique to your site, such as a click on a pricing table or an expansion of an FAQ accordion.
Once you accept that events drive everything, the next question is which numbers to trust.
Engagement Rate Replaces Bounce Rate
Bounce rate often misleads content marketers. A reader could land on a 2,000-word article, read every word, leave satisfied, and still register as a bounce. GA4 counts an engaged session instead: one lasting longer than ten seconds, triggering a key event, or covering two or more pageviews. For a blog, that is a much fairer measure of whether the writing did its job.
The shift also reframes how you judge a single landing page. A reference article that answered a question completely and left the reader happy was always punished by bounce rate, even though it did exactly what it should. Engagement rate corrects that bias by rewarding genuine attention rather than penalising a satisfied exit. When you report content results internally, this is the metric that tends to change minds about which posts truly earn their place.
Average Engagement Time
GA4 reports average engagement time rather than time on page. The distinction is real: it only counts seconds when the tab is actually in focus, so background tabs no longer inflate your figures. For content performance, this is the closest GA4 gets to telling you whether people are reading or skimming. Pair it with scroll data, and you can see the difference between a post that gets read and one that gets abandoned halfway. Strong measurement habits sit at the heart of any sensible digital strategy plan.
The UK Compliance Layer for Tracking
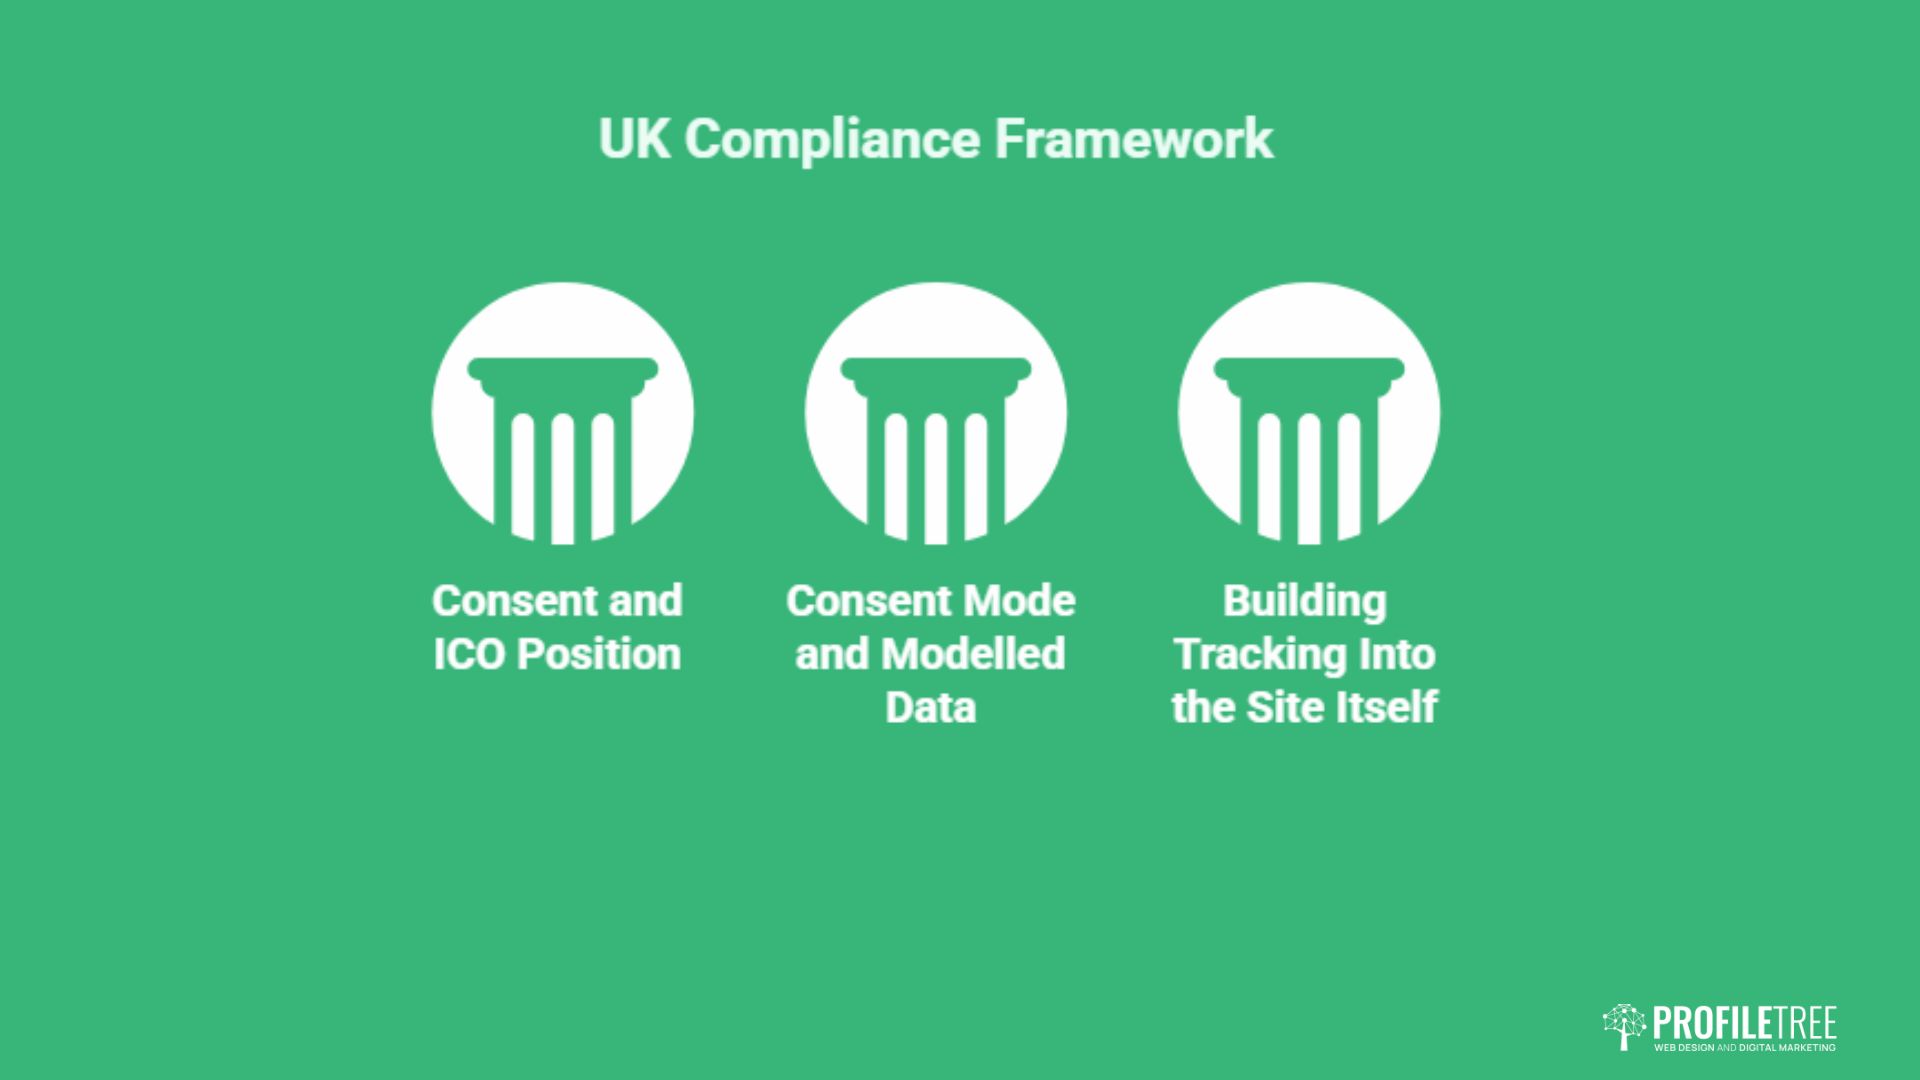
Accurate content data in the UK and Ireland depends on getting consent and privacy settings right. The Information Commissioner’s Office (ICO) treats analytics cookies as non-essential, which means you usually need consent before they fire. Ignore that, and you risk both fines and badly skewed data.
Consent and the ICO Position
The ICO is clear that analytics cookies require user consent under the Privacy and Electronic Communications Regulations. A cookie banner that drops GA4 before the visitor agrees is a compliance problem, not a clever workaround. Configure your banner so analytics only loads after consent, and document that choice. The ICO publishes practical guidance on cookies and similar technologies at ico.org.uk.
Consent Mode and Modelled Data
When some visitors decline cookies, you lose direct measurement from them. Google’s Consent Mode allows GA4 to fill those gaps with modelled estimates rather than leaving holes in your reports. It is not perfect data, but it keeps trends readable. For UK content teams, the professional stance is simple: trust the direction of travel, not the exact totals.
This matters more than many marketers expect. In privacy-conscious markets, a meaningful share of visitors decline analytics cookies, which means a portion of your content data is always estimated rather than observed. Reporting a single blog post’s pageviews to two decimal places gives false confidence. Comparing this quarter’s engagement trend against last quarter’s, on the other hand, stays reliable because the modelling applies consistently. Build that caveat into how you talk about results, especially with clients who want certainty that the data cannot honestly provide.
Getting this configuration right often needs a technical hand, which is where a properly built site helps.
Building Tracking Into the Site Itself
Reliable measurement starts with clean implementation. Tags that fire twice, missing events, or a consent banner bolted on as an afterthought all corrupt the numbers before you even open a report. A well-structured build keeps tracking tidy from the start, which is why analytics planning belongs in any serious website development project rather than being patched in later.
As Ciaran Connolly, founder of ProfileTree, puts it: “Clients often ask which metric proves their content is working. The honest answer is that no single number does. What matters is reading engagement, conversions and consent data together, then acting on the pattern rather than chasing one figure.”
Content Metrics Worth Tracking
Pageviews alone tell you almost nothing about content quality. The metrics below show whether your blog genuinely serves readers and moves them toward becoming customers. Each one answers a different question, and together they form a usable scorecard.
Engaged Sessions and Engagement Rate
Engagement rate is the share of sessions that count as engaged. A high figure on a blog post suggests the topic, headline, and opening all delivered on their promise. A low figure usually indicates a mismatch between what the searcher wanted and what the page provided. Watch this metric per page, not just site-wide, or strong posts get hidden behind weak ones.
Scroll Depth and Key Events
GA4’s enhanced measurement tracks scrolls automatically, firing an event when a reader reaches 90% of the page. Combine that with low engagement time, and you have a clear diagnosis: the content is being skimmed, not read. Mark the events that matter most, such as a newsletter sign-up or a contact click, as key events so they show up as conversions.
Conversions From Content
The point of most business blogs is to support sales, so track what happens after the read. A downloaded guide, a form submission, or a click through to a product page all show content pulling its weight. Mapping these conversions back to specific articles tells you which topics attract buyers rather than just browsers, a question at the centre of effective content marketing services.
For business-to-business sites, the link between content and sales is rarely direct. A reader might find a blog post in January, return to a newsletter in March, and request a quote only in May. GA4’s attribution settings let you credit content that assisted a conversion rather than just the last click before it. Switching from last-click to a data-driven attribution model often reveals that top-of-funnel articles do far more commercial work than a simple conversion count suggests. For long sales cycles, that fuller picture is the difference between cutting a post that looks unproductive and protecting one that quietly feeds your pipeline.
Traffic Sources and Acquisition
Knowing where readers come from shapes where you invest. In GA4, you find this under Reports, then Acquisition, then Traffic Acquisition. Organic search still drives the bulk of blog traffic for most businesses, but social and referral channels can reveal which platforms suit your topics. If a region matters to you, segment by country to see how local content performs in places like Belfast, Dublin, or Manchester.
Regional segmentation is underused by content teams, yet it answers a genuinely useful question: is your locally focused content reaching local readers? A guide aimed at Northern Ireland businesses that draws most of its traffic from the United States is either mistargeted or attracting the wrong audience. By filtering traffic by region, you can measure whether a localised campaign actually lands where intended, then double down on the formats and topics that connect with the audience you want.
Building a Content Performance Report
GA4’s default reports rarely show content the way a marketer thinks about it. A few minutes of setup gives you a view organised around pages, engagement, and conversions instead of generic traffic totals. The two reports below cover most day-to-day content questions.
The Pages and Screens Report
Start in Reports, then Engagement, then Pages and screens. This lists every URL with engagement time, views, and key events side by side. Sort by engagement time to find your genuinely strong articles, then sort by conversions to find the ones quietly generating leads. The gap between those two lists is often where your best opportunities hide.
Add a secondary dimension to sharpen the view further. Layering in session source, for example, shows whether a high-performing article earns its engagement from search, social, or email, which in turn tells you where to promote similar content. You can also apply a date comparison to spot posts trending up or down month on month, turning a static table into an early warning system for content decay.
Path and Exploration Reports
The Explore section lets you build a free-form path exploration, showing the routes readers take after landing on a blog post. You can see whether an article sends people deeper into the site or straight back to search. Spotting where readers exit tells you which posts need a stronger internal link or a clearer next step. For a visual walkthrough of setting up reports like these, the video below offers a useful starting point.
Custom Dashboards in Looker Studio
For reporting to clients or colleagues, a Looker Studio dashboard pulls GA4 data into a clean, shareable view. You can show engagement rate, top articles, and conversions on a single screen without anyone needing to log into GA4. Keep it focused: four or five metrics that tie to business goals beat a wall of charts nobody reads. Clear reporting also supports stronger search engine optimisation decisions over time.
Turning Data Into Editorial Decisions
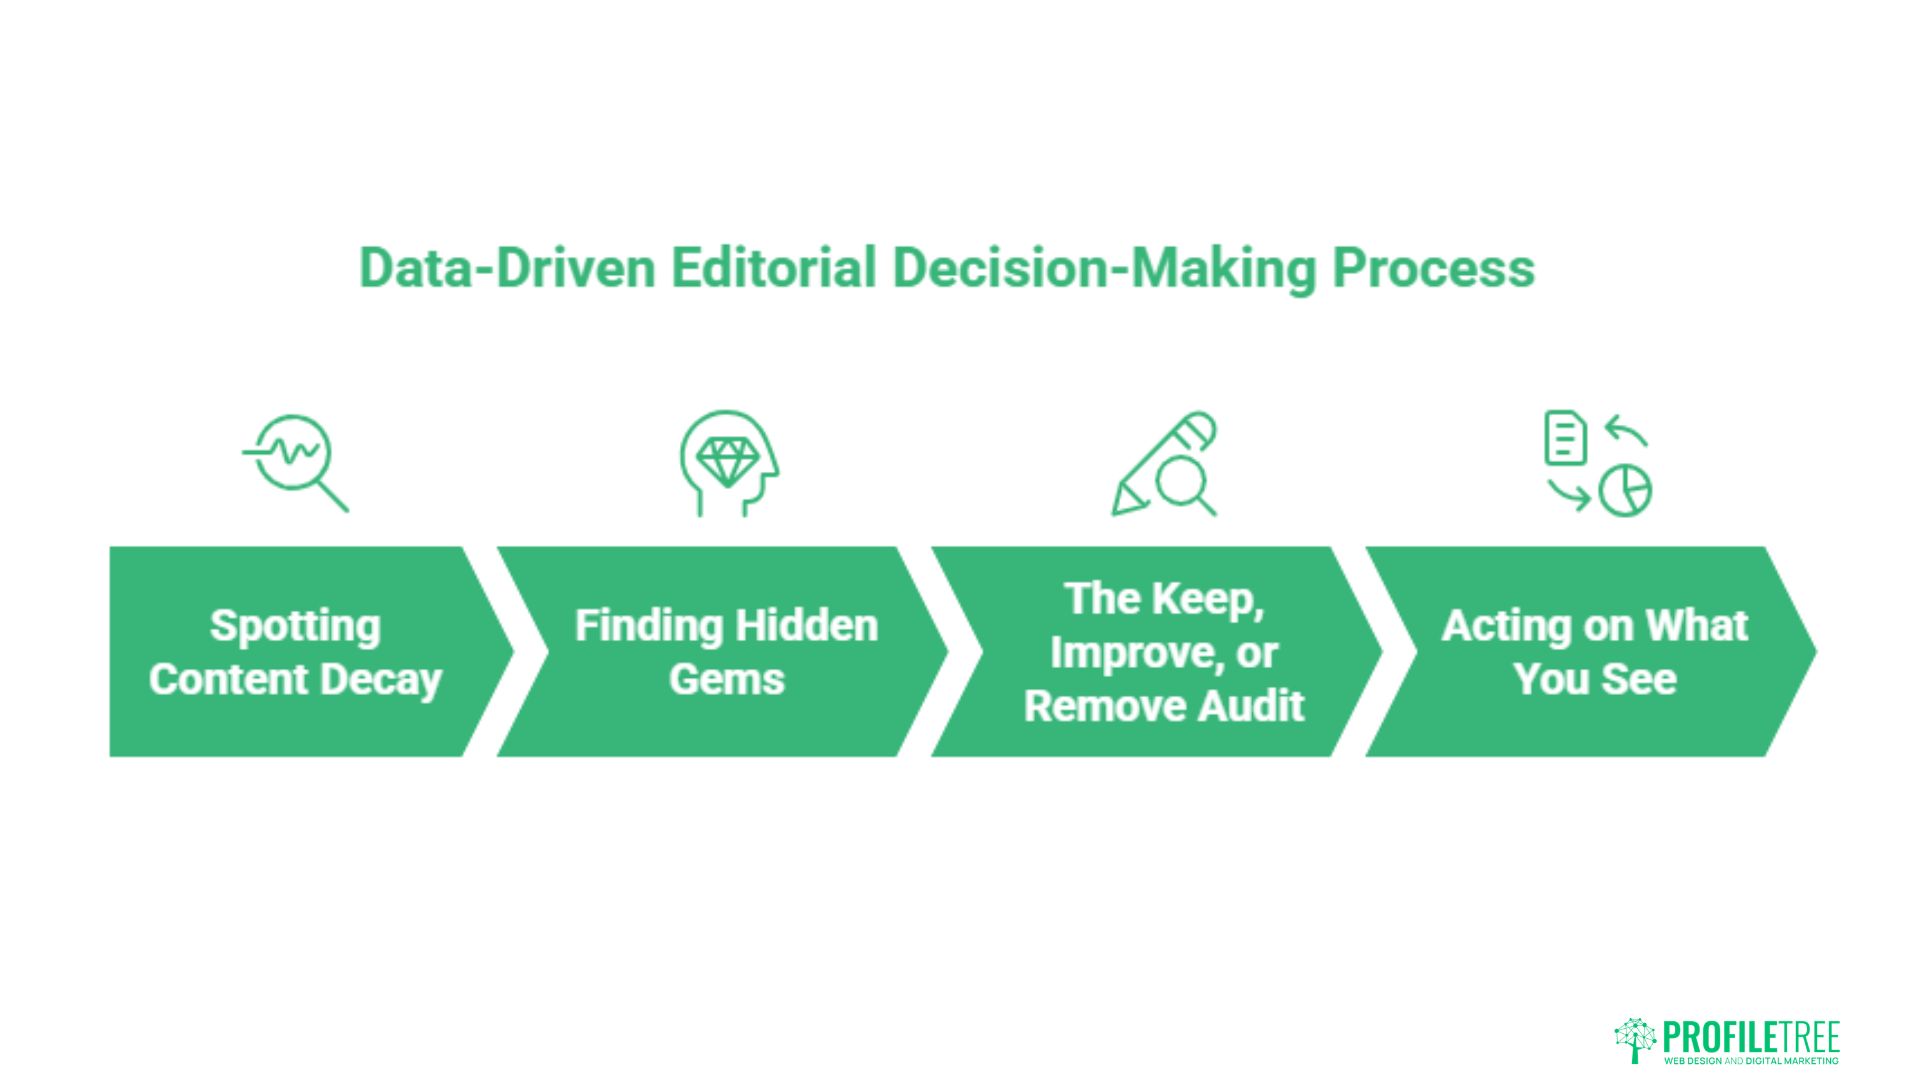
Reports only pay off when they change what you publish. The framework below turns GA4 numbers into a simple keep, improve, or remove decision for every article, which keeps your blog sharp rather than bloated. Belfast remains a lively hub for digital and creative work, and you can read more about the region’s appeal across Northern Ireland’s cities.
Spotting Content Decay
Decay shows up as falling engagement and slipping traffic on a post that once performed well. Often, the information is dated, a competitor has published something fuller, or search intent has shifted. Catch it early by reviewing your top pages quarterly, and refresh before the decline becomes terminal. A genuine refresh means new sections and current figures, not a swapped date.
Finding Hidden Gems
Some posts attract little traffic yet convert strongly when people do find them. These hidden gems deserve investment: better internal links, a sharper title, or promotion through your channels. GA4’s per-page conversion data is exactly how you surface them, since site-wide averages bury this kind of detail.
The Keep, Improve, or Remove Audit
Run every article through three outcomes. Keep the posts with healthy engagement and conversions and leave them alone. Improve the ones with traffic but weak engagement, since the demand exists and only the content lets it down. Remove or consolidate the thin posts that earn neither traffic nor conversions, as they dilute your site’s overall authority. Repeating this audit twice a year keeps a blog lean and credible.
Consolidation deserves particular attention. If three short posts each cover a fraction of the same topic, none rank well, and all compete with one another. Merging them into a single thorough article, then redirecting the old URLs, usually beats keeping three weak pages alive. GA4 gives you the evidence to make that call without guesswork, showing which of the three earns the engagement worth preserving.
Acting on What You See
Each pattern has a sensible response. High scroll depth with low engagement time means readers are skimming, so add subheadings, visuals, or a summary near the top. Strong engagement with no conversions means the content informs but never asks, so add a clear next step. Building these habits across a team is far easier with structured digital training support so everyone reads the data the same way.
The habit worth forming is a short monthly ritual rather than a heroic annual audit. Twenty minutes spent reviewing the top and bottom performers, noting one action for each, compounds over a year into a far sharper blog. Data only improves content when someone owns the follow-up, so assign that responsibility to a named person and give them the authority to commission refreshes, redirects, and removals.
Conclusion
Google Analytics rewards content teams who treat it as a decision tool rather than a scoreboard. Track engagement, conversions, and consent together, audit your posts twice a year, and act on the patterns you find. Done properly, GA4 tells you exactly where to spend your next hour of writing. If you want expert help setting up a measurement that respects UK privacy rules, talk to ProfileTree about your content goals.
FAQs
How do I track blog post conversions in GA4?
Mark the action you care about, such as a form submission or newsletter sign-up, as a key event in GA4. Key events are GA4’s version of conversions, and once set, they appear against individual pages so you can see which articles drive results.
Why did my bounce rate change in GA4?
GA4 dropped the old bounce rate in favour of the engagement rate, which counts positive behaviour instead of single-page exits. A reader who stays ten seconds, converts, or views two pages now counts as engaged, giving a fairer read on content quality.
Is GA4 GDPR compliant for UK businesses?
GA4 can be used compliantly, but it is not automatic. You generally need consent before analytics cookies fire, and the ICO treats them as non-essential. Configure a proper consent banner and consider Consent Mode to keep data usable.
How do I track PDF downloads from my blog?
GA4’s enhanced measurement usually captures file downloads automatically, including PDFs. Check that file download tracking is switched on in your data stream settings, then verify the event appears after a test download.
Can I still see time on the page in GA4?
GA4 reports average engagement time rather than time on page. It only counts seconds when the browser tab is in focus, so the figure better reflects real reading attention than the older, easily inflated metric.