Website KPIs: 7 Smart Metrics to Drive Business Growth
Table of Contents
Most website owners track the wrong numbers. Total page views look impressive in a Monday morning report, but they rarely tell you why enquiries are up or down, which traffic source is worth your ad spend, or whether your new landing page is actually converting visitors into leads.
Website KPIs (key performance indicators) are a small set of measurable signals that connect your online activity to real business outcomes. The right website KPIs for your business will depend on your goals, your audience, and how your site generates revenue. When you’ve chosen them well, a single glance at your dashboard tells you whether your web analytics strategy is working.
This guide covers the seven website KPIs that consistently matter for SMEs, explains how to find each one using your Google Analytics KPI data, and gives you UK-specific benchmarks so you can measure website performance against real industry standards. By the end, you’ll know exactly which KPIs for websites deserve space on your reporting dashboard.
What Is a Website KPI?
Before you can use website KPIs effectively, it helps to understand the difference between a metric and a website key performance indicator, because they’re often used interchangeably when they mean quite different things.
A metric is any number your web analytics platform can record: page views, sessions, time on page, and bounce rate. A website KPI is a metric you’ve deliberately chosen because it connects to a business goal. Total sessions are a metric. Organic sessions that lead to enquiry completions are a website KPI. The website key performance indicators you select should reflect the outcomes that matter to your business.
The distinction matters because most web analytics platforms will give you fifty metrics at once. Choosing the right KPIs for websites means asking: “If this number changes, does it change our revenue or our costs?” If the answer is yes, it belongs on your dashboard. If the answer isn’t really, it’s background data at best.
Metric vs KPI: A Practical Distinction
Think of it this way. If your bounce rate rises from 55% to 70% on your services page, that’s a metric change. But if that bounce rate is a website KPI tied to a cost-per-lead goal, then that change triggers action: you review the page copy, the CTA, the load speed. The difference between a metric and a website key performance indicator is whether it drives a decision.
A good set of KPIs to measure website performance will cover three areas: how people find your site (acquisition), what they do when they arrive (engagement), and whether they complete a valuable action (conversion). Everything else is context.
The 7 Website KPIs Every SME Should Track
Not every website needs the same dashboard. The right KPIs for websites vary by business model: an e-commerce site in Belfast tracks average order value differently from a B2B consultancy in Dublin, measuring inbound leads. That said, the seven website KPIs here apply across almost every business type and give you a solid foundation to build your web analytics reporting from.
| Website KPI | What It Measures | Business Action if It Drops |
|---|---|---|
| Organic sessions | Visitors arriving from unpaid search | Review content quality, technical SEO, and Google rankings |
| Bounce rate (by page) | Visitors who leave without further interaction | Audit page relevance, load speed, and CTA clarity |
| Conversion rate | Percentage of visitors completing a target action | Test copy, form design, and trust signals |
| Average session duration | How long visitors engage with your content | Improve content depth and internal linking |
| Traffic by source | Which channels drive your visitors | Shift budget toward the highest-ROI channels |
| Cost per acquisition (CPA) | What do you spend to win one lead or sale | Optimise paid campaigns and conversion pages |
| Page load speed (Core Web Vitals) | Technical performance across devices | Compress images, review hosting, fix render-blocking scripts |
Category 1: Acquisition and Traffic Website KPIs
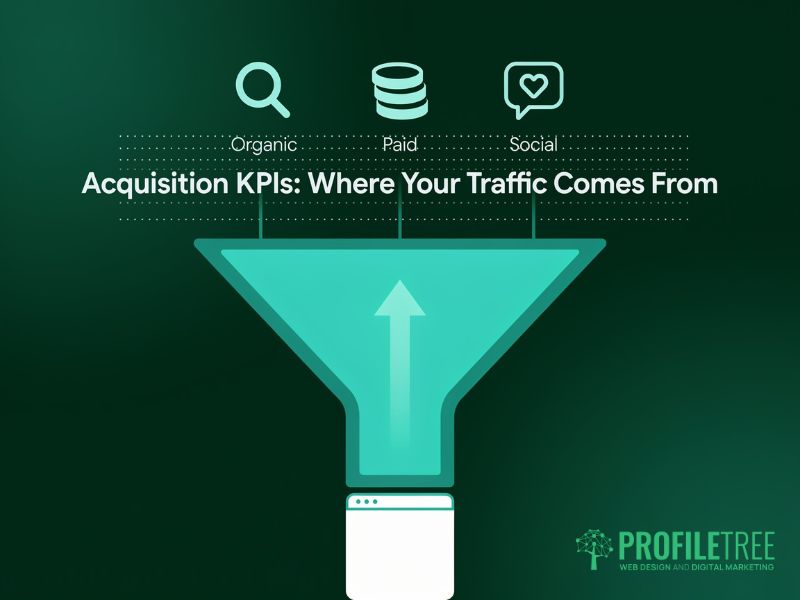
Acquisition website KPIs tell you how people find your site. These are the top-of-funnel indicators showing whether your SEO, paid media, and content investment is pulling in the right visitors. Tracking KPI for website traffic at the channel level is far more useful than monitoring a single total sessions figure, because it tells you which sources are actually worth your time and budget.
Organic Sessions
Organic sessions remain the most important website KPI for businesses investing in search. Unlike paid traffic, organic growth compounds over time: a page ranking well today continues to bring visitors months or years later without additional spend. It’s one of the clearest website performance KPIs for measuring the return on your SEO investment.
In GA4, find this under Reports > Acquisition > Traffic Acquisition. Filter by the Session default channel group and look for Organic Search. Watch your Google Analytics KPI trend over 90-day windows rather than week-by-week; they’re more reliable. Organic traffic fluctuates naturally with seasonality and Google algorithm updates, so short windows can mislead.
For UK SMEs, a useful secondary KPI within organic acquisition is share of voice: how visible your site is across your target keyword set compared to competitors. Paid SEO tools measure this at scale, though GA4 alone won’t give you the full picture.
KPI for Website Traffic: Source and Medium
Breaking your traffic into acquisition channels is one of the most actionable website KPIs available. When you track KPI for website traffic by source (organic, direct, paid, social, referral, email), you can see which channels are pulling their weight and which ones are quietly wasting budget. That’s where the gains are.
UK B2B businesses typically see organic search and direct traffic as their two largest sources. If social media accounts for a significant chunk of your marketing effort but under 5% of sessions, that’s useful information. If referral traffic converts at twice the rate of organic, you know where to invest more in partnerships. Monitoring this website’s performance KPI monthly helps you spot channel decay early.
In GA4, Traffic Acquisition breaks down sessions by channel. Build custom comparisons to see which sources deliver the best conversion rates, not just the highest raw volume.
New vs Returning Users
New vs returning user split is a website KPI that reveals whether your acquisition efforts are building repeat audiences. A high proportion of new users suggests your reach is growing; a high proportion of returning users signals that your content and user experience are strong enough to bring people back.
For service businesses, a healthy benchmark is roughly 60 to 70% new users. Returning users are warmer prospects who are closer to making a decision, so track what pages they visit when they come back. That behaviour data is some of the most valuable web analytics KPI insight you’ll find in GA4.
Category 2: Website Engagement KPIs
Once visitors arrive, website engagement KPIs tell you what they do next. This category of website KPIs covers whether your content matches what people came looking for, how deeply they interact with your pages, and whether they’re moving toward a conversion or bouncing back to the search results. Website engagement KPIs are the clearest signal of content quality available in web analytics.
Bounce Rate by Page
Bounce rate is one of the most misunderstood website KPIs for measuring website performance. A high bounce rate on a blog post is often perfectly fine: users read the article and leave satisfied. A high bounce rate on a service or product page is a problem, though, because those pages are designed to prompt a next action. Context is everything when interpreting this website engagement KPI.
GA4 replaced the traditional bounce rate metric with the engagement rate: the percentage of sessions lasting more than 10 seconds, including a conversion event or two or more page views. For practical purposes, treat both as web analytics KPIs you’ll want to review together. High engagement rate is good; high bounce rate on commercial pages needs investigation.
UK averages by industry vary considerably. E-commerce sites typically see bounce rates between 30% and 55%. B2B lead-generation pages can expect 40 to 65%. If your services pages are seeing bounce rates above 70%, that’s a signal to act and prioritise a page-by-page content and UX review as part of your broader effort to improve website performance KPIs.
Average Session Duration and Scroll Depth
Average session duration and scroll depth are website KPIs that give you a reliable signal of content quality. Session duration tells you how long users stay; scroll depth tells you how far down a page they actually read. Together, they’ll tell you whether your content is genuinely holding attention or losing people in the first paragraph.
A session duration under 30 seconds on a long-form guide suggests users are leaving immediately. Either the page isn’t matching search intent, or it’s loading too slowly on mobile. A session duration above three minutes on a services page is a strong positive web analytics KPI signal; that user is reading carefully and likely evaluating whether to contact you.
Set up scroll depth tracking in GA4 via Enhanced Measurement. GA4 fires a scroll event when a user reaches 90% of a page by default. Create custom events for 25%, 50%, and 75% thresholds if you want more granular website engagement KPI data to inform content decisions.
Page Load Speed and Core Web Vitals
Page load speed sits at the intersection of website engagement KPIs and technical SEO. Google’s Core Web Vitals (Largest Contentful Paint, Cumulative Layout Shift, and Interaction to Next Paint) are ranking factors as well as user experience indicators, making load speed a website KPI with direct impact on both traffic and engagement.
Check your Core Web Vitals in Google Search Console under Experience > Core Web Vitals. Pages rated Poor for LCP above 2.5 seconds are losing rankings and users; that’s a double hit. For most UK SME websites, the biggest wins when working to improve website performance KPIs come from image compression, reducing third-party scripts, and reviewing hosting quality.
Category 3: Conversion and Revenue Website KPIs
Conversion website KPIs are where web analytics connects directly to business results. These are the numbers that belong in a board report, because they’re the translation between digital activity and language every stakeholder understands: leads, revenue, and cost. Tracking KPIs to measure website performance at the conversion level tells you whether your site is earning its place in your marketing budget.
Conversion Rate by Channel
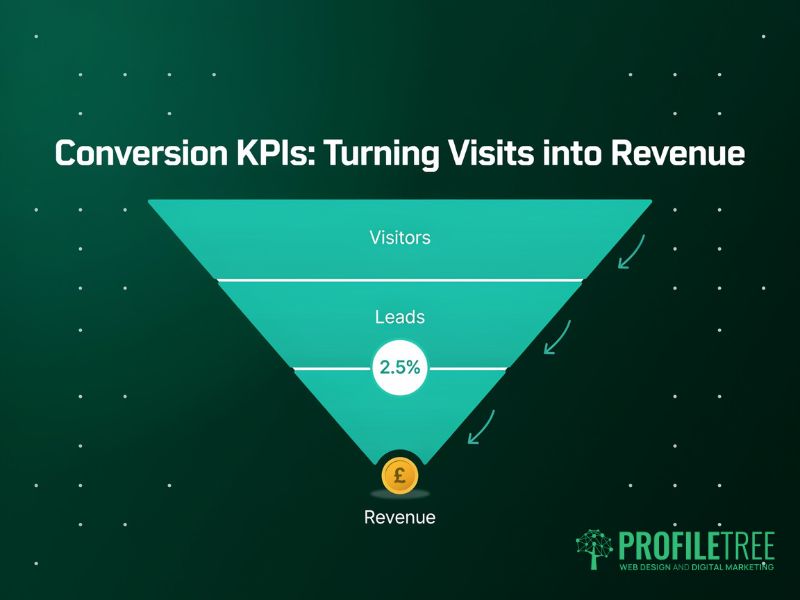
Your overall conversion rate is a useful website KPI; your conversion rate by channel is far more useful. It’s one of the most important KPIs to measure website performance because it tells you not just that conversions are happening, but which acquisition sources are sending you visitors who actually buy or enquire.
UK e-commerce conversion rates average between 1% and 4%, depending on the sector. B2B lead-generation sites typically see form completion rates between 1% and 3% of all sessions. If your rate sits well below these benchmarks, the issue is almost always one of three things: the wrong traffic, a weak CTA, or friction in the conversion journey. Your web analytics KPI data should help you isolate which of these applies.
ProfileTree supports clients across Northern Ireland and the UK in diagnosing exactly these issues. Our search engine optimisation services focus on attracting qualified traffic (visitors already looking for what you offer), because improving traffic quality is often more effective than redesigning a landing page.
Cost Per Acquisition
Cost per acquisition (CPA) is the total marketing spend divided by the number of conversions in the same period. It’s the clearest website performance KPI for measuring whether your marketing is profitable, and it makes it straightforward to compare the efficiency of different channels.
If your paid search CPA is £45 and your organic CPA is £12 (accounting for content and SEO costs), you’ve got a clear case for investing more in organic. If your referral CPA is £8 and your social CPA is £90, the website KPI data tells you where the smart money goes. This kind of channel-level analysis is where tracking KPIs for websites creates direct commercial value.
Track CPA per channel using your Google Analytics KPI reports by setting up conversion events and linking your Google Ads account. For organic and content, calculate it manually by dividing total SEO and content spend by organic conversions over the same period.
Average Order Value and Lead Quality
For e-commerce businesses, average order value (AOV) is a revenue website KPI that sits alongside conversion rate. A site that’s converting at 2% with an AOV of £180 outperforms one converting at 3% with an AOV of £60. Tracking both gives you a complete picture of commercial website performance KPIs.
For B2B and service businesses, the equivalent is lead quality. Not all enquiries are equal. A qualified lead from an SME decision-maker is worth considerably more than a general enquiry. Tag enquiry sources in GA4 to track which channels produce your highest-quality leads, not just the highest volume. That nuance is often missing from basic web analytics KPI reporting.
The GA4 Reality Check: Finding Your Website KPIs
Most older guides on website KPIs were written for Universal Analytics. GA4 uses a different data model, and many report locations, metric names, and default measurements have changed. This section tells you exactly where to find each website KPI covered in this guide using your Google Analytics KPI reports.
| Website KPI | GA4 Report Location | Key Note |
|---|---|---|
| Organic sessions | Reports > Acquisition > Traffic Acquisition | Filter: Session default channel group = Organic Search |
| KPI for website traffic | Reports > Acquisition > Traffic Acquisition | Use channel groupings; compare by goal completion rate |
| Bounce / Engagement rate | Reports > Engagement > Pages and Screens | GA4 defaults to Engagement Rate; add Bounce Rate via Customise |
| Session duration | Reports > Engagement > Pages and Screens | GA4 reports Average Engagement Time; replaces session duration |
| Scroll depth | Reports > Engagement > Events | Enable Scroll in Enhanced Measurement; fires at 90% by default |
| Conversion rate | Reports > Engagement > Conversions | Set up key events first; divide conversions by sessions for CVR |
| Core Web Vitals | Google Search Console > Experience | Not in GA4 natively; use Search Console or PageSpeed Insights |
One practical note for UK businesses: a cookie consent banner (required under UK GDPR) creates a gap between reported and actual traffic. GA4 uses modelled data when users decline consent. Flag this in your website performance KPI reporting and note that figures may understate total sessions by 20 to 35%, depending on your sector and audience profile.
Our digital strategy services include analytics configuration, GA4 setup, and a KPI dashboard build for clients who want reliable web analytics KPI data from day one, rather than inheriting a misconfigured tracking setup.
Reporting Website KPIs to Stakeholders
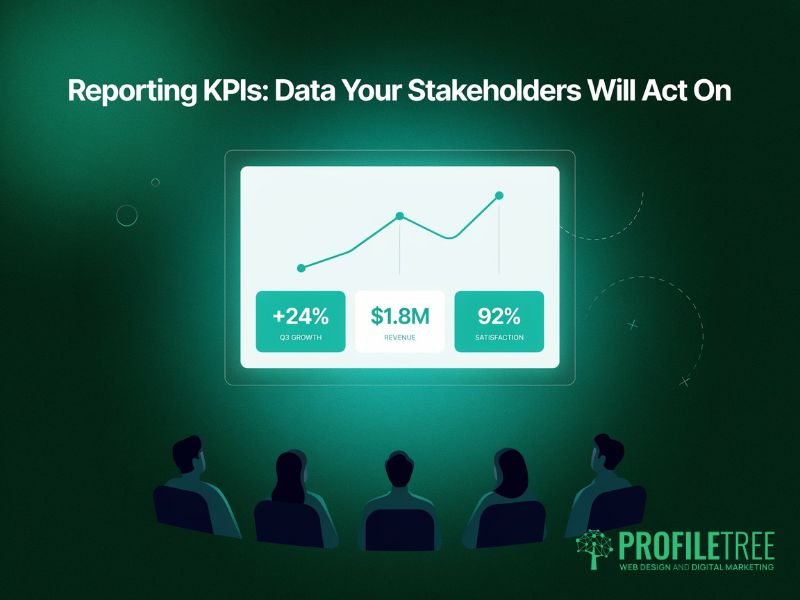
Collecting website KPIs is one thing. Translating them into a report that a business owner or leadership team can act on is another challenge entirely. Most KPI for website dashboards fail not because the data is wrong, but because it’s presented without context. A four-step framework helps.
Step 1: Agree on Which KPIs to Measure Before You Report
Before you build any dashboard, agree with your stakeholders on which website KPIs matter and why. If a director cares about cost per lead, report that website performance KPI. If the owner wants to know which pages drive enquiries, show them. Reporting web analytics KPI data nobody asked for produces dashboards nobody reads. The KPIs to measure website performance that matter are the ones your stakeholders will act on.
Step 2: Show Trends, Not Snapshots
A single month’s Google Analytics KPI data tells you almost nothing in isolation. Three months plotted against traffic volume tells you whether a trend is developing. Always present website KPIs in the context of change over time, and note external factors (algorithm updates, seasonal shifts, campaign launches) that might explain movements in your KPIs to measure website performance.
Step 3: Connect Website KPIs to Business Outcomes
“Organic sessions increased 18% this quarter” is fine. “Organic sessions increased 18%, contributing to 22 additional enquiries at our average close rate” is what gets stakeholder buy-in. Link every website KPI movement to revenue impact wherever your web analytics data allows. This is how website key performance indicators earn their place in a board report.
Step 4: Flag What You Will Do Next
Every website KPI report should end with a short action section: what the data suggests and what you’ll prioritise in the next period. This closes the loop between measurement and strategy. KPIs for website performance only create value when they drive decisions, not when they sit in a spreadsheet.
ProfileTree’s digital training courses cover GA4 setup, KPI reporting, and web analytics KPI interpretation for marketing teams and business owners who want to build this capability in-house.
How ProfileTree Helps You Track the Right Website KPIs
Many businesses across Northern Ireland and the UK come to us with the same problem: they have web analytics data but no insight. GA4’s set-up, a dashboard exists, but the monthly report doesn’t tell them which website KPIs to act on or why the numbers are moving.
ProfileTree, a Belfast-based web design and digital marketing agency established in 2011, takes a practical approach to website KPIs. We start by agreeing on the KPIs to measure website performance that connect to your specific business goals, not a generic list of web analytics metrics, and then configure your tracking to measure them accurately.
Whether you need help with content marketing to build topical authority, a digital strategy that aligns your channels around shared website KPIs, or digital training that gives your team the skills to interpret web analytics KPI data and act on it, we work with you to make your website performance KPIs genuinely useful.
If your current website KPIs aren’t driving decisions, get in touch to discuss what a properly configured dashboard looks like for your business.
FAQs
1. Which website KPI is best for measuring traffic?
Organic sessions are the most useful single KPI for website traffic for businesses focused on long-term growth, because it reflects the compound value of your SEO investment. If you run paid campaigns, track KPI for website traffic by channel so you can compare quality and cost across each source. Monitoring organic sessions alongside your Google Analytics KPI data gives you the clearest picture of whether your search investment is working.
2. How many KPIs for websites should a business track?
Five to seven website KPIs are a practical limit for most SMEs. More than that, and your dashboard becomes difficult to act on. Start with one website performance KPI from each category in this guide (acquisition, engagement, conversion), then add KPIs for websites as your reporting maturity develops. Tracking fewer web analytics KPIs with genuine attention is far more valuable than monitoring fifty metrics you never act on.
3. What are the best website KPIs for a brand-new site?
For a new site, focus on health and indexation KPIs to measure website performance before chasing revenue metrics. Track: pages indexed in Google Search Console (are pages being discovered?), Core Web Vitals scores (is the site technically sound?), and click-through rate from search (does your title and meta description make people want to click?). These website key performance indicators establish a baseline before conversion KPIs become meaningful.
4. How do I track website KPIs without cookie consent?
Server-side tracking moves data collection to your server, reducing reliance on browser cookies while remaining GDPR-compliant. For UK businesses, implement Consent Mode v2 in GA4, which models behaviour for users who opt out and gives you more reliable Google Analytics KPI data without violating privacy requirements. This is now the recommended approach for tracking web analytics KPIs under UK GDPR.
5. What is a good conversion rate for a UK website?
UK e-commerce sites average 1% to 4%, with fashion at the lower end and specialist or subscription products often above 3%. UK B2B lead-generation pages typically convert between 1% and 3% of sessions, though high-intent pages can reach 5% to 8%. Treat these as context for your own website performance KPIs, not as fixed targets: always measure your conversion rate against your own historical baseline first.