How Marketing Analytics Statistics Can Boost Your ROI
Table of Contents
For most small and medium-sized businesses in Northern Ireland and across the UK, digital marketing spend is significant enough to matter but rarely scrutinised with enough rigour to prove its value. A business might be running Google Ads, posting across three social channels, and investing in SEO simultaneously, yet have no clear view of which activity actually drove their last ten enquiries. That is the problem marketing analytics exists to solve.
This guide covers what marketing analytics is, the four types every SME should understand, the metrics that connect marketing activity to business outcomes, and how to build a measurement approach that works within UK data protection rules. It also addresses where the common gaps are — because most analytics guides are written for enterprise teams with dedicated data functions, not for business owners doing this alongside everything else.
What is Marketing Analytics?
Marketing analytics is the practice of measuring, managing, and analysing marketing performance to understand what is working, what is not, and where to invest next. At its core, it turns marketing activity into quantifiable business data: traffic, leads, conversions, cost per acquisition, and revenue attributed to specific channels or campaigns.
The distinction between reporting and analytics matters. Reporting tells you what happened: 500 visitors came to your website this week. Analytics tells you why, what it means, and what to do about it: those 500 visitors came from organic search, 60% of them landed on your services page, 8% converted to an enquiry, and the average session time was 3 minutes — which suggests intent rather than casual browsing. That is the difference between data and insight.
For SMEs without an in-house data team, the gap between reporting and genuine analytics is where most of the value gets lost.
The Four Types of Marketing Analytics
Understanding the four types of marketing analytics clarifies what each tool or report actually tells you and which decisions it can support.
Descriptive Analytics: What Happened?
Descriptive analytics covers historical data. It answers questions like: how many sessions did our website receive last month? Which pages were most visited? Where did traffic come from? Google Analytics 4 (GA4), social media dashboards, and email open rate reports all produce descriptive data. This is where most SMEs operate, and it is a reasonable starting point — but it is not enough on its own.
Diagnostic Analytics: Why Did It Happen?
Diagnostic analytics goes one level deeper, connecting outcomes to causes. If website traffic dropped by 30% in March, diagnostic analytics can help identify whether it was due to a Google algorithm update, a seasonal pattern, a technical issue on the site, or a reduction in ad spend. Tools like GA4’s comparison reports, Search Console query data, and heatmapping software (Hotjar, for example) support diagnostic analysis.
Predictive Analytics: What Is Likely to Happen Next?
Predictive analytics uses historical data patterns to forecast future behaviour. Which customer segments are most likely to convert? At what point in the year does enquiry volume typically dip? Which channels consistently produce the highest-value leads? Predictive analysis has historically required data science expertise, but AI-assisted tools are making it more accessible. Platforms like HubSpot’s CRM layer and GA4’s predictive metrics now surface these patterns for non-technical users.
Prescriptive Analytics: What Should We Do?
Prescriptive analytics uses data to recommend specific actions. It is the most advanced type and the least commonly used at the SME level. It typically requires integrating data from multiple sources — CRM, ad platforms, web analytics, and email — and applying modelling to identify the optimal next move. For most small businesses, this remains the territory of agencies or larger in-house teams with dedicated analytical resources.
Marketing Analytics Statistics Worth Knowing
Before building any measurement framework, it helps to understand the broader landscape. A selection of documented figures from published industry sources:
- GA4 is now the default analytics platform for websites globally, following the sunset of Universal Analytics in 2024.
- According to Statista, global spending on marketing analytics software was projected to exceed $4.6 billion in 2023, with consistent year-on-year growth.
- Research published by McKinsey found that data-driven organisations are significantly more likely to report above-average profitability than peers who rely solely on intuition.
- The IAB UK has consistently reported that data quality — not data volume — is the primary barrier to effective digital marketing measurement.
- According to Google’s own research, multi-touch attribution models outperform last-click attribution in predicting actual revenue outcomes across most channel mixes.
These figures are useful context. They are not, however, a substitute for your own data. The marketing analytics statistics that matter most for a Belfast-based recruitment firm differ substantially from those relevant to a Dublin e-commerce business. The goal is to build a measurement framework around your own numbers, not industry averages.
Key Metrics: What SMEs Should Actually Be Tracking
Vanity metrics are metrics that look good but do not connect to business outcomes. Impressions, follower counts, and raw traffic numbers fall into this category unless they are tied to something downstream. The metrics below are worth tracking because they connect marketing spend to business performance.
Customer Acquisition Cost (CAC)
CAC is the total cost of acquiring one new customer, calculated by dividing total marketing spend in a given period by the number of new customers won in that same period. It is one of the most useful numbers in any marketing review because it allows direct comparison across channels: if paid search generates a customer for £85 and organic SEO generates one for £40, that shapes where the next £10,000 goes.
Conversion Rate
Conversion rate measures the percentage of visitors, leads, or prospects who complete a desired action. On a website, that might be submitting an enquiry form, booking a call, or making a purchase. Conversion rate can be calculated at any stage of the funnel. A 2% website conversion rate might be acceptable for one business and a significant problem for another, depending on traffic volume and average order value.
Customer Lifetime Value (CLV)
CLV is the total revenue a business can reasonably expect from a single customer relationship. For businesses with recurring revenue (web hosting, SEO retainers, SaaS subscriptions), CLV fundamentally changes how much it makes sense to spend on acquisition. A customer worth £6,000 over three years justifies a higher acquisition cost than one worth £200 in a single transaction.
Attribution
Attribution is the process of assigning credit for a conversion to the marketing touchpoints that contributed to it. Last-click attribution — the default in many platforms — gives all credit to the final touchpoint before a conversion. This systematically undervalues top-of-funnel activity like SEO, content, and brand awareness campaigns. Data-driven attribution models, available in GA4 for accounts with sufficient conversion volume, distribute credit across the full customer journey and typically give a more accurate picture of channel performance.
Return on Ad Spend (ROAS)
ROAS measures revenue generated per pound spent on advertising. A ROAS of 4:1 means every £1 in ad spend returns £4 in revenue. It is a useful metric for paid channels, but should be read alongside profit margin; a 4:1 ROAS on a 20% margin product tells a very different story to a 4:1 ROAS on a 60% margin service.
| Metric | What It Measures | Best Used For |
|---|---|---|
| CAC | Cost to acquire one customer | Comparing channel efficiency |
| Conversion Rate | % of visitors completing an action | Optimising landing pages and funnels |
| CLV | Total revenue per customer relationship | Justifying acquisition spend |
| Attribution | Credit allocation across touchpoints | Understanding the full customer journey |
| ROAS | Revenue per £1 of ad spend | Evaluating paid campaigns |
Building Your Analytics Tech Stack
The right set of tools depends on your channels, budget, and technical capability. For most SMEs in the UK and Ireland, a functional analytics stack looks something like this:
Web analytics: GA4 is the starting point for nearly every business. It is free, widely supported, and integrates with Google Search Console, Google Ads, and a growing number of CRM platforms. The interface is more complex than its predecessor, and the migration from Universal Analytics caught many businesses off-guard — a significant number are still working with incomplete historical data or misconfigured tracking as a result.
Search performance: Google Search Console provides query-level data that GA4 does not: which search terms are generating impressions and clicks, which pages are ranking, and where there are technical crawl issues. For businesses investing in SEO, it is indispensable. ProfileTree’s guide to social media analytics tools covers the equivalent landscape for social channels.
Social: Platform-native analytics (Meta Business Suite, LinkedIn Analytics, TikTok Analytics) provide channel-specific performance metrics. Their attribution data should be treated with caution — each platform tends to over-claim credit for conversions. Cross-referencing with GA4 and your CRM gives a clearer picture.
CRM: For businesses with longer sales cycles or relationship-based services, a CRM is where marketing data connects to actual revenue. Without it, there is a gap between “number of leads generated” and “revenue those leads produced”, which makes it impossible to calculate true CAC or CLV.
Privacy-compliant alternatives: For businesses that need stronger data residency controls or want to move away from Google’s ecosystem, Matomo (self-hosted) and Piwik PRO (UK/EU data residency options) are established alternatives. Fathom Analytics is a simpler, GDPR-compliant option for businesses that need basic web analytics without the complexity of GA4.
| Tool | Cost | GDPR Default | Data Residency | Best For |
|---|---|---|---|---|
| GA4 | Free | Requires configuration | US (with EU option) | Most SMEs |
| Google Search Console | Free | Yes | Google servers | SEO tracking |
| Matomo (self-hosted) | Free/paid | Yes | Your servers | Privacy-first |
| Piwik PRO | Freemium | Yes | EU/UK available | Regulated industries |
| Fathom Analytics | Paid | Yes | EU | Simplicity |
Marketing Analytics and UK GDPR: What SMEs Need to Know
This is the section most marketing analytics guides skip, and it is where UK businesses run into practical and legal problems. UK GDPR (retained EU law post-Brexit, enforced by the ICO) and PECR (Privacy and Electronic Communications Regulations) both affect how you can collect, store, and use marketing data.
The core issue is consent. Under PECR, placing cookies — including analytics cookies — on a UK user’s device requires informed consent before the cookie fires, not after. This means analytics data collected before a user accepts your cookie banner is, strictly speaking, non-compliant. For many businesses with poorly configured consent management platforms, a meaningful portion of their analytics data is collected without valid consent.
In practice, the ICO’s enforcement focus has been on larger organisations and more egregious breaches, but the legal position is clear. The practical steps for SMEs:
Configure GA4 with Consent Mode v2, which adjusts data collection behaviour based on user consent status. Google requires this for businesses that use both Google Ads and Google Analytics.
Enable IP anonymisation in GA4. This is now on by default in GA4, but worth confirming in your configuration, particularly if you migrated from a legacy Universal Analytics setup.
Set your data retention period explicitly. GA4 defaults to two months; most businesses want to extend this to 14 months, which is the maximum available. Do this in Admin > Data Settings > Data Retention.
Review your cookie banner against ICO guidance. Pre-ticked boxes, dark patterns that make rejection harder than acceptance, and banners that fire analytics before consent is recorded are all non-compliant.
If your business collects data from users in the Republic of Ireland, you are dealing with the DPC (Data Protection Commission) rather than the ICO. The substantive rules are the same (EU GDPR), but the regulator and enforcement approach differ.
ProfileTree’s work with SMEs across Northern Ireland, Ireland, and the UK means data compliance requirements — including the cross-border considerations for NI businesses serving both UK and EU markets — are a practical reality, not a theoretical concern. The ethics and legalities of digital marketing cover the broader regulatory landscape for businesses operating in this context.
How to Use Marketing Analytics to Improve ROI: A Practical Framework
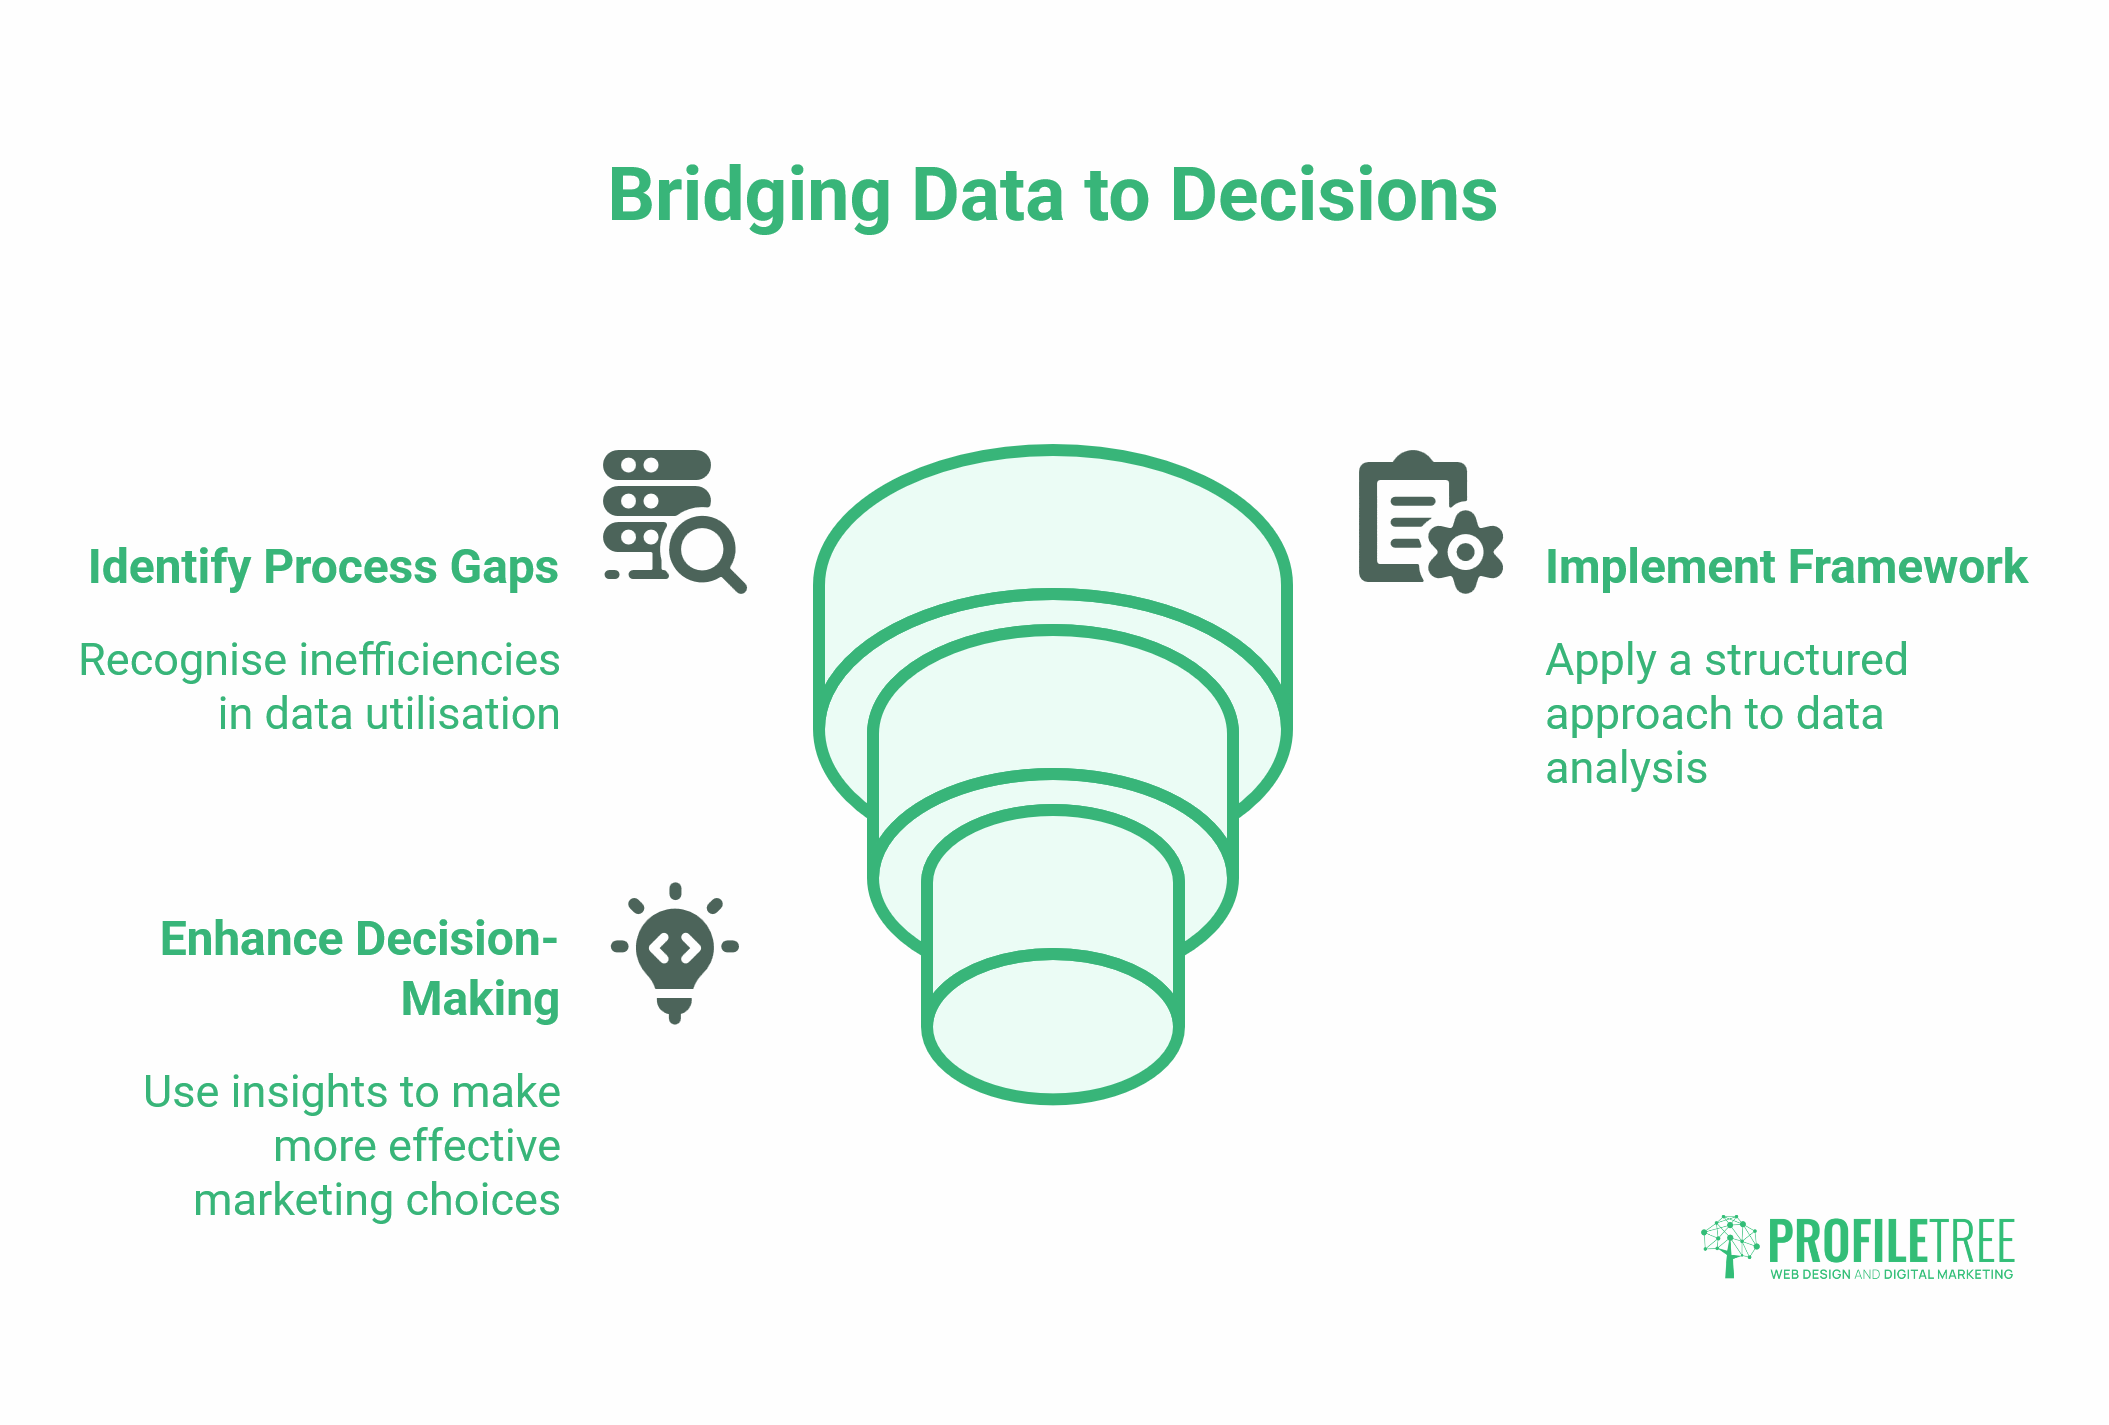
The gap between having analytics data and making better marketing decisions is, for most SMEs, a process problem rather than a technology problem. The following framework is a starting point.
Step 1: Define your North Star metric
Before you look at any data, decide what success looks like. For a service business, it might be qualified enquiries. For an e-commerce operation, it is likely revenue or ROAS. For a content-led business, it might be email list growth or organic traffic to high-intent pages. One primary, clearly defined metric prevents the common problem of reporting on everything and acting on nothing.
Step 2: Map your funnel
Identify the stages a prospect passes through from first contact to becoming a customer. For most SMEs, this is: awareness (they find you) > engagement (they interact with your content or website) > consideration (they explore your services) > conversion (they enquire or buy) > retention (they come back or refer). Every metric should connect to one of these stages.
Step 3: Set up tracking that connects the dots
Most SMEs have tracking that measures individual channels in isolation. The goal is to connect them: a prospect who clicks an organic search result, reads two blog posts, downloads nothing, then returns a week later via a direct visit and submits an enquiry — how does that journey appear in your data? GA4’s user-journey reports and multi-channel attribution tools make this visible, but only if tracking is set up correctly from the start.
Step 4: Review monthly, act quarterly
Monthly reviews should cover what happened, why (diagnostic), and whether it matches the trend line. Quarterly reviews should inform budget and channel decisions: shift spend toward what is working, reduce or restructure what is not. The mistake most businesses make is reviewing data monthly but only making decisions annually — typically at budget time, when the information is months old.
Step 5: Build reporting that connects to business outcomes
A Looker Studio dashboard showing sessions, bounce rate, and social impressions is not a marketing analytics report. A report that shows CAC by channel, conversion rate by landing page, and revenue attributed to organic, paid, and email. The former is descriptive data. The latter is the basis for decision-making.
For businesses that do not have the internal resource to build and interpret this, working with an external digital marketing strategy partner is often more cost-effective than hiring for the capability. ProfileTree’s digital marketing strategy works with SMEs across Northern Ireland and Ireland regularly starts with exactly this: building the measurement foundation before advising on where to spend.
The Role of AI in Marketing Analytics
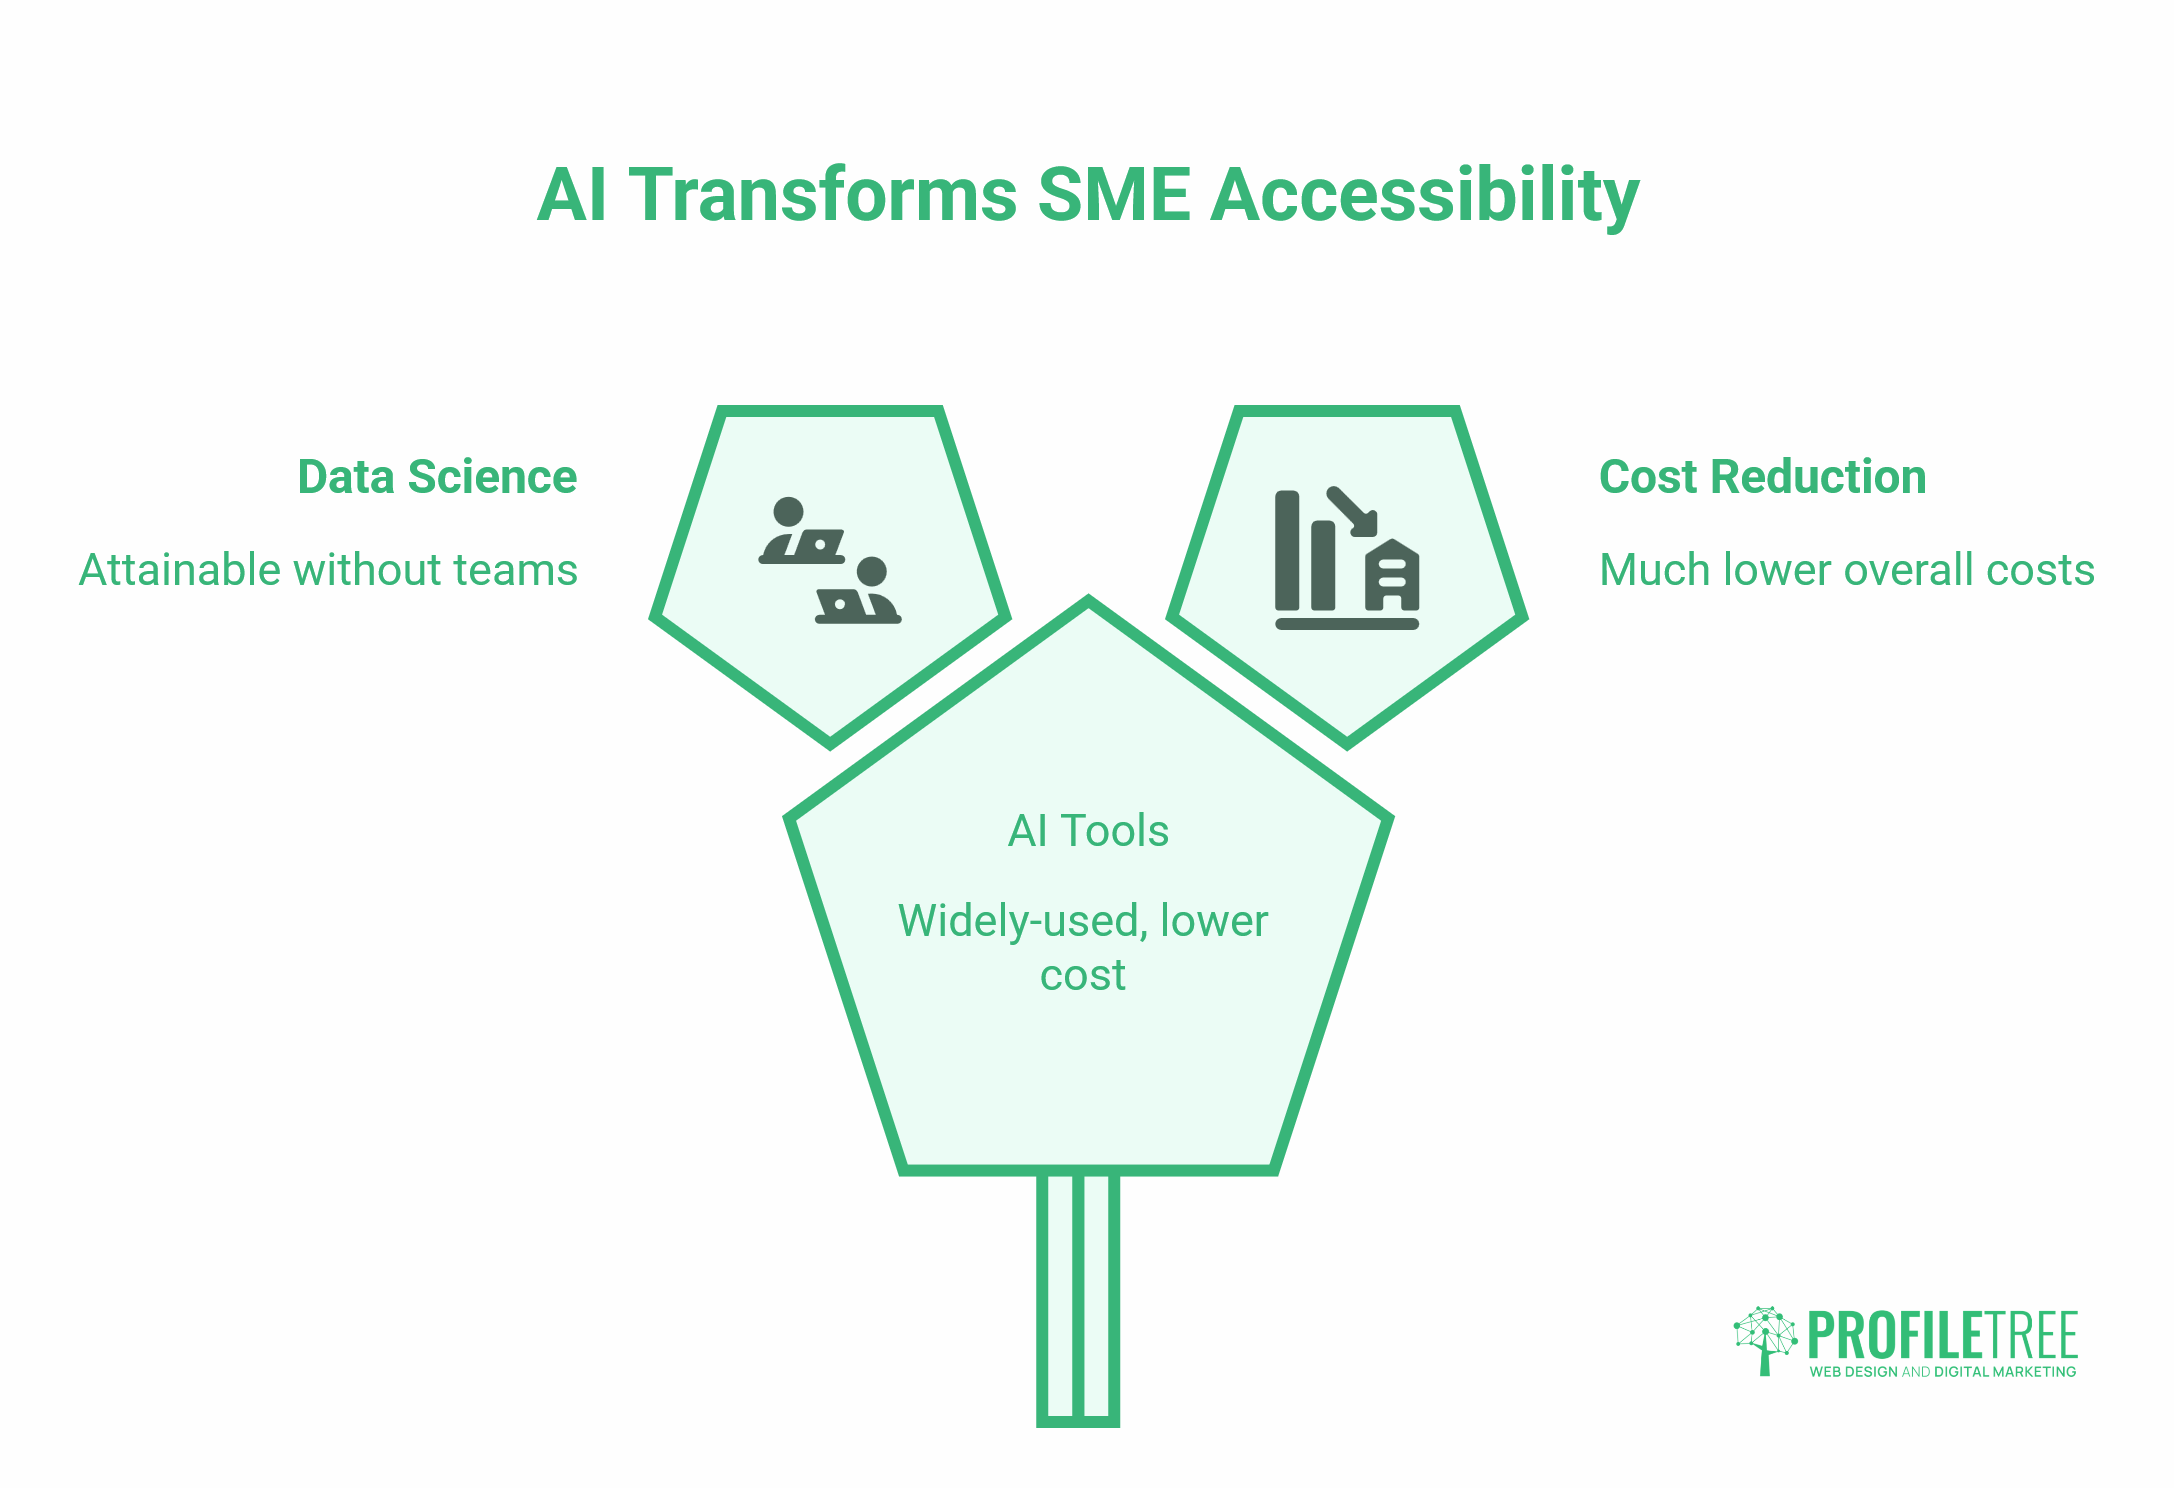
AI is changing what is accessible to SMEs. Capabilities that required data science teams five years ago are now available through mainstream tools at significantly lower cost.
GA4’s predictive metrics (purchase probability, churn probability) use machine learning trained on your own behavioural data. They require a minimum threshold of conversion events to activate, but once they do, they surface which user segments are most likely to convert — information that previously required custom modelling.
Conversational AI tools can now interpret analytics reports for non-technical users. Rather than exporting a GA4 report and trying to make sense of it, a business owner can describe what they are seeing and ask what it means — or share a dataset and ask for the key patterns. This does not replace analytical expertise, but it closes the gap for businesses without it.
AI-powered attribution tools are also becoming more accessible to SMEs. These apply machine learning to conversion path data to distribute credit more accurately than rule-based models. For businesses running multiple channels simultaneously, the difference between last-click and data-driven attribution can be significant enough to shift where the next campaign budget is allocated.
ProfileTree’s AI implementation work covers exactly this territory: helping SMEs understand which AI tools are genuinely useful at their scale, configure them correctly, and integrate them into existing workflows rather than adding complexity for its own sake. For businesses earlier in that journey, the resources at SMEs successfully implementing AI solutions offer practical context.
The Challenges of Data-Driven Marketing
Understanding the obstacles is as useful as understanding the approach.
Data quality: Analytics data is only as reliable as the tracking that produces it. Misconfigured GA4 setups, missing UTM parameters in campaign URLs, and broken conversion tracking all produce data that appears complete but isn’t. The most common issue ProfileTree sees when auditing client analytics is a GA4 account showing high traffic and near-zero conversions — not because conversions aren’t happening, but because they weren’t tracked correctly.
Data silos: When ad spend data sits in Google Ads, customer data sits in a CRM, and web behaviour data sits in GA4, and none of these talk to each other, attribution is impossible. Connecting these systems — through GA4’s data import features, CRM integrations, or tools like Zapier — is the technical work that enables meaningful analytics.
Interpreting data correctly: A high bounce rate does not always mean poor content; for single-page sessions in which the user found what they needed immediately, it may indicate success. Low time on page isn’t always bad; on a contact page, it probably means the user found the phone number quickly. Data needs context to be useful, and context requires understanding both the business and the numbers.
Attribution complexity: No attribution model is perfect. Multi-touch models are more accurate than last-click, but they still cannot capture offline touchpoints, word-of-mouth referrals, or the cumulative effect of brand familiarity built over years of content output. Being honest about what your data can and cannot tell you is part of using it well.
For a broader view of how analytics fits within digital marketing decision-making, the marketing strategy guide for attracting investors addresses how data-driven marketing supports business growth narratives.
Conclusion
Marketing analytics is not a tool for large businesses with data teams. It is a practical discipline that any SME can apply — starting with clear goals, the right tracking setup, and a habit of reviewing data against business outcomes rather than platform metrics.
The businesses that get the most from analytics are rarely the ones with the most sophisticated tech stack. They are the ones who know what they are trying to measure, why it matters, and what they will do differently based on what they find. That discipline — connecting data to decisions — is what separates marketing spend that compounds over time from spend that just accumulates.
If your current analytics setup tells you how many people visited your website but not why they came, what they did, or whether any of them became customers, that is the gap worth closing first.
FAQs
What is marketing analytics?
Marketing analytics is the practice of measuring and analysing marketing performance to identify what is working, what is not, and where to invest next. It connects activity across channels — web, paid, social, email — to business outcomes like leads, sales, and revenue.
What are the four types of marketing analytics?
Descriptive (what happened), diagnostic (why it happened), predictive (what is likely to happen next), and prescriptive (what action to take). Most SMEs rely primarily on descriptive analytics and would benefit from building diagnostic capabilities alongside it.
How does GDPR affect marketing analytics in the UK?
UK GDPR and PECR require informed consent before analytics cookies fire. This affects your consent management platform, your GA4 Consent Mode configuration, and the legal validity of your data. Businesses operating across Northern Ireland and the Republic of Ireland must also comply with the EU GDPR under the DPC.
What is the difference between marketing analytics and web analytics?
Web analytics is a subset. It covers what happens on your website — sessions, pages, and on-site behaviour. Marketing analytics is broader, pulling in data from all channels and connecting it to revenue. Web analytics tells you about the website. Marketing analytics tells you about the programme.