
YouTube Analytics for SMEs: Turning Viewer Data Into Growth
Table of Contents
Most UK and Irish businesses that invest in video never look beyond the view count. They upload, watch the number tick up, and call it a job done. The problem is that views alone tell you almost nothing about whether your content is working for your business.
YouTube Analytics gives SME marketing teams a direct window into how real viewers interact with video: where they come from, when they stop watching, which content converts casual browsers into returning contacts, and how each video contributes to channel-level growth. For businesses producing video as part of a wider digital strategy, that data is commercially useful if you know what to look for.
This guide covers the analytics metrics that matter most for SME video marketers, how to read audience behaviour beyond surface-level numbers, and how to use that intelligence to produce sharper, more effective content.
Beyond the Dashboard: What YouTube’s Advanced Mode Actually Shows
YouTube Studio’s standard dashboard gives you a high-level summary: views, watch time, subscribers gained or lost, and estimated revenue if your channel is monetised. It is useful for a quick health check, but it does not give you the granular picture that informs strategic decisions. Advanced Mode does.
Accessed through the Analytics tab in YouTube Studio, Advanced Mode lets you filter, segment, and compare data across custom date ranges and dimensions. Rather than viewing a channel-wide average, you can isolate the performance of a single video, compare two time periods side by side, or break down watch time by traffic source. For SME teams managing a content programme rather than a hobby channel, this level of control changes how you interpret results.
The starting point is understanding which metrics deserve your attention and which are largely noise.
Impressions and Click-Through Rate
An impression is recorded every time a YouTube thumbnail is shown to a logged-in user. Click-through rate (CTR) is the percentage of those impressions that result in a click. Together, they tell you how compelling your thumbnail and title combination is in the context where it appears.
A low CTR (below 2% in most niches) usually means the thumbnail or title is not sufficiently differentiated from competing content. It does not necessarily mean the video is weak. A high impression count with a low CTR is a clear brief for creative testing: experiment with the thumbnail first, then the title framing.
Average View Duration and Average Percentage Viewed
Average View Duration (AVD) is the mean number of minutes viewers watch per session. Average Percentage Viewed (APV) expresses the same figure as a proportion of the video’s total length. APV is the more useful of the two for comparison, because it controls for video length.
YouTube’s algorithm uses both as quality signals. A video where 60% of viewers watch at least half the content is treated as more valuable than one where viewers bounce after 30 seconds. For SMEs, consistently improving APV is often more achievable than chasing impression volume.
Revenue Per Mille vs. Cost Per Mille
These two figures are frequently confused. CPM (Cost Per Mille) is what advertisers pay YouTube per 1,000 ad impressions. RPM (Revenue Per Mille) is what the creator actually receives per 1,000 video views, after YouTube’s share is deducted. RPM is always lower than CPM.
For UK and Irish channels, YouTube reports revenue in USD by default. If you are reporting to a client or board in GBP or EUR, you need to apply the prevailing exchange rate manually. YouTube does not adjust for currency fluctuations in its analytics exports, which makes financial reporting for UK brands slightly more involved than the dashboard implies.
The Metrics SME Marketers Should Track Weekly
Not every metric in YouTube Analytics deserves the same attention. The following are the four most commercially relevant for SME teams producing video as part of a wider digital strategy, and the questions each one answers.
Returning Viewer Rate vs. New Viewer Rate
YouTube separates your audience into two groups: new viewers arriving for the first time and returning viewers who have watched your content before. The ratio between these two groups tells you whether your channel is building a genuine audience or simply attracting one-off traffic.
A channel where returning viewers account for 40% or more of watch time has a healthy content relationship with its audience. A channel where nearly all watch time comes from new viewers is either a very early stage or is failing to give viewers a reason to come back. For SMEs, the returning viewer rate is a direct indicator of content quality and subject consistency.
Audience Retention Curves
The retention curve is a graph showing, second by second, what percentage of viewers are still watching. Most videos lose 20 to 30% of viewers in the first 30 seconds. After that, a strong video holds a relatively flat line. Steep drops at a specific point tell you exactly where the content fails: a slow section, a confusing transition, or a topic shift the audience did not expect.
Advanced Mode adds a layer of context through “Relative Audience Retention,” which compares your video’s retention against all YouTube videos of a similar length. This removes the length variable and gives you a more honest read on whether your content is holding attention relative to what viewers typically experience. If your retention is consistently below the benchmark, the issue is the content itself, not the audience.
Traffic Source Breakdown
YouTube’s traffic source data shows where your viewers are finding each video: YouTube search, suggested videos, external websites, direct links, playlists, or other sources. For SMEs, this breakdown is strategically important because different sources represent different levels of intent.
Viewers arriving via YouTube search are looking for something specific, which means they are more likely to engage with the content and convert. Viewers arriving via suggested videos are browsing, which means they require a stronger opening to hold their attention. Understanding the source mix for each video helps you optimise both the content and the distribution strategy: whether that means improving video SEO or focusing on producing content that gets recommended alongside high-traffic videos in your niche.
For broader benchmarking, analytics tools can complement YouTube’s native data by tracking referral behaviour across platforms in one place.
Card and End Screen Click Rates
Cards are interactive elements that appear during a video; end screens appear in the final 20 seconds and typically prompt viewers to watch another video, subscribe, or visit an external link. Both have their own click-through rate data in Advanced Mode.
Low card click rates usually indicate the card appears at the wrong time (when viewers are already disengaged) or that the destination is not compelling enough to interrupt viewing. End-screen performance is closely tied to whether viewers reach that point in the video; if retention is low, most viewers leave before the end screen appears. Fixing retention problems typically improves end-screen performance as a downstream effect.
A clear connection exists between video engagement and commercial outcomes: businesses that improve viewer retention and click-through rates consistently find that video drives sales at higher rates than static content formats.
Reading Viewer Behaviour: Demographics and Devices
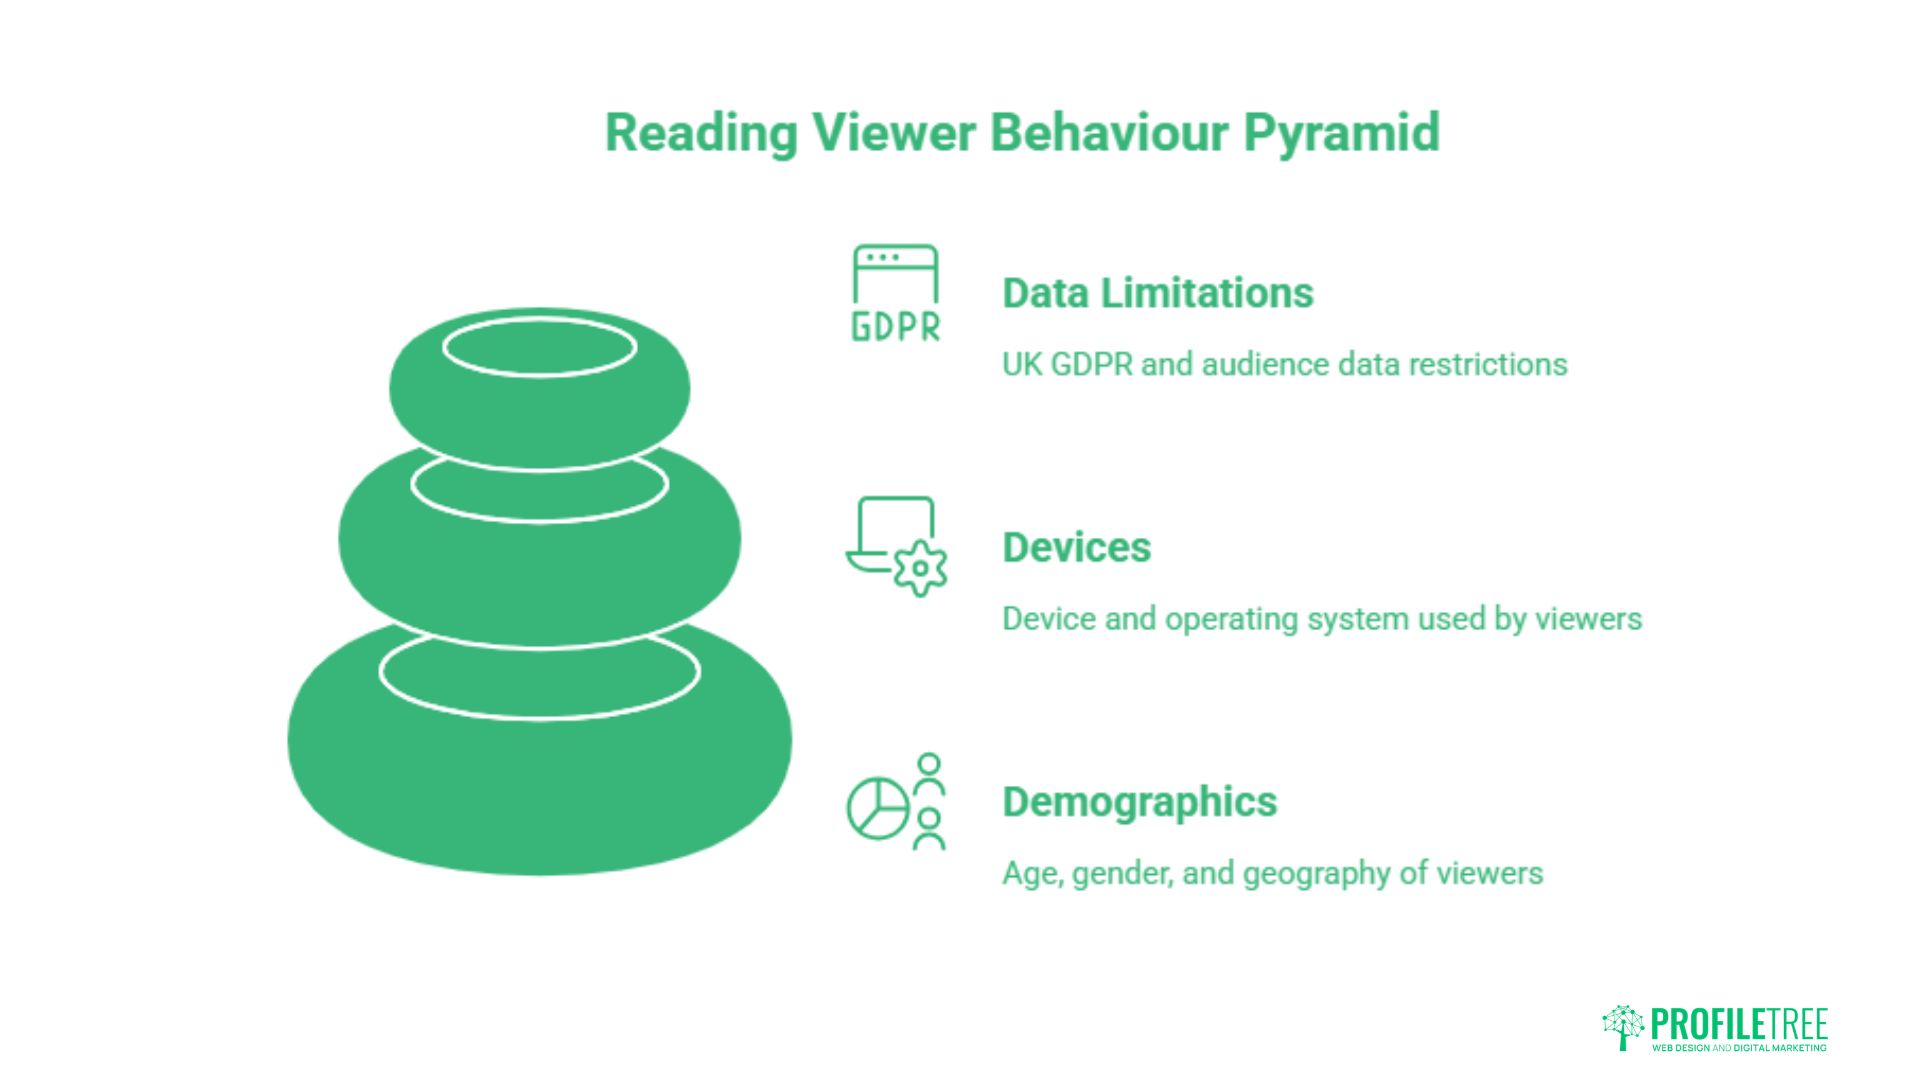
Beyond the performance metrics, YouTube Analytics provides detailed data on who is watching and how they are watching. For SMEs operating in specific markets, this demographic and device data is often more actionable than channel-level performance figures.
Age, Gender, and Geography
YouTube’s demographic data is sourced from logged-in users and provides breakdowns by age band, gender, and country. For UK and Irish businesses, geography is particularly relevant because audience composition can shift significantly between content types.
A Belfast-based professional services firm, for example, may find that a video on sector-specific regulation draws 80% of its views from Northern Ireland and the Republic, while a broader “how to” piece attracts a wider UK-wide audience. These differences should directly inform production decisions: the more localised the content, the more tightly you can tailor language, examples, and regulatory references to your actual viewers.
Device and Operating System Data
YouTube Analytics breaks down watch time by device: mobile phone, desktop, tablet, smart TV, and game console. This matters for production decisions. Mobile viewers experience your content on a small screen, often without headphones, in environments where audio quality is inconsistently received. Desktop viewers are more likely to be in a work context, paying closer attention.
If your channel skews heavily toward mobile (which most SME channels do), it is worth reviewing whether your on-screen text is legible at phone scale, whether your audio levels are consistent enough to be followed without earbuds, and whether your video length matches the browsing habits of mobile users, who tend to have shorter session times than desktop viewers.
UK GDPR and Audience Data Limitations
YouTube applies data privacy thresholds to demographic reporting. When a video has fewer than a certain number of views from a given audience segment, that segment’s data is suppressed to protect individual users. For SMEs with smaller channels, this means demographic data is often incomplete for individual videos and is more reliable when viewed at the channel level over a longer period.
UK GDPR, administered by the Information Commissioner’s Office (ICO), also governs how brands can use audience data collected through their own YouTube integrations. If your channel is linked to a brand account that passes viewer data to a CRM or third-party analytics platform, check that your privacy policy reflects this data flow. YouTube’s own data collection practices are covered by Google’s privacy framework, but any secondary processing by your business requires its own legal basis under UK GDPR. For further guidance on YouTube’s content policies and how they interact with platform data, the YouTube Help Centre is the authoritative source.
Using Analytics to Plan and Improve Content
Viewing data is only commercially useful if it informs what you produce next. Many SME teams collect analytics conscientiously but then make content decisions based on instinct rather than what the data actually shows. The gap between reading analytics and acting on them is where most channel growth stalls.
Content Grouping and Anchor Content
Not all videos on a channel perform equally, and not all should. Within Advanced Mode, you can compare sets of videos by filtering on specific time periods, topics, or content types. This comparison often reveals that a small subset of videos drives a disproportionate share of total watch time and subscriber growth. These are anchor videos: they consistently attract new viewers, hold retention well, and drive related content views through suggestions and playlists.
Identifying anchor content lets you make better production decisions. Rather than producing a steady stream of content in the hope that some of it connects, you can study what makes your anchor videos work and brief future content to replicate those structural characteristics. Common anchor video traits include a specific, answerable question in the title, a strong first 30 seconds that establishes what the viewer will gain, and a length matched to the topic rather than to an arbitrary target.
Using Comparison Analysis for Strategic Planning
Advanced Mode’s “Compare to” function lets you set two date ranges side by side. This is the most practical tool for quarterly planning. By comparing the last 90 days against the same period in the previous year, you can see whether watch time, subscriber growth, and impression volume are trending in the right direction, and whether seasonal patterns in your audience are repeating.
For SMEs working with external agencies or reporting to a board, this comparison view also makes it straightforward to demonstrate progress in absolute terms rather than through channel-level averages that can mask performance shifts.
Helping the team that creates the content to understand and act on this data is often the missing step. Digital skills training for in-house marketing teams covers YouTube Analytics interpretation as part of broader social media performance programmes.
Exporting Data and AI-Assisted Interpretation
YouTube Advanced Mode allows you to export your data as a CSV file. This is worth doing regularly, particularly if you want to build reporting dashboards in Google Looker Studio or analyse trends over periods longer than YouTube’s native 18-month view window.
A CSV export from YouTube’s Advanced Mode contains per-video data on views, impressions, CTR, watch time, estimated revenue, and traffic sources. Loaded into a spreadsheet or Looker Studio, this data can be visualised by content type, topic cluster, or publication date, giving you a content performance view that YouTube’s own interface does not easily support.
One emerging approach for teams with limited data analysis resources is to pass CSV exports directly to an AI assistant (such as Gemini or ChatGPT) with a plain-language prompt: “Here is my last 90 days of YouTube data. Which videos have the best average percentage viewed? What patterns do you see in the traffic sources for my top five videos?” This produces useful pattern summaries without requiring any technical data skills, and works particularly well for identifying outliers that manual review might miss.
“Most SMEs we work with treat YouTube like a broadcast channel: they upload and hope,” says Ciaran Connolly, founder of Belfast digital agency ProfileTree. “The businesses that get real results are the ones that check retention curves weekly and use that data to brief their next video.”
Analytics for UK and Irish SME Video Marketers: A Practical Framework
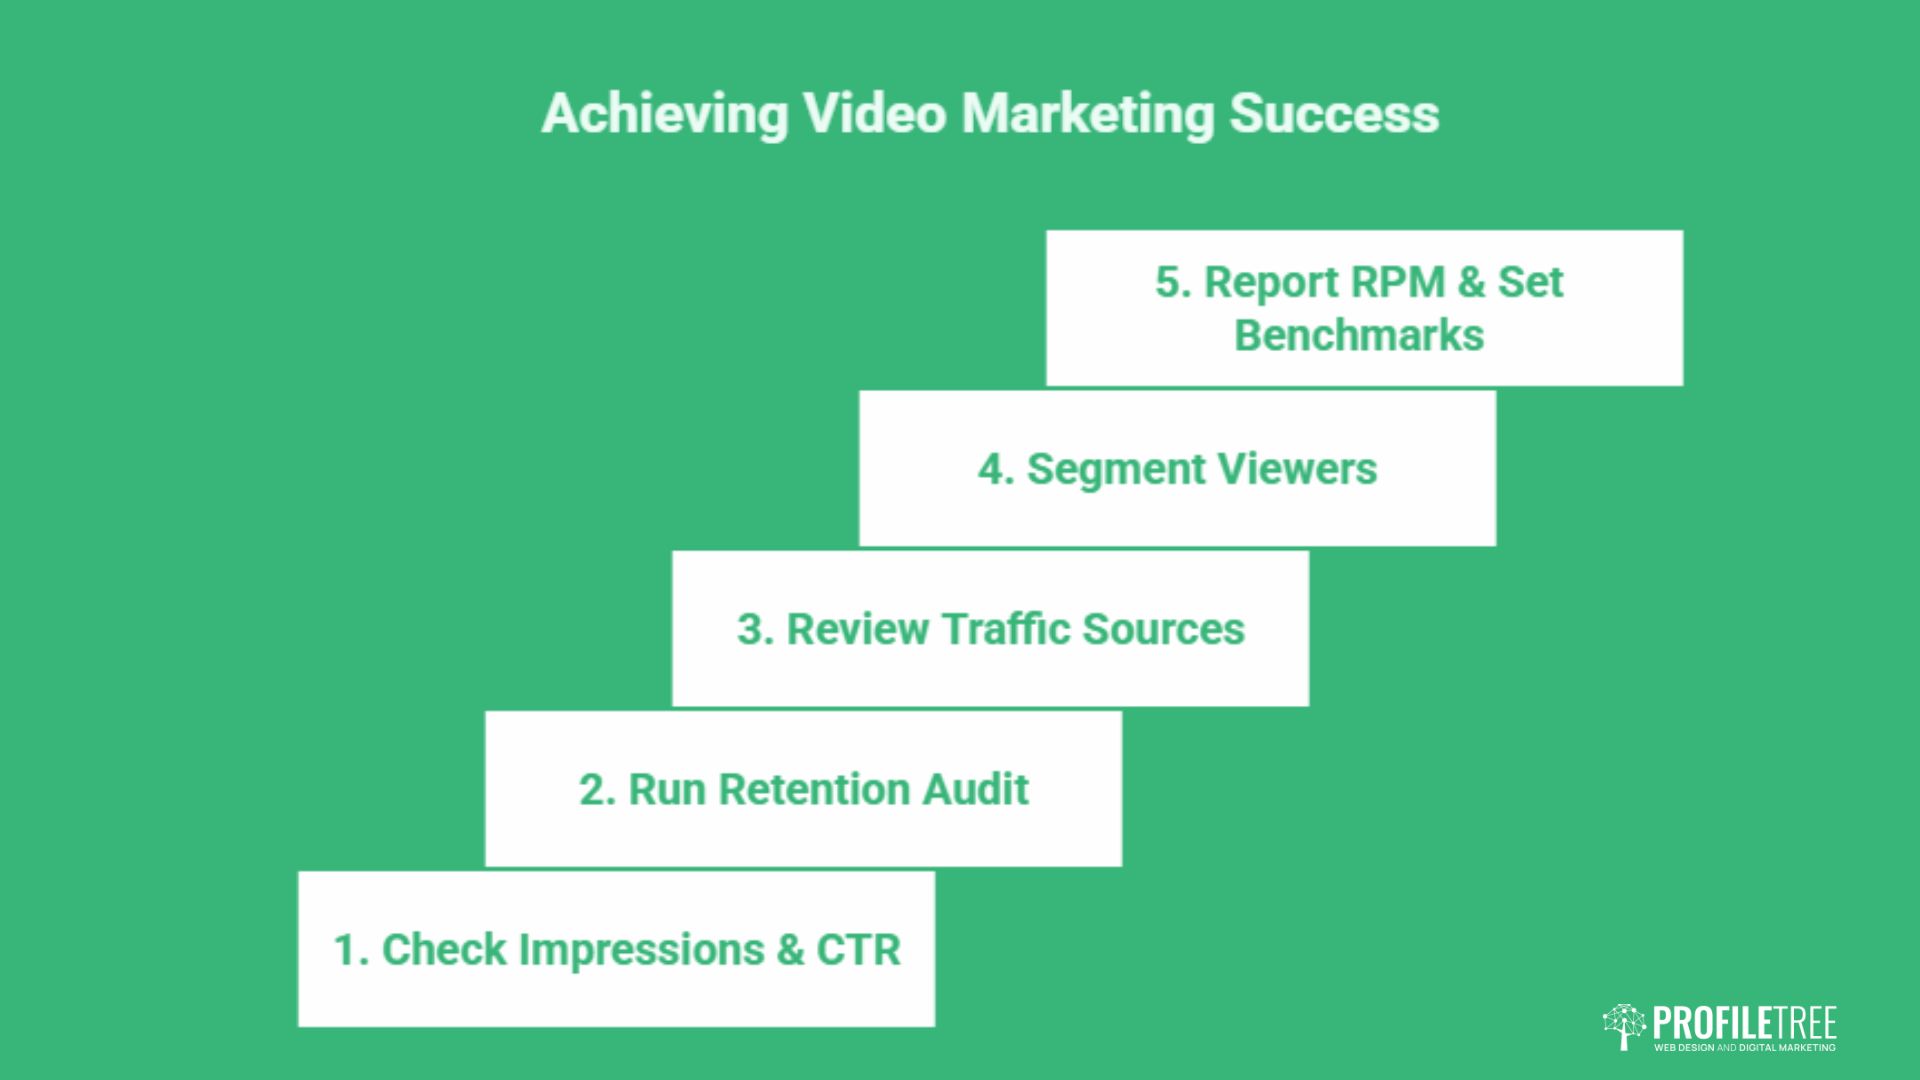
Pulling together everything above into a repeatable process is more valuable than any single analytical insight. The following five-step framework is designed for SME marketing teams to review video performance monthly.
Step One: Check Impressions and CTR by Video
Start with the CTR report filtered to the last 28 days. Identify any video with more than 1,000 impressions and a CTR below 2%. These are your first optimisation targets. Test a new thumbnail first (keeping the title constant), wait two weeks, and compare CTR before and after. Document the change and the result so you build a working knowledge of what thumbnail styles perform with your specific audience.
Step Two: Run the Retention Audit
Open the Audience Retention report for your three most-viewed videos from the past 90 days. Note where the first significant drop in retention occurs. If the drop happens before the 30-second mark, the opening of the video does not quickly enough establish why the viewer should stay. If the drop occurs at a predictable point mid-video, review the script and edit at that section. Compare your retention curves against the “Relative Audience Retention” benchmark to understand whether the drop is above or below average for videos of that length.
Step Three: Review Traffic Source Mix
In Advanced Mode, filter to “Traffic Source: External” and identify which websites are sending viewers to your videos. If your own website is a significant source, this is a strong signal that embedding videos in relevant blog posts and service pages is working. If external referral traffic is negligible, embedding videos more prominently across your site and in email campaigns is a practical growth lever that does not require any change to production output.
Step Four: Segment by New vs. Returning Viewers
Compare your returning viewer rate across your last five videos. A declining returning viewer rate may indicate that your most recent content is attracting a different audience to your established channel base, or that returning viewers are not finding the content as relevant as earlier output. Neither is necessarily a problem, but both require a deliberate strategic response rather than an accidental drift in content direction.
If building a returning audience is a priority, playlists are an underused tool. Organising videos by topic and ending each video with a playlist prompt (rather than a generic subscribe request) keeps returning viewers in a structured content journey and improves the channel’s overall watch time metrics. Businesses looking to grow their subscribers sustainably will find a retention strategy more effective than growth hacks over the medium term.
Step Five: Report on RPM and Set Quarterly Benchmarks
For channels that are monetised, track RPM alongside view volume. A rising RPM alongside flat or growing views indicates that the audience quality is improving, which often means content is attracting more commercially valuable viewer segments. For UK and Irish channels, remember to convert USD revenue figures to GBP or EUR using the rate applicable to the reporting period, not the rate at the time of the Google payout.
Set a quarterly baseline for each of the five metrics above: CTR, average percentage viewed, returning viewer rate, traffic source split, and RPM. Review progress against the baseline at the end of each quarter. This simple structure turns analytics from a reactive audit into a proactive planning tool that gives any external agency or internal stakeholder a clear, consistent picture of channel performance over time.
For businesses building a broader digital strategy that integrates video with SEO, paid social, and content marketing, a digital marketing strategy from a specialist agency can help connect analytics insights across channels into a single performance view.
Northern Ireland and Irish businesses looking to explore what data-led video marketing looks like in practice may also find useful context in Northern Ireland digital audiences, because where your viewers are based directly affects how you should frame your content and what analytics segments deserve the most attention.
Conclusion
YouTube Analytics gives UK and Irish SMEs a detailed map of how their video content performs, but it’s only useful if you act on what it shows. The businesses that consistently improve on YouTube are not necessarily those with the largest production budgets; they are the ones that review their data regularly, test specific changes, and use the results to brief better content. Start with retention curves and CTR, build a quarterly benchmarking habit, and treat every analytics session as a brief for your next video rather than a report on your last one.
If your business is ready to build a video content programme backed by clear analytics and strategic direction, speak to ProfileTree about a video marketing plan designed around your growth goals.
FAQs
How do I access Advanced Mode in YouTube Analytics?
Open YouTube Studio, select Analytics from the left menu, and click “Advanced Mode” in the upper right of the analytics overview screen. Advanced Mode is available on desktop only; the YouTube Studio mobile app does not support it. You need a Google account with ownership or management access to the channel.
Why is my Advanced Mode toggle missing?
Advanced Mode is not available on all account types. If you manage a channel through a Brand Account and your personal Google account does not have channel manager or owner permissions, the Advanced Mode option may not appear. Check your channel permissions in YouTube Studio under Settings. Advanced Mode also does not appear in the YouTube Studio mobile app, so use a desktop browser.
Can I see YouTube analytics for a competitor’s channel?
YouTube does not provide public access to another channel’s internal analytics. What you can access publicly is limited to the subscriber count, view count on individual videos, and upload frequency visible on any channel page. Third-party tools such as VidIQ and Social Blade pull from YouTube’s public Data API and provide estimates of channel performance, but these are approximations rather than the actual figures a channel owner sees in Studio.
What is the most important metric in YouTube Advanced Analytics for SMEs?
For SMEs focused on building audience quality rather than raw scale, Average Percentage Viewed (APV) is the most meaningful single metric. It measures how much of your content viewers actually watch, which is a direct proxy for content quality and relevance to your audience. A high APV signals that the video is serving real viewer intent, and YouTube’s algorithm rewards it with greater recommendation frequency. View counts can be inflated by misleading thumbnails; APV cannot.
How do I export YouTube data for external reporting?
In Advanced Mode, click the download icon (arrow pointing downward) in the upper right of the data table. YouTube exports the current view as a CSV file, which can be opened in Excel, Google Sheets or imported into Looker Studio. The export reflects the filters and date ranges you set in Advanced Mode, so configure them before downloading. For Looker Studio integration, YouTube also has a native connector that allows direct data pulls without a manual CSV export step.