A website analysis is essential for any business or individual aiming to optimise their online presence. Your website serves as the digital front door to your brand, and understanding how it performs is crucial to ensuring a seamless user experience, strong SEO, and higher conversion rates. Whether you’re just starting or looking to fine-tune an established site, a detailed analysis can highlight areas for improvement and offer insights on how to keep your site performing at its best.
A good website analysis dives into key areas: site speed, user engagement, SEO performance, mobile compatibility, and overall design. Each factor contributes to your site’s overall effectiveness, influencing how visitors interact with it and how search engines rank it. By examining metrics like bounce rates, traffic sources, and user behaviour, you can uncover hidden issues and opportunities for optimisation. Using the right tools, such as Google Analytics, SEMrush, or Hotjar, helps make this process more manageable and actionable.
In this article, we’ll walk you through the steps of conducting a comprehensive website analysis covering technical and user-experience aspects. We’ll explore the metrics you should be tracking, the best tools for the job, and how to translate data into actionable improvements. Whether focused on improving SEO, enhancing usability, or driving more conversions, a website analysis is your roadmap to making informed, strategic decisions that lead to lasting success.
What Is a Website Analysis?
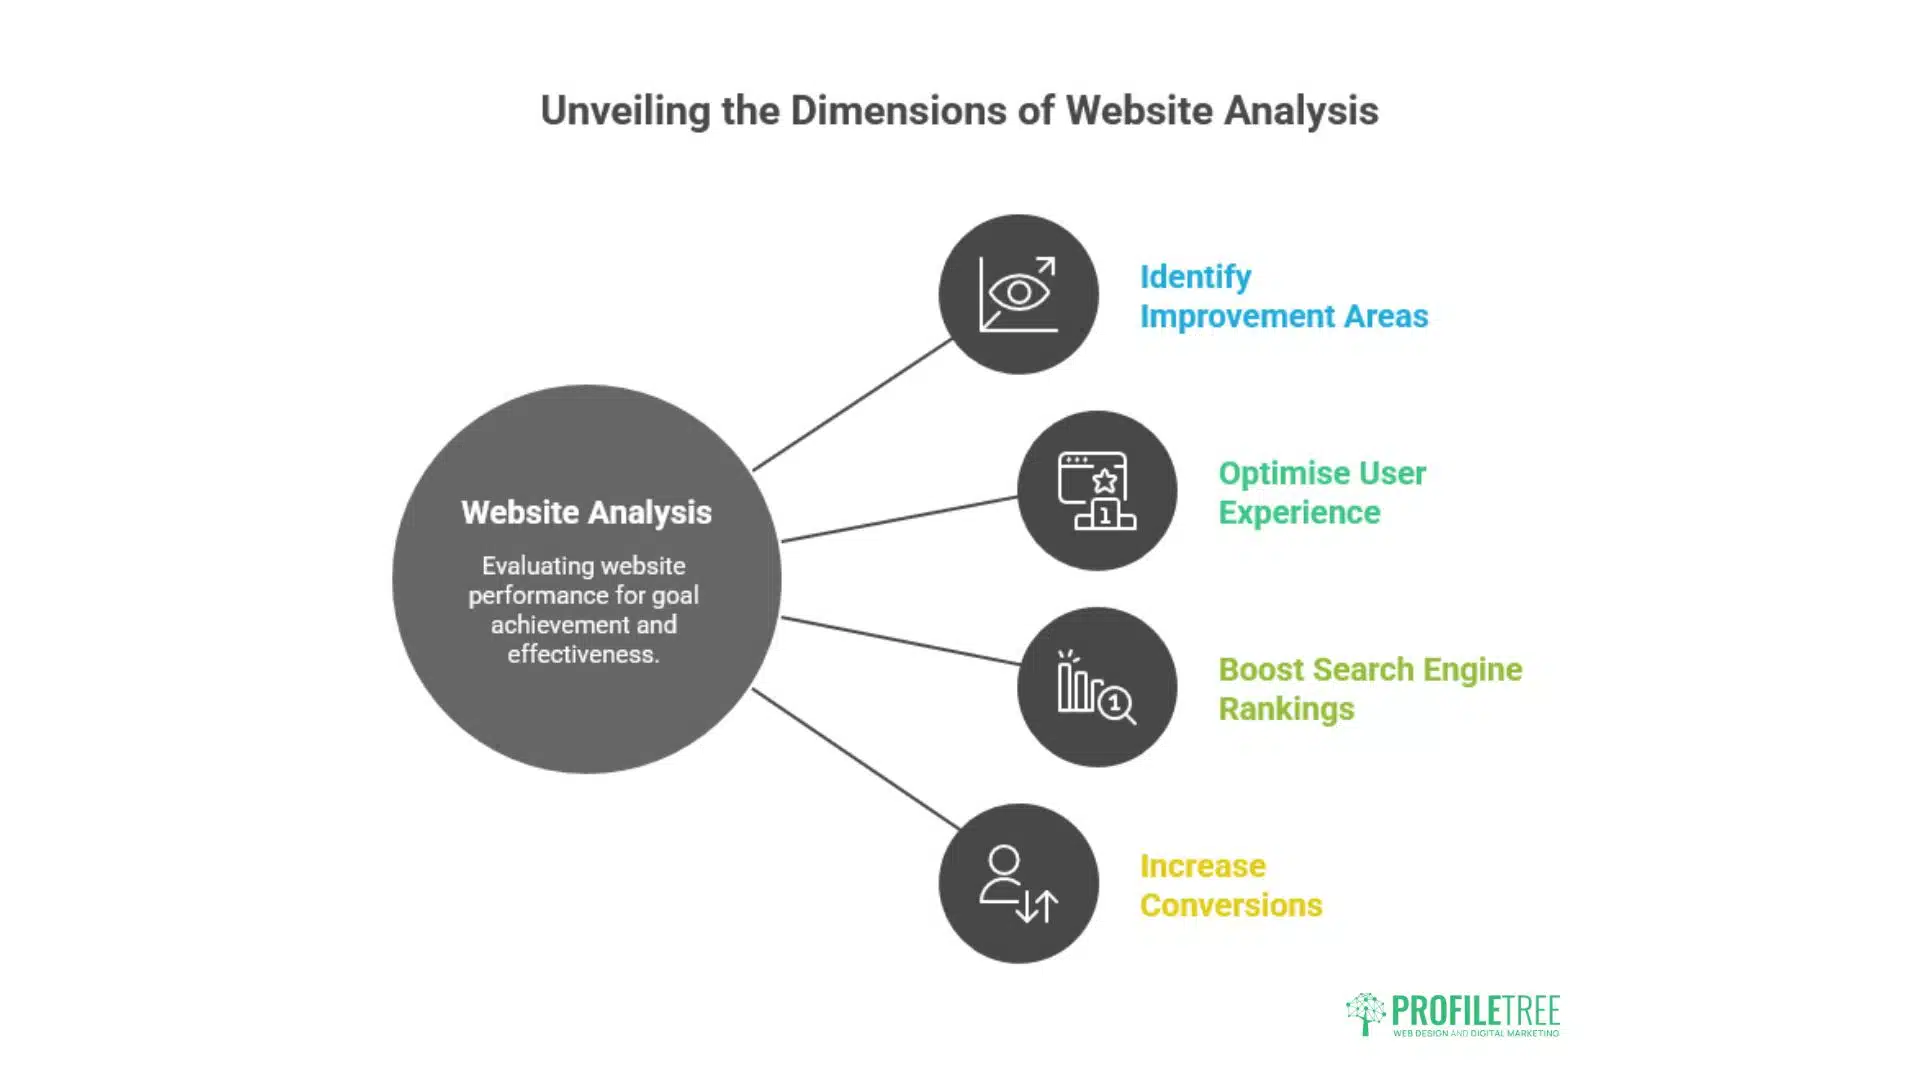
Website analysis is the process of evaluating a website’s performance and overall effectiveness in achieving its goals. This process primarily aims to identify improvement areas, optimise user experience, boost search engine rankings, and increase conversions.
No matter why you created your website, you’ll have to analyse its performance, and you’ll have to do this multiple times throughout the years.
Luckily for you and all other website owners and marketers, a few metrics, or quantitative measurements, can help you conduct this analysis. Let’s look into three of those in a bit of detail.
Performance Metrics
Website performance metrics are essential for evaluating how well a website functions and delivers content to users. Key metrics like page load time, time to first byte (TTFB), and time to interactive (TTI) measure a site’s speed and responsiveness, ensuring visitors have a smooth, fast experience. Slow performance can lead to a poor user experience and higher bounce rates, which, in turn, affect SEO rankings.
Content metrics tell you whether or not your website’s content is performing and engaging your audience. These metrics include various factors such as readability, keyword density, and overall content quality.
For instance, readability scores help determine how easily users can comprehend your content, influencing their likelihood of staying on the page and absorbing the information. Monitoring keyword density ensures that your content is optimised for search engines, helping improve visibility. Additionally, analysing your content’s overall length and complexity can provide insights into user preferences and help tailor your approach to meet audience expectations.
Another vital aspect of content metrics is user engagement, which can be gauged through metrics like average time on page, social shares, and comments. A high average time on page typically indicates that visitors find the content valuable and engaging, while social shares can signal how well your content resonates with your audience.
User Acquisition Metrics
User acquisition metrics measure whether a website is effectively attracting and retaining visitors. Key metrics in this category include the number of unique visitors, page views, and traffic sources, such as organic search, paid advertising, social media, or referrals. All of those help website owners assess the effectiveness of their marketing strategies and allocate resources efficiently.
Another vital user acquisition metric is the conversion rate, which indicates the percentage of visitors who complete a desired action, such as signing up for a newsletter or purchasing. A higher conversion rate suggests the site effectively guides visitors through the customer journey.
How to Conduct a Website Analysis
Performing a website analysis is a crucial step in understanding how your site is performing and identifying areas for improvement. Here’s a step-by-step guide to help you conduct a thorough website analysis:
Define Your Goals: Determine what you want to achieve with your website analysis, such as increasing traffic, improving conversion rates, or enhancing user experience.
Analyse Website Traffic: Use tools like Google Analytics to gain insights into visitor behaviour, traffic sources, and demographics. Focus on metrics such as bounce rate, session duration, and pages per session.
Check SEO Performance: Conduct keyword analysis with tools like SEMrush or Ahrefs to identify driving keywords and assess rankings. Perform an on-page SEO audit to evaluate title tags, meta descriptions, header tags, and URL structure. Use Screaming Frog or Google Search Console for a technical SEO check to address issues like broken links, duplicate content, and XML sitemap errors.
Evaluate User Experience (UX): Assess the navigation structure, mobile responsiveness, and overall design. Use tools like GTmetrix or Google PageSpeed Insights to analyse page load times and identify areas for improvement. Understand user interactions using Hotjar or Crazy Egg.
Review Content Quality: Ensure your content aligns with user intent and provides value. Assess readability using tools like the Hemingway App or Grammarly, and refresh outdated or inaccurate content.
Analyse Competitors: Compare your site against competitors regarding traffic, SEO performance, and user engagement. Identify areas where competitors excel, such as content quality or backlink profiles.
Monitor Conversion Rates: Set up goals in Google Analytics to track conversions (e.g., purchases, sign-ups) and experiment with different elements (e.g., CTAs, layouts) to improve conversion rates.
Check for Technical Issues: Ensure your site has an SSL certificate and is secure. Test across different browsers and devices for consistent performance.
At this point, you understand the theory behind web analytics, but what tools should you use to analyse your website? Here are a few reliable free tools you can start using today.
Google Analytics
Google Analytics is a free web analytics service that will provide you with all the website traffic analytics you need. These site analytics are presented through simple charts and reports that your marketing team can read to assess the efficacy of your various advertising campaigns.
Here are the relevant web traffic analytics they provide:
Website Visitors Section
This section deals with all statistics relevant to the users viewing your site. It provides valuable content regarding the demographics of your viewers, time spent on your site and the following unique stats:
Absolute unique visitors: Each user’s IP address tracks this, which can be considered an accurate number of unique users.
Bounce Rate: This is the number of users who viewed your website but stayed for an insufficient time to count as a visit. If this number is high, it is wise to reformat your content. You should aim for your content to be as interesting as possible to attract more viewers.
Web Traffic Sources Section
Another essential section when you analyse your website revolves around your traffic sources. Here are some of the most relevant stats for your website:
Direct Traffic: The number of users who have reached your website directly by entering the URL.
Referral sites: This counts the number of users who reached your website through another linking website.
Search Engine: Viewers that reach your website through a search engine. To improve this statistic, check out our search engine optimisation strategies.
Keywords: This shows you the most popular keywords that users have used to find your site. Our content strategy guide shows that this can provide valuable insight into your content.
Content Section
This final section deals with your website’s formatting. It measures the engagement of your content and your most popular pages. This allows you to optimise your content further to suit your viewers and increase traffic.
Matomo
Matomo, formerly known as Piwik, is a versatile and free web analytics software that offers a unique approach to tracking your website’s performance. Unlike many other analytics solutions, Matomo requires users to download and host it on their servers, which requires a certain level of technical proficiency to set up and maintain.
However, the effort invested in using Matomo is often rewarded with its powerful features and flexibility. Here’s an explanation of why Matomo is a popular choice for web analytics.
First, Matomo’s self-hosted control offers complete authority over your data, making it an appealing choice for businesses and individuals prioritising data privacy and security. You have the flexibility to decide where your analytics data is stored and who can access it, ensuring that sensitive information remains secure. Additionally, Matomo provides unlimited storage for your analytics reports, allowing you to retain extensive historical data, which is invaluable for trend analysis and informed decision-making.
Another key feature of Matomo is its robust mobile app, enabling users to access analytics data on the go. This is especially beneficial for website owners and marketers who need real-time insights into their site’s performance, regardless of location. Furthermore, Matomo stands out with its high level of customisation, allowing users to create unique statistics tailored to their specific business goals and objectives, ensuring that the analytics align with their needs.
Matomo also offers a wide range of reports to help you comprehensively understand your website’s performance. Some of the commonly used stats to track include:
Segmentation: Analyse visitor data, page views, bounce rates, and demographic information to gain insights into your audience.
Sources: Understand where your website traffic is coming from, whether from search engines, referrals, or direct visits.
Content: Monitor metrics like time spent on pages, the popularity of specific pages, and the keywords that bring visitors to your site.
Matomo offers customisable reports tailored to your unique needs, allowing you to focus on the metrics that matter most to your business. You can also create multiple user accounts with varying access levels, which is particularly beneficial for involving your marketing team in optimising your website. This feature enables you to grant access to specific reports, ensuring that team members can view and analyse data relevant to their responsibilities.
UXtweak offers vast functionality for user research, with features such as usability testing, card sorting, tree testing, preference tests, and more. This tool can be used for both moderated and unmoderated research.
If you don’t have the participants for your research just yet, you can recruit them with UXtweak’s User Panel and get quality feedback from everyone in the test group.
The most popular website analytics features that UXtweak offers are:
Usability Testing: Perfect for identifying issues associated with design intuitiveness and unclear user journeys. It also helps identify malfunctioning design elements and improve CTAs.
Prototype Testing: Testing your prototypes and wireframes with users is vital to save time and money on future redesigns. Prototype testing can identify potential design problems and enhance UX from the beginning.
Card Sorting: Great for analysing the best way to categorise information on your website to create the most intuitive navigation menus. Card sorting can also be used for A/B testing of design elements.
Tree Resting is a fantastic option when the research aims to improve the intuitiveness of an already existing website’s information architecture.
Session Recordings are a very effective way to analyse users’ mental models, preferences, and behavioural patterns.
Business Growth Applications
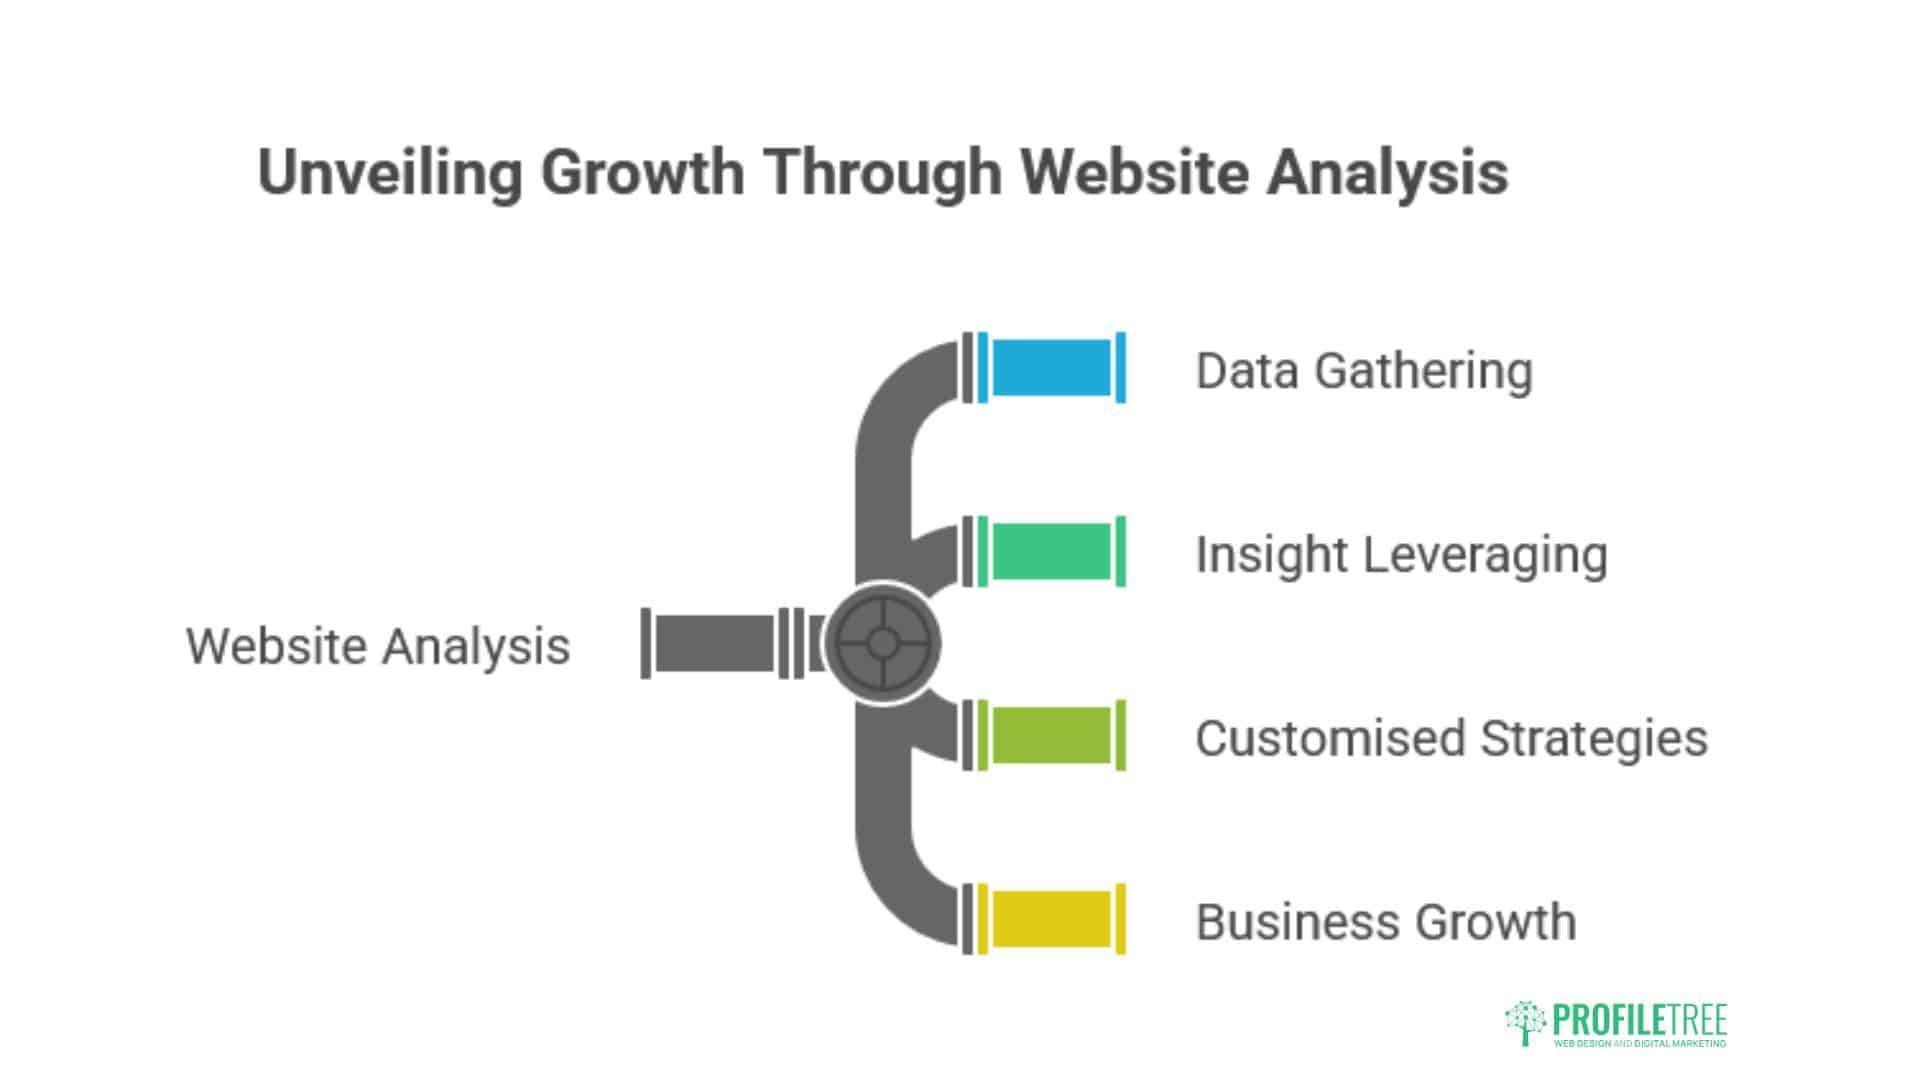
Website analysis isn’t just about collecting data—it’s about applying insights to drive real business growth. Different business types require tailored approaches to maximise results.
Shopping cart abandonment analysis reveals why users leave before completing purchases. Common issues include unexpected shipping costs, complicated checkout processes, or security concerns that can be addressed through targeted optimisation.
Product page performance analysis examines which products attract the most interest and convert best. This information guides inventory decisions, pricing strategies, and product presentation optimisation.
Customer lifetime value analysis helps identify which traffic sources and user behaviours correlate with long-term customer value, informing marketing spend allocation and retention strategies.
Lead Generation and Service Businesses
Service-based businesses focus on generating qualified leads rather than direct sales, requiring different analytical approaches and success metrics.
Contact form analysis examines conversion rates and identifies barriers preventing visitors from submitting inquiries. Simple changes to form design or placement can dramatically improve lead generation.
Content marketing analysis reveals which topics and formats resonate most with your target audience, guiding content strategy and resource allocation.
Service page performance analysis identifies which services generate the most interest and inquiries, helping prioritise marketing efforts and resource allocation.
Content Strategy and Authority Building
Content-focused websites require analysis approaches that examine engagement, authority building, and audience development over time.
Topic performance analysis reveals which subjects resonate most with your audience, guiding future content creation and helping establish topical authority.
User engagement patterns show how visitors interact with different content types, helping optimise content format and presentation for maximum impact.
Social sharing analysis identifies content that generates the most social engagement, providing insights into what motivates your audience to share and engage.
Search visibility analysis tracks your content’s performance in search results, helping identify opportunities for improved rankings and visibility.
Conversion Rate Optimisation Strategies
Conversion rate optimisation represents the systematic approach to improving the percentage of visitors who complete desired actions on your website.
A/B testing methodologies allow you to test different pages, forms, or calls-to-action versions to identify what performs best with your specific audience.
User journey mapping reveals users’ paths through your site and identifies where they commonly exit or encounter difficulties.
Personalisation strategies use visitor data to tailor content and experiences to individual users, improving relevance and conversion rates.
Website analysis is essential for maximising your digital presence and driving sustainable business growth. Success comes from connecting data insights to tangible business outcomes, not just collecting interesting metrics.
The key is to take a systematic approach with the right tools and maintain consistent effort over time. When applied strategically, minor improvements compound into significant competitive advantages.
“At ProfileTree, we’ve seen how strategic website analysis transforms businesses from simply having an online presence to actively driving growth through their digital platforms. The key is moving beyond basic metrics to understand how your website serves your business objectives,” notes Ciaran Connolly, Director of ProfileTree.
Expert Insight: Beyond the Numbers
“Many business owners get overwhelmed by the sheer volume of data available through website analysis tools. The real value isn’t collecting more data—it’s identifying the three or four metrics that directly impact your bottom line and focusing your efforts there. We’ve helped hundreds of businesses across Northern Ireland and the UK transform their digital presence by connecting website performance to actual business outcomes, not just vanity metrics,” explains Ciaran Connolly, Director of ProfileTree.
FAQs
How often should you analyse your website?
Conduct a comprehensive analysis quarterly, with monthly reviews of key metrics like traffic, conversions, and performance indicators. Critical issues should be monitored continuously through automated alerts.
What are the most important elements to analyse?
Focus on traffic sources, conversion rates, technical performance, mobile optimisation, and user engagement metrics. These elements directly impact business outcomes and provide actionable insights.
What tools do SEO professionals use for analysis?
Google Analytics and Google Search Console form the foundation, supplemented by tools like SEMrush, Ahrefs, Hotjar, and Screaming Frog for comprehensive analysis. The specific combination depends on business needs and budget.
How can you analyse user behaviour effectively?
Use heat mapping tools, session recordings, and user flow analysis to understand how visitors interact with your site. Combine quantitative data with qualitative feedback for complete insights.
Is website analysis something you can automate?
While many reporting aspects can be automated, human interpretation remains crucial for understanding context, identifying opportunities, and developing strategic responses to data insights.
Ready to Transform Your Digital Performance?
Understanding website data is one thing—turning those insights into profitable growth is entirely different. Most business owners struggle to bridge the gap between analytics and actionable results that drive real revenue.
ProfileTree delivers complete digital transformation:
Web Design & Development – Sites built for conversions, not just aesthetics
AI Implementation & Training – Practical automation that saves time and cuts costs
SEO & Content Strategy – Ranking systems that bring qualified customers to your door
Video Production & YouTube Strategy – Content that builds authority and drives engagement
Digital Marketing Training – Upskill your team with proven frameworks
Partner with ProfileTree for:
✓ Complete website analysis and actionable strategy
✓ Prioritised roadmap with measurable steps
✓ Proven results – clients see improvements within 90 days
Free Offer: 30-minute consultation where we’ll identify your top three improvement opportunities.
Every online business presence wants one thing: sales. To achieve sales, one must have a website that is intuitive and responsive to your customers wants and...
Website structure, also known as website architecture, refers to the hierarchy of a site. This architecture determines the placement of each page and how they all...
Email is a versatile channel which offers a direct and personalised way to connect with your target audience, fostering customer relationships, driving sales, and boosting brand...