Business Spending Statistics: How Companies Invest Today
Table of Contents
Business owners across the UK face unprecedented challenges in allocating their limited resources effectively. With inflation impacting operational costs and digital transformation accelerating across industries, understanding where businesses spend their money has never been more critical. This comprehensive analysis of business spending statistics reveals the data-driven insights that successful companies use to optimise their budgets and drive sustainable growth.
From labour costs that can consume up to 70% of total expenses to the rising importance of digital marketing investments, we’ll explore the financial patterns that define modern business operations. Whether you’re a startup founder planning your first budget or an established business leader looking to benchmark your spending against industry standards, this guide provides the actionable intelligence you need.
Business Spending Fundamentals
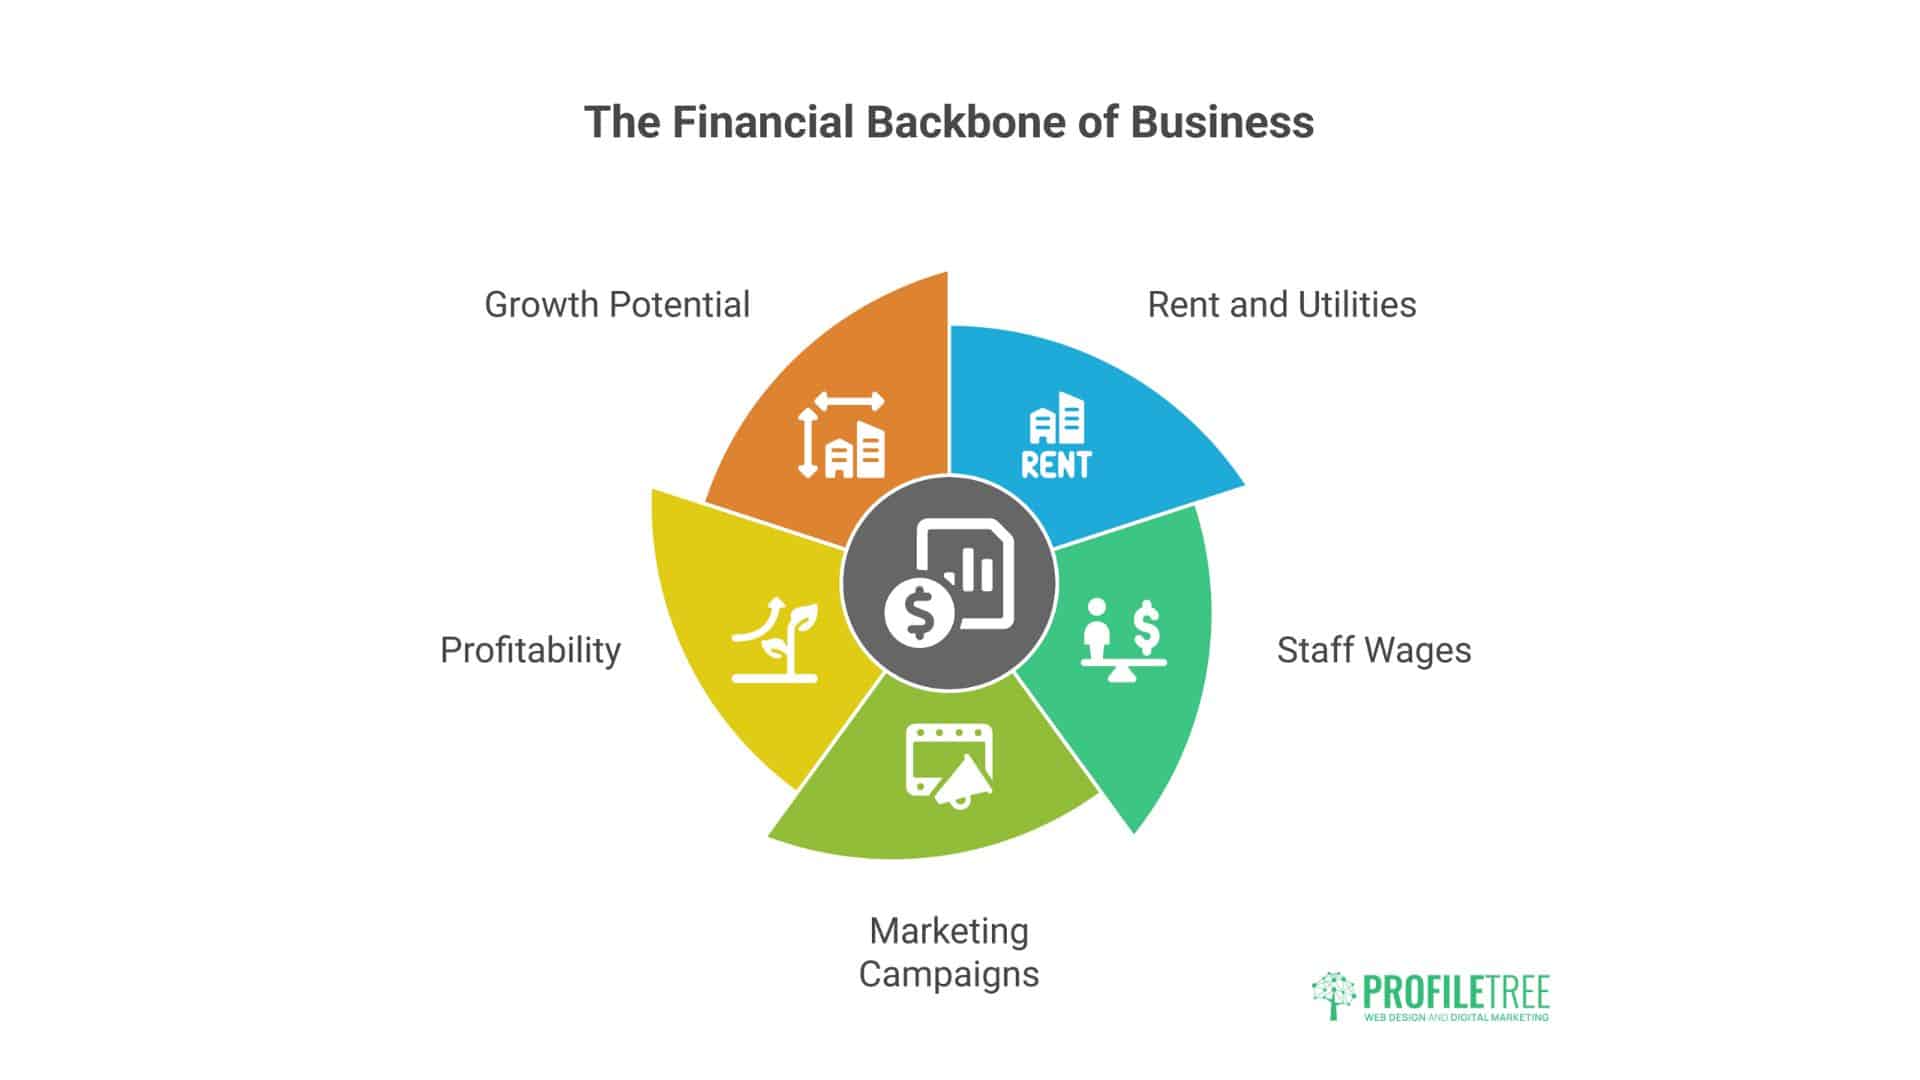
Business expenses and expenditures represent the foundation of financial planning for any organisation. These costs, which include everything from rent and utilities to staff wages and marketing campaigns, directly impact profitability and growth potential. The UK’s Office for National Statistics reports that businesses across Britain collectively spend over £2.8 trillion annually on operational expenses.
Definition of Business Expenses and Expenditures
Business expenses encompass all costs incurred by a company to operate and generate revenue. These expenditures fall into several categories:
- Operating Expenses: Daily operational costs, including rent, utilities, insurance, and supplies. These typically represent 60-80% of total business spending for most UK companies.
- Labour Costs: Employee wages, benefits, National Insurance contributions, and pension schemes. Research shows these costs average 40-70% of total expenses across different sectors.
- Capital Expenditures: Investments in equipment, technology, and infrastructure that provide long-term value. UK businesses typically allocate 8-15% of revenue to capital investments.
- Marketing and Sales Costs: Promotional activities, advertising, and business development initiatives. Digital transformation has shifted much of this spending online, with UK businesses allocating an average of 11.2% of turnover to marketing activities.
The Business Expenses Survey Landscape
Understanding business spending patterns requires systematic data collection. The UK’s Business Expenses Survey, conducted regularly by government agencies and private research firms, provides valuable insights into spending habits across different industries and company sizes.
Recent survey data reveals several key trends:
- Small businesses (under £2M turnover) spend proportionally more on marketing and technology as a percentage of revenue
- Medium enterprises (£2M-£50M) focus heavily on operational efficiency and staff development
- Large corporations allocate significant resources to research and development, averaging 3-5% of revenue
The frequency of these surveys has increased, with quarterly updates now available to help businesses adapt quickly to changing market conditions. This real-time data proves invaluable for strategic planning and competitive benchmarking.
Labour Cost Management
Labour costs represent the single largest expense category for most UK businesses, often accounting for 40-70% of total expenditures. Understanding how to manage these costs effectively whilst maintaining productivity and employee satisfaction presents one of the greatest challenges facing business leaders.
Understanding Labour Cost Components
Labour expenses extend far beyond basic salaries. UK employers must account for:
- Direct Wages: Base salaries and hourly rates vary significantly by region and industry. London-based businesses typically pay 20-30% more than the national average.
- Employer National Insurance: It is 13.8% of earnings above £175 per week, representing a substantial additional cost.
- Pension Contributions: Minimum 3% employer contribution under auto-enrolment, though many businesses offer higher rates to attract talent.
- Benefits and Perquisites: Health insurance, company cars, training budgets, and flexible working arrangements that add 15-25% to base salary costs.
- Recruitment and Retention: Costs associated with hiring, onboarding, and replacing staff members.
Strategic Approaches to Labour Cost Optimisation
Successful businesses employ several strategies to manage labour costs without compromising service quality:
- Skills-Based Workforce Planning: Aligning staffing levels with business needs rather than maintaining fixed headcounts. This approach can reduce labour costs by 10-15% while improving productivity.
- Flexible Working Arrangements: Remote and hybrid working models can reduce office space requirements and increase employee satisfaction, leading to lower turnover rates.
- Training and Development: Investing in existing staff skills often proves more cost-effective than recruiting externally. UK businesses that prioritise staff development report 23% lower turnover rates.
- Performance-Based Compensation: Linking compensation to business outcomes encourages productivity whilst controlling fixed costs.
“We’ve found that businesses investing strategically in their workforce, through training, technology, and flexible arrangements, consistently outperform those that cut labour costs. It’s about smart spending, not just less spending,” says Ciaran Connolly, Director of ProfileTree.
Digital Marketing Investment Trends
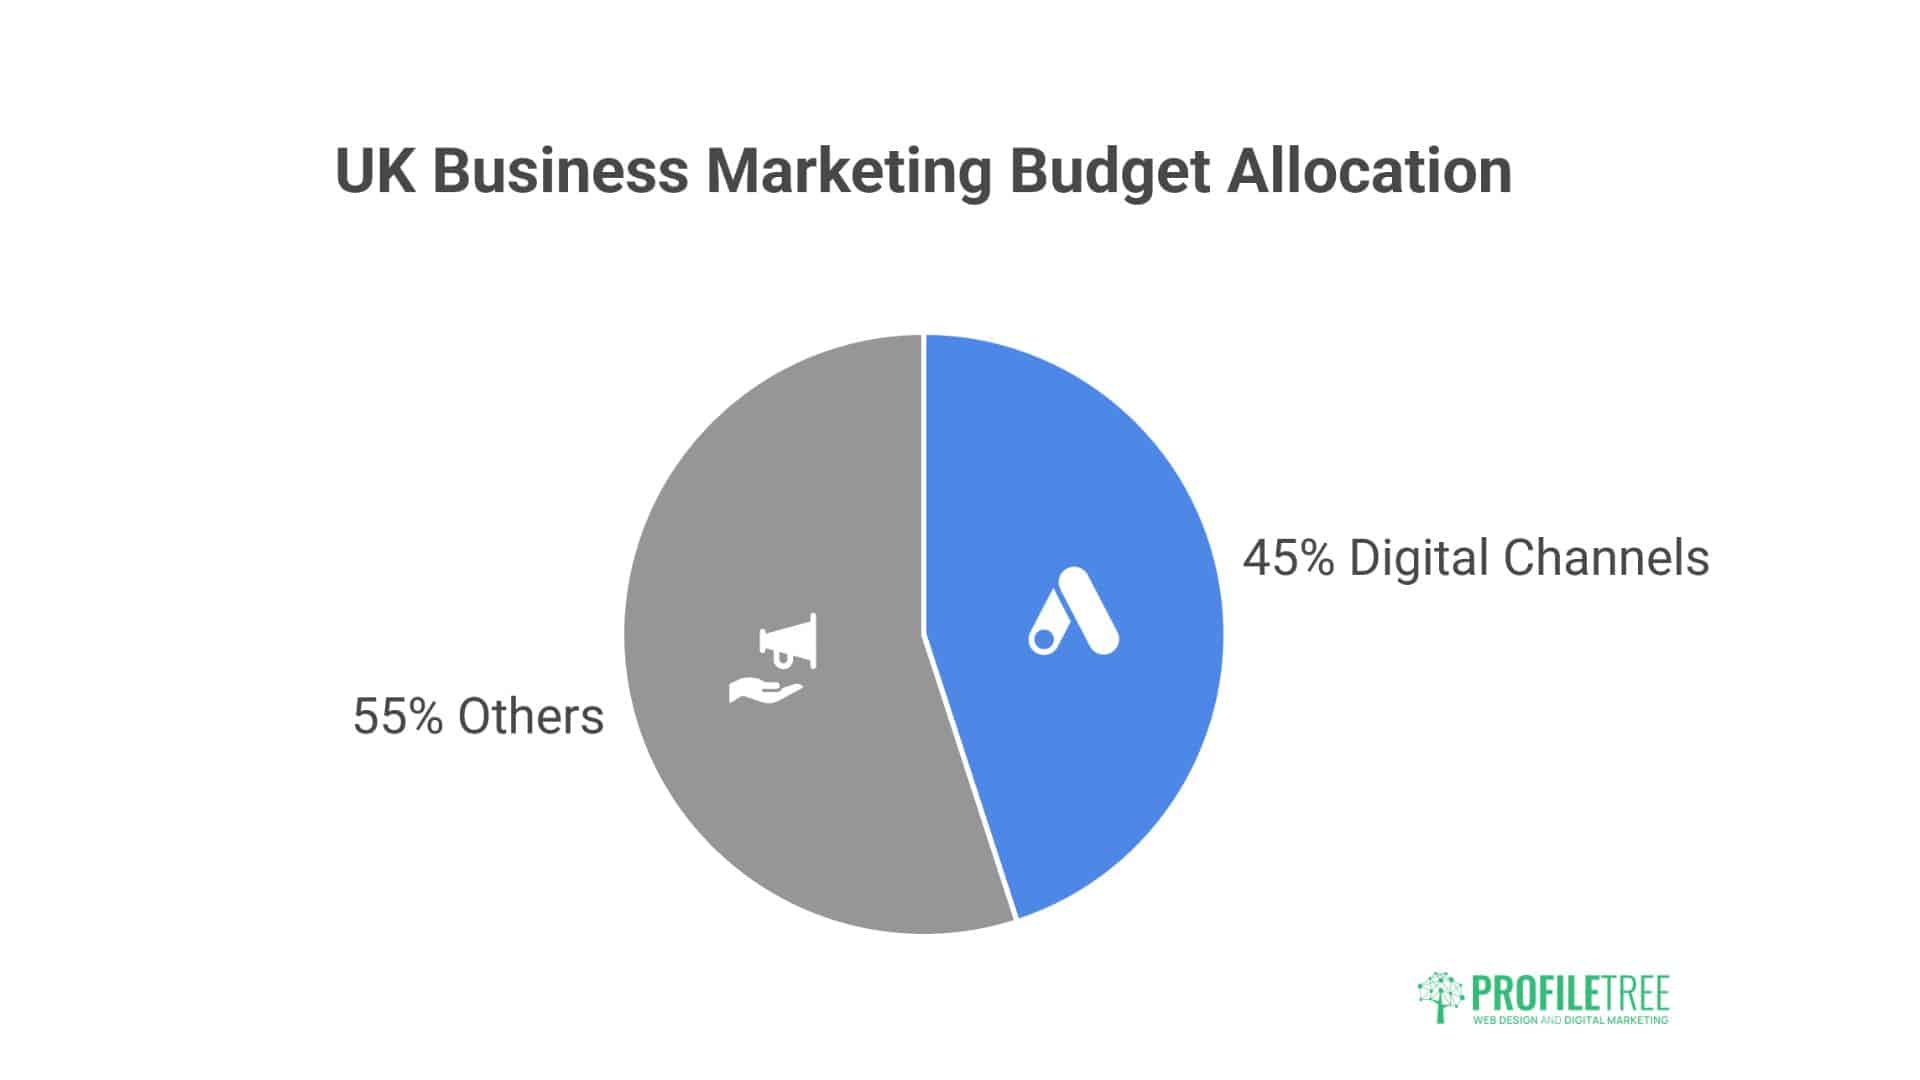
The digital transformation of business operations has fundamentally altered spending patterns, with marketing technology and digital advertising representing the fastest-growing expense categories. UK businesses now allocate approximately 45% of their total marketing budgets to digital channels, reflecting the shift in consumer behaviour and the measurable ROI digital platforms provide.
Digital Marketing Budget Allocation
Understanding where successful businesses invest their digital marketing pounds provides valuable benchmarking data:
- Search Engine Optimisation (SEO): Long-term organic growth strategies typically consume 20-25% of digital marketing budgets. UK businesses investing in professional SEO services report an average ROI of 300-400% over 12-18 months.
- Pay-Per-Click (PPC) Advertising: Google Ads and social media advertising account for 35-40% of digital spending. The immediate measurability and targeting capabilities make PPC attractive for businesses seeking quick results.
- Content Marketing: Blog posts, video content, and social media materials represent 15-20% of digital budgets. Content marketing generates three times more leads than traditional marketing while costing 62% less.
- Social Media Marketing: Platform management, advertising, and influencer partnerships consume 10-15% of digital marketing resources.
- Marketing Technology: CRM systems, analytics platforms, and automation tools require 10-15% of budgets but provide the infrastructure for efficient campaign management.
Industry-Specific Digital Spending Patterns
Different sectors demonstrate varying approaches to digital marketing investment:
- Professional Services: Law firms, accountancies, and consultancies typically spend 8-12% of revenue on digital marketing, focusing heavily on local SEO and thought leadership content.
- Retail and E-commerce: These businesses often allocate 15-20% of revenue to digital marketing, emphasising PPC advertising and social media presence.
- Manufacturing: Traditional manufacturers are increasing digital spend, typically investing 3-8% of revenue as they develop direct-to-consumer channels.
- Technology Companies: SaaS and tech firms often spend 20-30% of revenue on marketing, with significant investment in content marketing and lead generation systems.
Measuring Digital Marketing ROI
Successful businesses track specific metrics to evaluate their digital marketing investments:
- Customer Acquisition Cost (CAC): The total cost of acquiring one new customer through digital channels. UK businesses report average CACs ranging from £150-£2,500 depending on industry and deal size.
- Lifetime Value (LTV): The total revenue expected from a customer relationship. Successful digital marketing strategies maintain LTV: CAC ratios of 3:1 or higher.
- Return on Ad Spend (ROAS): Direct revenue generated per pound spent on advertising. High-performing campaigns achieve ROAS of 4:1 to 8:1.
- Organic Traffic Growth: When properly implemented, SEO investments typically increase organic website visitors by 15-25% quarterly.
“The businesses we work with that allocate their digital marketing budgets strategically – focusing on long-term SEO alongside targeted PPC campaigns – consistently achieve better ROI than those chasing quick fixes. Data-driven spending decisions separate successful companies from the rest,” notes Ciaran Connolly.
Technology Infrastructure Spending
The rapid acceleration of digital transformation has elevated IT and technology spending to critical importance for UK businesses. Recent data indicates that technology infrastructure investments now represent 8-15% of total business expenditures, and this figure continues to rise across all sectors.
IT Spending Benchmarks by Industry
Different industries demonstrate varying levels of technology investment based on their operational requirements:
- Financial Services: Banks and insurance companies typically allocate 12-18% of revenue to technology, driven by regulatory requirements and digital customer expectations.
- Healthcare: NHS trusts and private healthcare providers invest 6-10% of their budgets in technology infrastructure, focusing on patient management systems and telemedicine capabilities.
- Manufacturing: Traditional manufacturers now spend 4-8% of revenue on technology, primarily for automation, supply chain management, and quality control systems.
- Professional Services: Law firms, consultancies, and accounting practices allocate 8-12% to technology, emphasising client management systems and productivity tools.
Essential Technology Investments
Modern businesses require several core technology components:
- Cloud Infrastructure: Migration to cloud services represents 30-40% of IT budgets. UK businesses report 20-30% cost savings compared to traditional on-premise solutions.
- Cybersecurity: Security investments consume 15-20% of IT budgets, making cyber insurance increasingly important for risk management.
- Business Software: CRM systems, accounting software, and industry-specific applications typically account for 25-35% of technology spending.
- Hardware and Equipment: Computers, servers, and mobile devices represent 20-25% of IT budgets, though cloud adoption reduces hardware requirements.
Emerging Technology Trends
Forward-thinking businesses are investing in emerging technologies:
- Artificial Intelligence: AI implementation costs range from £10,000 for basic automation to £500,000+ for comprehensive AI transformation projects.
- Business Automation: Process automation tools typically provide a 200-300% ROI within the first year of implementation.
- Data Analytics: Advanced analytics platforms help businesses make data-driven decisions. Depending on complexity, implementation costs range from £ 15,000 to £ 150,000.
Regional Business Spending Variations
Business spending patterns vary significantly across the UK, influenced by local economic conditions, labour costs, and industry concentrations. Understanding these regional differences helps businesses benchmark their expenses and identify potential cost optimisation opportunities.
London and South East England
The capital and surrounding regions demonstrate the highest business spending levels:
- Average Salaries: 25-30% above the national average, directly impacting labour cost calculations.
- Office Rent: Commercial property costs 2-3 times higher than other UK regions, forcing businesses to reconsider space utilisation.
- Marketing Spend: Higher competition drives increased marketing investments, with businesses typically spending 15-20% more on customer acquisition.
Northern England and Scotland
These regions offer cost advantages whilst maintaining access to a skilled workforce:
- Labour Costs: 15-20% below London rates whilst offering comparable skill levels in many sectors.
- Commercial Property: Office and industrial space costs 40-60% less than in southern England.
- Government Incentives: Various regional development grants and tax incentives reduce effective business costs.
Wales and Northern Ireland
These regions provide significant cost advantages for certain business types:
- Manufacturing Costs: Industrial land and labour costs often 30-40% below English averages.
- Digital Infrastructure: Improved broadband and mobile coverage support remote working and digital business models.
- Skills Development: Government-funded training programmes reduce employee development costs.
Future Spending Trends and Predictions
Business spending patterns evolve as companies adapt to technological advancements, changing consumer expectations, and economic uncertainty. Several key trends shape how UK businesses allocate resources over the next 3-5 years.
Increasing Digital Investment
Digital transformation spending shows no signs of slowing:
- Marketing Technology: Investment in marketing automation, customer data platforms, and analytics tools is expected to grow 25-30% annually.
- Artificial Intelligence: Business AI adoption predicted to increase spending by 40-50% per year as costs decrease and capabilities expand.
- Cybersecurity: Rising threat levels drive continued investment growth of 15-20% annually in security infrastructure.
Sustainability and ESG Spending
Environmental, Social, and Governance (ESG) considerations increasingly influence business spending:
- Green Technology: Investment in renewable energy, electric vehicles, and sustainable practices is growing 20-25% annually.
- Social Responsibility: Community investment, diversity programmes, and ethical sourcing initiatives are receiving increased budget allocation.
- Governance Systems: Compliance, reporting, and stakeholder management systems require additional investment as regulations expand.
Workforce Evolution
Changing employment patterns affect labour cost planning:
- Remote Work Infrastructure: Technology and systems supporting distributed teams require ongoing investment.
- Skills Development: Continuous learning programmes become essential as job requirements evolve rapidly.
- Flexible Benefits: Employee expectations drive investment in comprehensive benefits packages and wellness programmes.
Industry-Specific Spending Benchmarks
Different industries demonstrate unique spending patterns based on operational requirements, regulatory environment, and competitive landscape. Understanding these sector-specific benchmarks helps businesses evaluate their resource allocation and identify optimisation opportunities.
Professional Services Sector
Law firms, consultancies, accounting practices, and similar knowledge-based businesses share common spending characteristics:
- Labour Intensive Operations: Staff costs typically represent 60-75% of total expenses, reflecting the people-centric nature of professional services. Senior staff compensation often includes profit-sharing arrangements that can increase this percentage further.
- Technology Investment: Modern professional services firms allocate 10-15% of revenue to technology, focusing on client management systems, document automation, and communication platforms. Legal tech and compliance software represent growing expense categories.
- Business Development: Client acquisition and relationship management consume 8-12% of revenue, with significant investment in networking events, thought leadership content, and professional marketing services.
- Professional Development: Continuing education, certification maintenance, and skills development typically account for 3-5% of payroll costs as firms maintain competitive expertise.
- Office and Location: Prime location office space remains important for client meetings and professional credibility, typically representing 8-15% of total expenses.
Manufacturing and Production
Manufacturing businesses face unique cost structures driven by production requirements:
- Raw Materials and Inventory: Material costs typically represent 40-60% of total expenses, with businesses maintaining significant working capital to manage supply chain fluctuations.
- Equipment and Maintenance: Capital equipment depreciation and maintenance costs average 15-25% of operational expenses, with automation investments increasing this percentage.
- Quality Control and Compliance: Manufacturing standards, safety requirements, and quality assurance systems typically consume 5-8% of operational budgets.
- Supply Chain Management: Logistics, warehousing, and supply chain technology investments represent 8-12% of total costs as businesses optimise efficiency and reduce waste.
- Energy and Utilities: Manufacturing facilities often allocate 8-15% of operational budgets to energy costs, driving investment in renewable energy and efficiency improvements.
Technology and Software Companies
Tech businesses demonstrate unique spending patterns that reflect their innovation-focused operations:
- Research and Development: Software companies typically invest 15-25% of revenue in R&D activities, significantly higher than most other industries.
- Talent Acquisition and Retention: Competitive salaries and comprehensive benefits packages often consume 50-70% of operational budgets as companies compete for skilled developers and technical staff.
- Cloud Infrastructure: Technology businesses spend 8-15% of revenue on cloud services, hosting, and technical infrastructure to support their products and services.
- Sales and Marketing: Customer acquisition costs in the tech sector often require 20-40% of revenue allocation, particularly for B2B software companies with longer sales cycles.
- Intellectual Property Protection: Legal patent protection, trademark registration, and IP enforcement costs represent 2-5% of revenue for many technology companies.
Retail and E-commerce
Retail businesses face unique challenges in balancing physical and digital operations:
- Inventory Management: Stock purchasing and holding costs typically represent 50-70% of operational expenses, with sophisticated forecasting systems reducing waste.
- Marketing and Customer Acquisition: Retail businesses often spend 15-25% of revenue on marketing activities, with increasing focus on digital channels and customer retention programmes.
- Physical Infrastructure: Store rent, utilities, and maintenance costs vary significantly but typically range from 15% to 25% of revenue for traditional retailers.
- Technology Integration: Point-of-sale systems, inventory management, and e-commerce platforms consume 5-10% of operational budgets as retailers adapt to omnichannel customer expectations.
- Staff Training and Development: Customer service training and product knowledge programmes typically account for 2-4% of payroll costs.
Actionable Strategies for Cost Optimisation
Successful businesses combine strategic spending with careful cost management to maximise growth whilst maintaining financial stability. The following proven strategies help optimise business expenditure without compromising operational effectiveness.
Systematic Expense Review
Regular expense auditing identifies cost reduction opportunities:
- Monthly Financial Review: Comparing actual spending against budgets highlights areas requiring attention.
- Vendor Negotiations: Annual contract reviews often yield 5-15% cost reductions through renegotiation or competitive bidding.
- Technology Consolidation: Eliminating redundant software subscriptions and services typically saves 10-20% of IT budgets.
Performance-Based Spending
Linking expenditure to measurable outcomes improves ROI:
- Marketing Attribution: Tracking campaign performance allows reallocation of budgets to the highest-performing channels.
- Staff Productivity Metrics: Connecting training investment to performance improvements justifies development spending.
- Technology ROI: Measuring system efficiency gains validates infrastructure investments.
Strategic Outsourcing
Professional service providers often deliver superior results at lower total costs:
- Digital Marketing: Specialist agencies typically achieve better results than in-house teams whilst reducing overhead costs.
- IT Support: Managed service providers offer 24/7 support at predictable monthly costs.
- Accounting and Finance: Professional bookkeeping services often cost less than employing full-time staff.
Conclusion
Understanding business spending statistics provides the foundation for strategic financial planning and sustainable growth. Successful UK businesses invest strategically in areas that drive revenue growth whilst carefully managing operational costs.
The key lies not in spending less, but in spending more strategically. Businesses that regularly benchmark their spending against industry standards and implement performance-based budgeting consistently outperform their competitors.
For organisations seeking to optimise their spending allocation, particularly in digital marketing and technology infrastructure, professional guidance can accelerate results while avoiding costly mistakes. The complexity of modern business operations requires expertise across multiple disciplines to achieve optimal outcomes.
FAQs
What percentage of revenue should businesses spend on marketing?
UK businesses typically allocate 8-15% of revenue to marketing activities, with digital channels now representing 45-60% of total marketing budgets. B2B companies often spend 6-10%, whilst B2C businesses may invest 10-20% depending on their growth stage and competitive landscape.
How can small businesses reduce labour costs without affecting service quality?
Small businesses can optimise labour costs through flexible working arrangements, skills-based training to improve productivity, performance-based compensation structures, and strategic use of technology to automate routine tasks. Focus on efficiency improvements rather than simple cost-cutting.
What are the essential technology investments for modern businesses?
Core technology requirements include cloud-based infrastructure, cybersecurity systems, customer relationship management (CRM) software, and reliable internet connectivity. Many businesses also benefit from automation tools, data analytics platforms, and industry-specific software solutions.
How do business spending patterns differ between industries?
Professional services typically spend more on labour and technology, manufacturing businesses invest heavily in equipment and automation, retail companies focus on marketing and inventory management, whilst technology firms allocate significant resources to research and development activities.
Ready to Optimise Your Business Spending for Maximum Growth?
Don’t let your competitors gain the advantage whilst you’re still figuring out where to allocate your marketing budget. At ProfileTree, we’ve helped hundreds of businesses across Northern Ireland, Ireland, and the UK transform spending into strategic growth investments.
Whether you need a website that actually converts visitors into customers, SEO that drives qualified traffic, or AI implementation that streamlines your operations, our team combines data-driven insights with proven strategies to deliver measurable results.
Get your free digital marketing audit today and discover:
- Where your current spending could be more effective
- Untapped opportunities your competitors are missing
- A personalised strategy to maximise your ROI
Contact ProfileTree today or call 028 9568 0364 to speak with our Belfast-based team about transforming your business spending into sustainable growth.
Stop guessing with your business budget. Start growing with purpose.