Conversion Rate Optimisation: A UK Guide to Higher Conversions
Table of Contents
Most businesses spend heavily on driving traffic to their website. Far fewer put the same effort into what happens once visitors arrive. Conversion rate optimisation (CRO) closes that gap. It’s the structured, evidence-led process of turning more of your existing traffic into leads, enquiries, or sales, without spending a penny more on adverts.
ProfileTree, a Belfast-based web design and digital marketing agency, works with businesses across Northern Ireland, Ireland, and the UK to identify exactly where visitors drop off and what changes will actually move the needle. This guide covers what conversion rate optimisation means in practice, how to calculate and benchmark your rate, the five-step testing process that underpins any credible programme, and the UK-specific compliance and psychology factors that most guides written for a US audience quietly skip over.
What Is Conversion Rate Optimisation?
Before testing anything, it helps to agree on what the term actually means and why it matters more than simply chasing more traffic.
Conversion rate optimisation is the process of increasing the percentage of website visitors who complete a specific desired action. That action might be a purchase, an enquiry form submission, a phone call, a demo booking, or a newsletter sign-up. Whatever outcome matters most to your business is your conversion.
Not every conversion carries equal weight. A macro conversion is your primary goal, such as a completed purchase or a qualified enquiry. Micro conversions are the smaller steps that lead there: adding an item to a basket, watching a video past the halfway point, or downloading a brochure. Tracking micro conversions gives you a detailed view of where visitors are dropping off before they reach the final step.
Conversion rate optimisation has moved well beyond testing button colours and headline fonts. Modern practice draws on behavioural psychology to understand why users hesitate. Loss aversion explains why honest urgency signals work. Social proof explains why named testimonials tend to outperform generic star ratings. Understanding these principles changes what you test and why, rather than randomly trialling design tweaks and hoping one sticks.
How to Calculate Your Website Conversion Rate
Once you understand what a conversion is for your business, the next step is putting a number on it.
The formula is simple:
Conversion Rate (%) = (Number of Conversions ÷ Total Visitors) × 100
If your website receives 5,000 visitors a month and 100 complete an enquiry form, your conversion rate is 2%. This is often the first question people ask when they search for what a conversion rate actually is, and the calculation itself rarely trips anyone up. The harder question is “what does conversion rate mean for your specific business?”, because a “good” number depends heavily on sector and traffic quality.
UK benchmarks vary by industry. E-commerce typically sits between 1% and 4%, with fashion and beauty performing towards the higher end and large-ticket purchases towards the lower end. B2B and professional services websites generally convert at 1% to 3%, because the decision cycle is longer and involves more than one stakeholder. High-intent landing pages built for a specific campaign can reach considerably higher rates than a general service page. If your enquiry-focused page sits below 1%, that’s a reasonable signal to start investigating.
| Sector | Typical Conversion Rate | Notes |
| UK e-commerce | 1% to 4% | Wide variation by product price point |
| B2B lead generation | 1% to 3% | Longer decision cycles reduce the rate |
| High-intent landing pages | 5% or higher | Depends heavily on traffic quality |
Transaction size affects these figures, too. A £15 impulse purchase converts very differently to a £15,000 B2B contract, so comparing your rate against a generic industry average without accounting for price point and traffic source can lead you to the wrong conclusion.
Why does this matter more than simply buying more traffic? Paid clicks cost money every time. Organic rankings take months to build. Improving your conversion rate from 1.5% to 3% on an existing base of 10,000 monthly visitors is the equivalent of doubling your traffic at no additional acquisition cost. That’s what makes conversion rate optimisation one of the highest-return investments a business can make in its website.
The Conversion Rate Optimisation Process: A Five-Step Framework
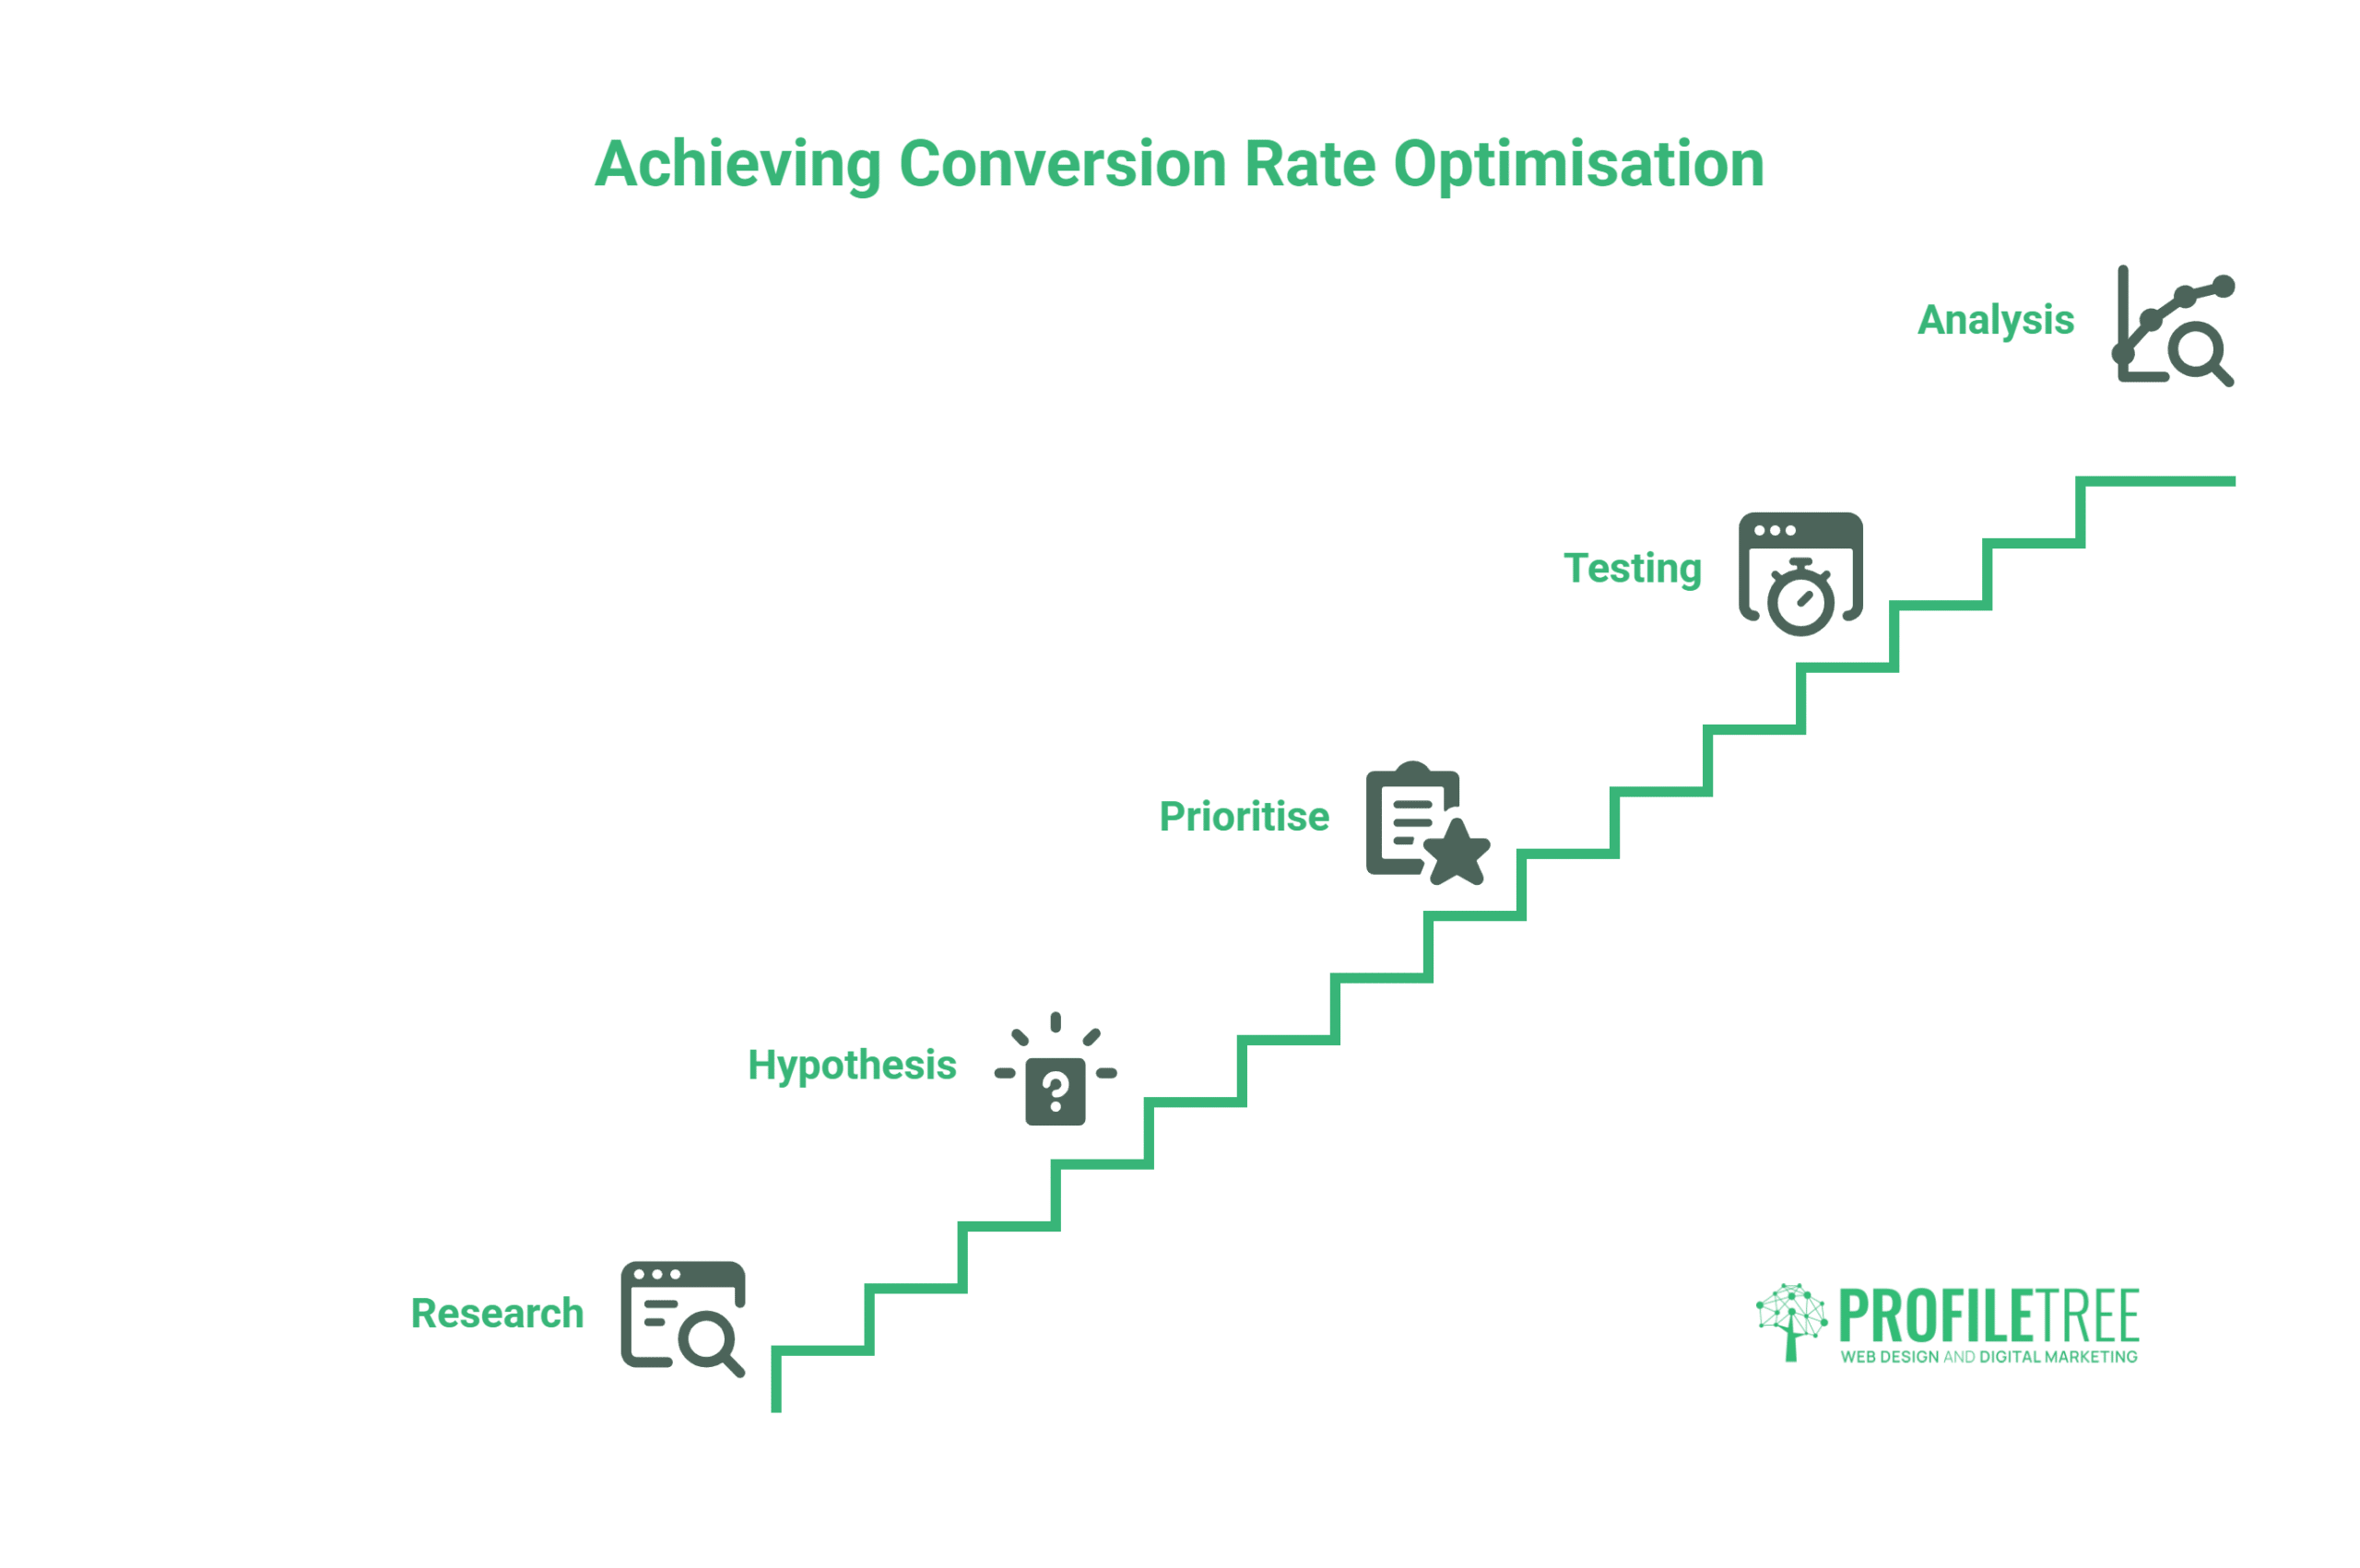
Sustainable improvements come from a structured process rather than guesswork. Here’s the five-step cycle that underpins any credible conversion rate optimisation programme.
Step 1: Quantitative and Qualitative Research
Before you test anything, you need to understand what’s happening on your site and why. This splits into two categories, and a proper programme needs both.
Quantitative research tells you what’s happening. Google Analytics 4 shows where visitors enter, where they exit, and how long they spend on each page. Funnel reports reveal the drop-off points between key steps, such as landing page to enquiry form, or product page to checkout. Pages with high exit rates and low engagement time are your first targets.
Qualitative research tells you why. User testing involves watching real people attempt a task on your site, whether that’s booking an appointment or submitting an enquiry. Even three or four sessions can surface friction points that no dashboard would reveal. Exit surveys ask visitors who are about to leave a simple question: what stopped you from completing your task today? Session recordings let you replay individual visits and see exactly where users hesitate, click repeatedly on things that aren’t clickable, or abandon a form halfway through.
Step 2: Building a Hypothesis
Every test should start with a clearly stated hypothesis, not a hunch. The structure that works consistently is: “Because we observed [data point], we believe that changing [specific element] will result in [expected outcome], measured by [metric].”
For example: “Because we observed that most mobile users exit the enquiry form before completing it, we believe reducing the form from seven fields to three will increase mobile completion rates, measured by conversion rate on mobile devices.” That’s specific and testable. A vague feeling that “the form looks too long” isn’t.
Step 3: Prioritising With the ICE Score
You’ll always have more test ideas than time to run them. The ICE framework, standing for Impact, Confidence, and Ease, gives you a consistent way to rank them. Score each idea across the potential uplift if it wins, how strong the evidence behind it is, and how much development effort it requires. Run the highest-scoring combinations first. The value isn’t the precise number; it’s the discipline of grounding your priorities in data rather than opinion, or whoever happens to be most senior in the room.
Step 4: Testing
Once you have a hypothesis, pick the right test type for your traffic level.
| Test Type | Complexity | Traffic Required | Best For |
| A/B Test | Low | Moderate | Single-element changes |
| Split URL Test | Medium | Moderate to high | Major design overhauls |
| Multivariate Test | High | 10,000+ sessions | Multiple simultaneous changes |
For most SME websites, A/B testing is the right starting point. Multivariate testing needs considerably more traffic to produce statistically valid results, and running it on a low-traffic site tends to produce misleading data.
A test is only meaningful if it’s statistically significant, meaning the probability that the result occurred by chance is low enough to be considered reliable. As a practical rule, run every A/B test for a minimum of two full business weeks, regardless of when significance is first reached, since this smooths out day-of-week patterns in user behaviour that would otherwise skew the result.
Step 5: Analysis and Iteration
A test result is only useful once you act on it. If the variation wins, roll it out and note what changed and why it worked. If the control holds, that’s still valuable: the hypothesis was wrong, and you now know more about how your users behave. A test that fails isn’t wasted effort; it’s evidence. Ask whether the sample size was too small or whether you were measuring the wrong metric. Either way, every test feeds the next cycle. Conversion rate optimisation has no finish line; it’s continuous learning and refinement.
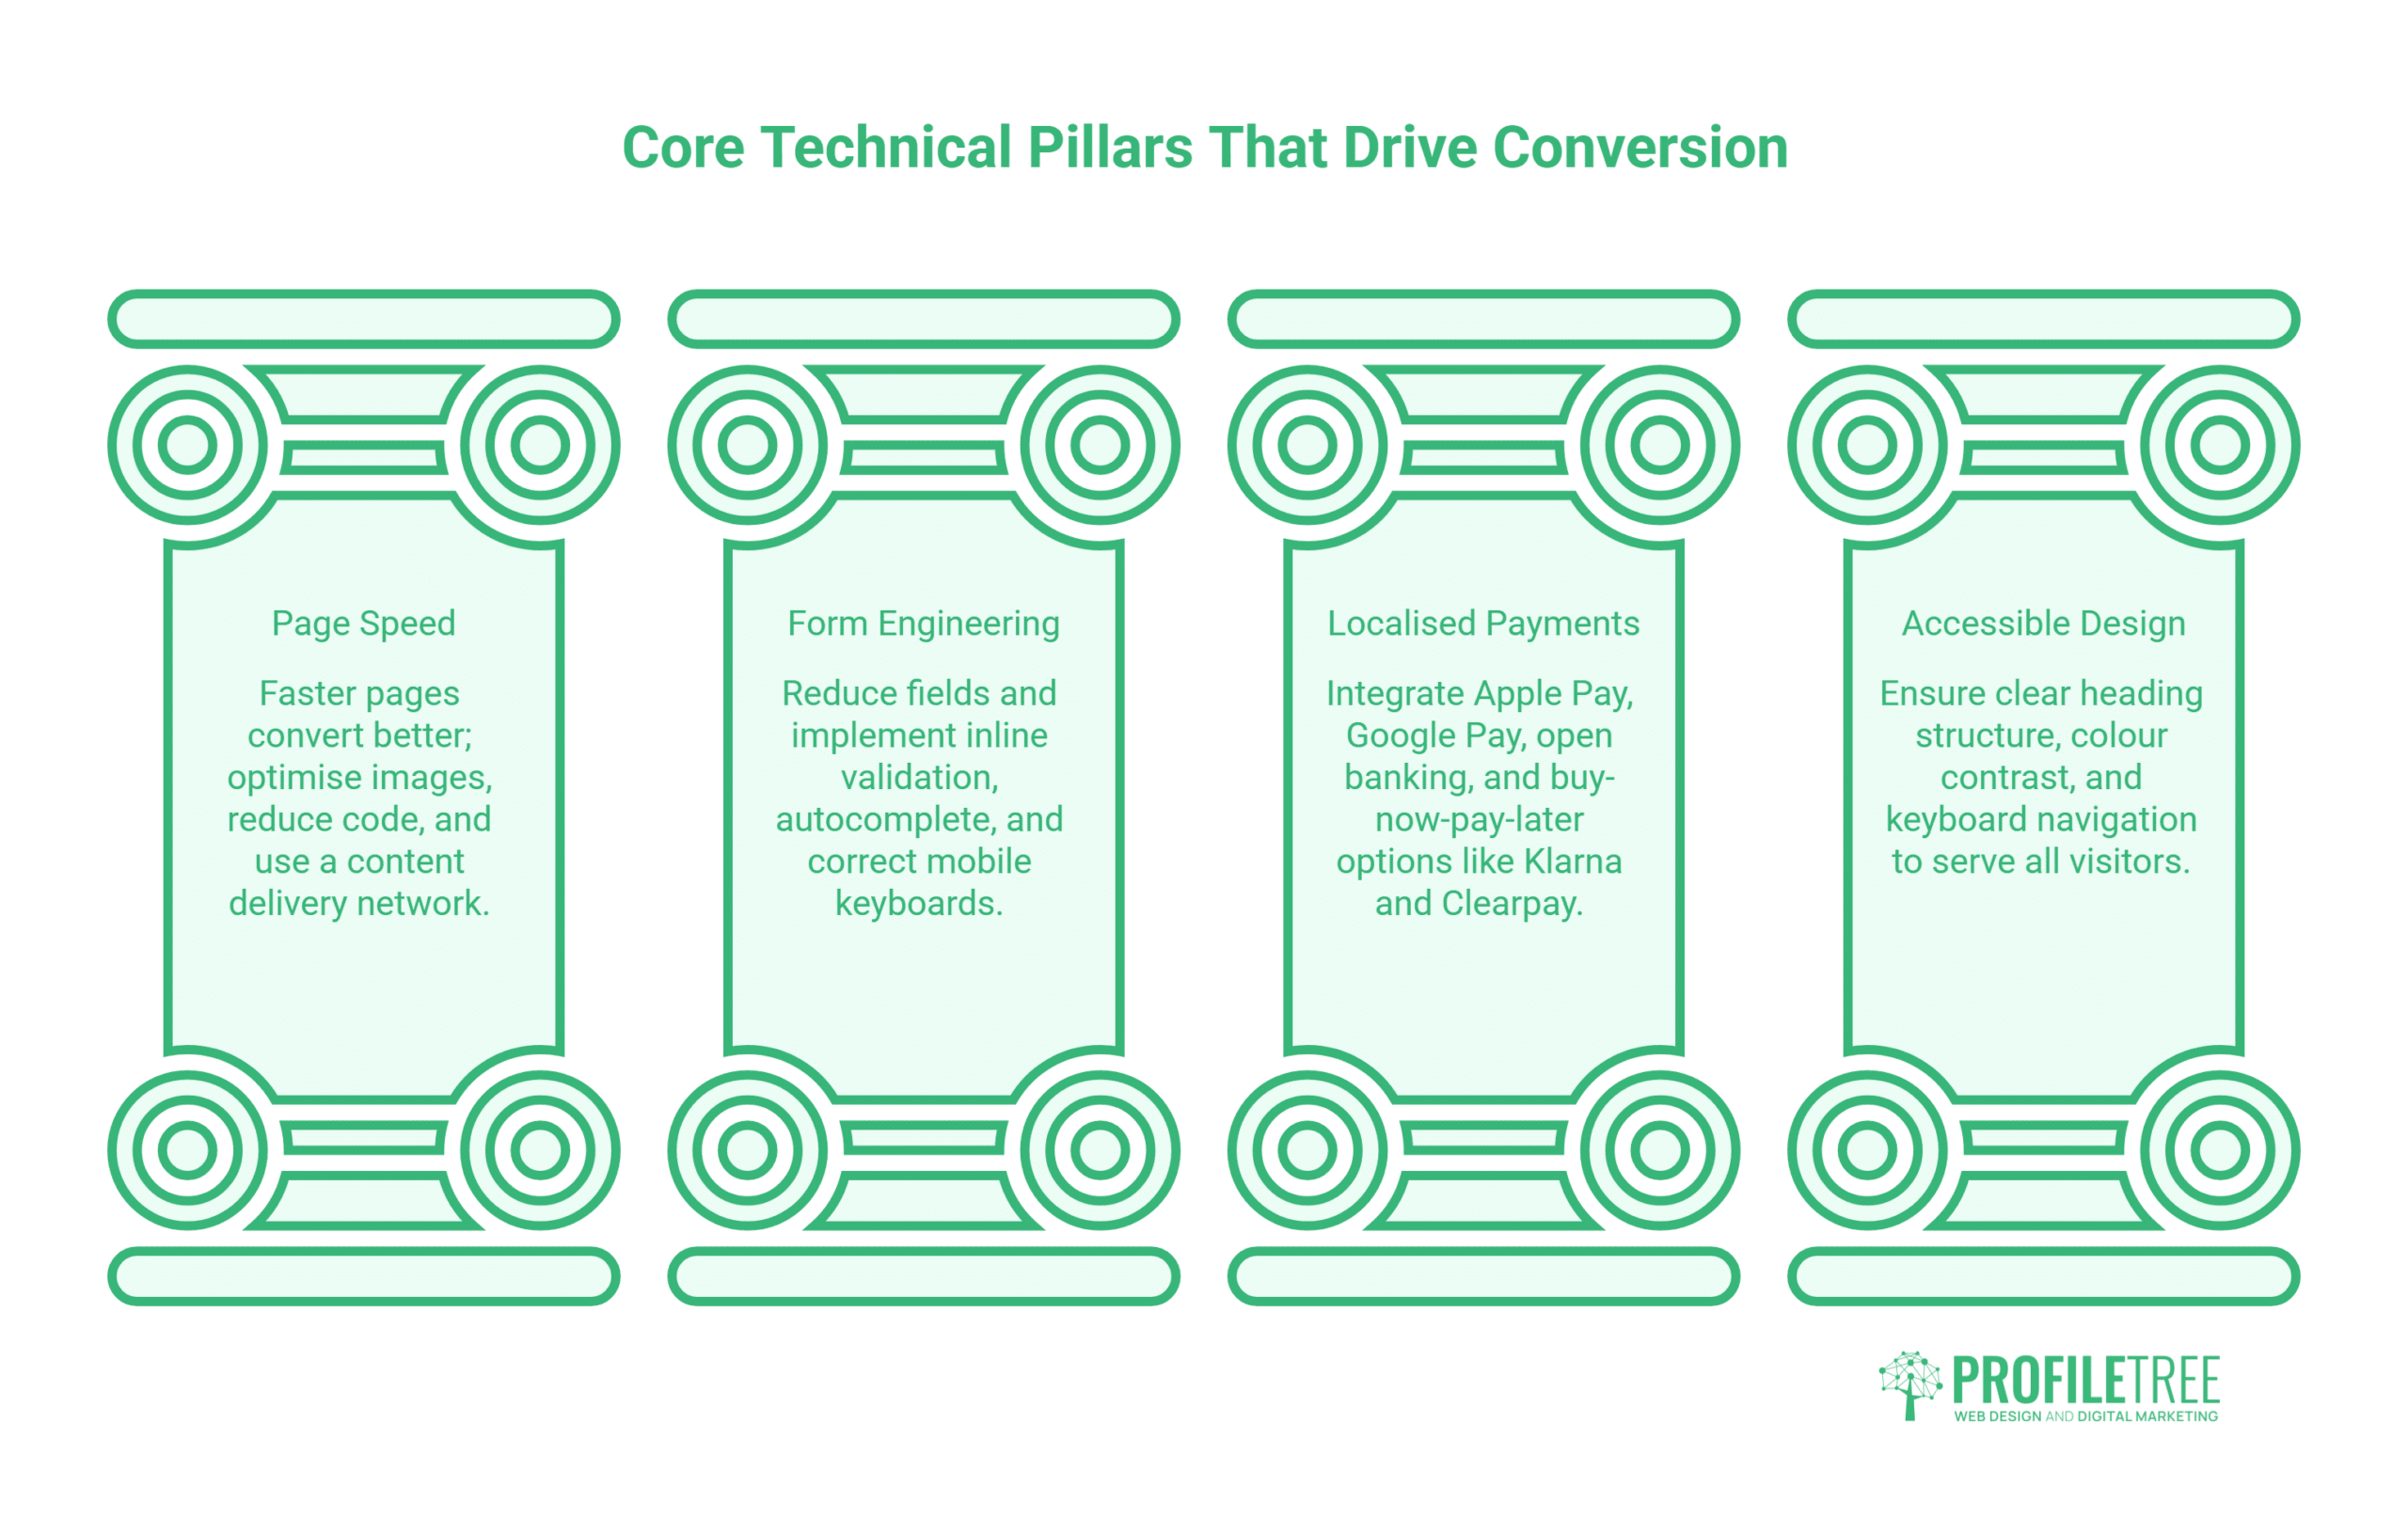
Core Technical Pillars That Drive Conversion
Testing and hypotheses only get you so far if the underlying site is working against you. This is where web design and development choices genuinely determine conversion outcomes, often more than any single A/B test.
Page Speed and Core Web Vitals
Faster pages convert better, consistently. Slow load times, particularly on mobile, increase the chance a visitor leaves before your message even loads. For e-commerce sites, small improvements in load time have historically been linked to measurable lifts in conversion rate, though the exact percentages you’ll find quoted online vary by source and should be treated as directional rather than precise.
Optimising images, reducing unnecessary code, and using a content delivery network all contribute to a faster site. If your website was built some years ago on an older platform, a technical audit by a web development specialist is often the quickest way to identify what’s actually slowing things down.
Form Field Engineering
Every additional field on a form reduces completion rates. Research often cited in this space suggests that removing even one unnecessary field can noticeably lift form completions, though you should treat any specific percentage as an industry rule of thumb rather than a guarantee for your own site.
Practical fixes include inline validation that catches errors as someone types, autocomplete for UK postcode lookups, and triggering the correct mobile keyboard for phone number or postcode fields. These are development-level changes, not simple copy tweaks, and they consistently outperform generic advice to “just shorten the form.”
Localised Payment Options
UK and Irish shoppers have distinct checkout expectations. High adoption of Apple Pay, Google Pay, open banking, and buy-now-pay-later providers such as Klarna and Clearpay means a checkout built purely around card payment is leaving conversions on the table. For e-commerce clients, this is often one of the highest-impact and lowest-effort changes available.
Accessible Design as a Conversion Driver
Accessible websites serve every visitor, including those using assistive technology, and UK businesses have obligations under the Equality Act 2010 to consider this properly. Beyond compliance, clear heading structure, sufficient colour contrast, and keyboard navigation tend to improve usability for everyone, not just users who rely on accessibility tools. Search engines also tend to favour accessible sites, so the benefit compounds.
A/B Testing in Practice
With the technical foundations in place, testing becomes a genuinely reliable way to confirm what works, rather than guessing at improvements on a shaky base.
The highest-impact elements to test first, in rough order of priority for most UK SME websites, include headlines, CTA button copy and colour, form length, the placement of trust signals such as reviews and accreditation badges, and the mobile layout of your hero section. A stacked mobile view of a desktop-designed hero often buries the call to action below the fold without anyone noticing until they check on a phone.
Several tools make this accessible without needing developer resources for every test. Google Optimise was discontinued some years ago; its functionality has since been replaced by GA4’s experiments feature. Other widely used platforms include Optimizely, VWO, and AB Tasty. When choosing a tool, prioritise one with a visual editor for non-technical teams and a built-in statistical calculator, so you’re not manually checking significance in a spreadsheet.
Heatmaps and Behavioural Analytics
Heatmaps translate raw interaction data into something you can actually look at and understand at a glance, which is where they earn their place alongside quantitative analytics.
- Click heatmaps show where users tap or click, which is useful for spotting elements people expect to be clickable but aren’t.
- Move heatmaps show where the cursor travels, correlating loosely with where desktop users are reading.
- Scroll heatmaps show how far down a page visitors get before leaving, which is critical for understanding whether your key message and CTA are being seen at all.
On a typical business website, scroll data often reveals that a large share of mobile visitors never scroll past the hero section, which is reason enough to reconsider anything buried further down the page.
Session recording tools such as Hotjar or Microsoft Clarity complement heatmaps by letting you watch individual visits. Look out for rage clicks, where someone taps repeatedly on something unresponsive, and U-turns, where a visitor lands on a page and immediately goes back. Heatmaps are diagnostic; A/B tests are confirmatory. Use one to form a hypothesis and the other to check whether your proposed change actually works.
UK GDPR, PECR, and Testing Under Privacy Constraints
Most conversion rate optimisation guides are written with a US audience in mind; they tend to skip over the compliance context that UK businesses actually operate within. This matters because UK GDPR and PECR directly affect what data you can legally collect and how.
What PECR Means for Cookie-Based Testing
The Privacy and Electronic Communications Regulations govern cookie use in the UK. Any cookie that isn’t strictly necessary for the site to function, which includes most analytics and heatmap tools, needs explicit, informed consent before it’s set. Pre-ticked boxes and “by continuing to use this site, you agree” notices don’t meet that bar. Heatmap tools and A/B testing platforms that set cookies without genuine, freely given consent fall short of this standard, regardless of how anonymised the resulting data might appear.
The Data Gap This Creates
The practical effect is that your analytics data likely undercounts a meaningful share of visitors, specifically those who decline cookies. This is worth factoring in when you interpret test results, because a skewed sample can make a losing variant look like a winner or vice versa. A test that looks conclusive after a week might simply reflect the habits of the minority who accepted tracking, not your audience as a whole. It’s a problem that isn’t going away, since consent rates continue to fall across most sectors.
Testing Without Relying on Cookies
Server-side tracking reduces reliance on browser cookies and gives a more complete picture of actual traffic than consent-gated tools can offer. It’s worth the technical investment if a large share of your audience declines consent, something that tends to be more common among B2B and professional audiences than consumer-facing e-commerce. First-party data collected directly through forms, surveys, and signed-in behaviour is your most compliant and reliable asset, since it isn’t subject to the same limitations as cookie-based tracking.
Compliance as a Trust Signal, Not Just a Legal Box to Tick
For UK businesses, getting UK GDPR and PECR right isn’t only about avoiding penalties. It also shapes how visitors perceive the site. A well-designed, genuinely clear cookie consent mechanism tends to build trust rather than erode it. A dark pattern that pressures users into accepting everything tends to undermine exactly the credibility that conversion rate optimisation is meant to strengthen.
Psychological Triggers for UK Consumers
The technical and compliance layers get a visitor to a working, legal page. What happens next is largely psychological, and UK audiences respond to specific cues that differ from what works in other markets.
Trust Signals That Work in the UK
Google reviews with star ratings carry particular weight because they’re perceived as harder to fake than testimonials on a company’s own site. Trustpilot carries credibility in finance, insurance, and e-commerce specifically. Professional body memberships and local business association listings signal that a company is established and accountable, which matters more to UK buyers than flashy design alone.
For B2B audiences, specific and verifiable outcomes tend to outperform generic praise.
As Ciaran Connolly, founder of ProfileTree, puts it: “Businesses often assume they understand their customers, but proper research reveals surprising gaps. Someone might visit your site with a completely different intent to the one you’re designing for, and understanding that changes your whole approach to conversion rate optimisation.”
CTA Language and the UK Preference for Understatement
UK audiences also tend to respond less favourably to high-pressure, American-style CTA language. Phrases like “act now, limited time only” can feel out of place in a B2B context where the decision involves several people and a longer consideration period. More measured alternatives, such as “see how it works” or “request a walkthrough”, tend to perform better in professional services and technology sectors, without tipping into passive or vague copy.
This doesn’t mean going soft. Clear, direct language still beats anything wishy-washy. “Talk to our team today” is specific and confident without reading like a hard sell. It’s worth testing the framing of your own CTAs rather than assuming a US-standard phrase will land the same way with a UK audience.
Reducing Perceived Risk
Perceived risk is frequently a bigger barrier than price or genuine interest. Visitors may want the service but feel uncertain about contract length, commitment, or whether it will actually work for their situation. Risk-reduction language, such as no long-term contracts, a free initial consultation, or a clear money-back guarantee where appropriate, can shift a hesitant visitor from browsing to actually getting in touch. This tends to matter more in B2B contexts, where the cost of getting a decision wrong falls on one person’s judgement rather than being spread across a household purchase.
Conversion Rate Optimisation for B2B Versus E-commerce
The underlying principles apply everywhere, but the tactics that work in e-commerce rarely translate directly to B2B. Knowing which context you’re in shapes where you focus your effort.
E-commerce CRO: Volume-Driven Testing
E-commerce conversion rate optimisation is volume-driven. There’s usually enough traffic to run statistically valid tests reasonably quickly, and each conversion has a clear, immediate value. The main focus areas are product pages, checkout, and basket abandonment recovery, since these are where most revenue leaks out of the funnel.
On product pages, trust signals and clarity of the add-to-basket action tend to matter most. Reviews, clear returns policies, and unambiguous stock availability all reduce hesitation at the point of decision. On checkout, reducing the number of fields, offering guest checkout, and providing multiple payment methods, including the localised options covered earlier, all improve completion rates. Mobile deserves its own attention here, since checkout abandonment on mobile tends to run noticeably higher than on desktop, often because forms and payment steps weren’t designed with a smaller screen in mind.
B2B CRO: Optimising for Fewer, Higher-Value Conversions
B2B conversion rate optimisation is a different problem entirely. A professional services firm generating a handful of qualified enquiries a month from a few hundred visitors can’t run traditional A/B tests and reach statistical significance in any reasonable timeframe. Waiting for a clean result could take months, by which point the test has probably lost its relevance.
Qualitative methods carry more weight here. Client interviews, mining reviews from Google and Trustpilot, and analysing the questions that come through contact forms all provide useful direction without needing a large sample. The most common blockers on B2B landing pages tend to be unclear articulation of the problem being solved, thin social proof, and a CTA that asks for too much commitment too early in the relationship (i.e. “book a consultation” when a visitor is still at the research stage and would respond better to something lower-commitment first).
Landing Page Optimisation: A Quick Hygiene Check
Before committing to a formal testing programme, it’s worth running through a short checklist, since fixing obvious issues first often delivers more improvement than any single test.
- The H1 clearly addresses the visitor’s intent, not a clever slogan
- The value proposition is visible above the fold on both desktop and mobile
- There’s one primary call to action, not several competing options
- Trust signals sit near the CTA, whether reviews, testimonials, or accreditation
- The form asks only for information genuinely needed at this stage
- Page load time is under three seconds on mobile
- Navigation is minimal, so landing pages don’t leak traffic elsewhere
- The page matches whatever ad or email brought the visitor there
Any item you can’t tick is a candidate for testing, but fix the fundamental issues first. There’s little point in testing headline variants on a page that takes eight seconds to load.
Choosing a Conversion Rate Optimisation Agency in the UK
Businesses searching for support with conversion rate optimisation, whether they’re based in Belfast, London, Leeds, or Surrey, tend to ask the same underlying question: what actually separates a good CRO agency from one that just runs random tests and hopes something sticks?
Genuine differentiation comes down to a few things. A proper agency builds hypotheses from real research rather than generic best-practice lists, treats UK privacy regulation as part of the testing methodology rather than an afterthought, and understands that a B2B site with modest traffic needs a different approach to a high-volume e-commerce store. Location matters less than this underlying discipline, though working with a UK-based team does mean the benchmarks, consumer psychology, and compliance guidance are grounded in your actual market rather than adapted from US-focused content.
ProfileTree works with SMEs across Northern Ireland, Ireland, and the wider UK on exactly this kind of work, combining web design and development with the digital marketing strategy needed to turn technical improvements into measurable conversion gains.
Tools for Conversion Rate Optimisation

Selecting the right tools depends on budget, technical capability, and traffic volume. The table below covers the core categories rather than a ranked list that would date quickly.
| Category | Example Tools | Best For |
| Behavioural Analytics | Hotjar, Microsoft Clarity | Heatmaps and session recording |
| A/B Testing | Optimizely, VWO, AB Tasty, GA4 Experiments | Testing page variants |
| Web Analytics | Google Analytics 4 | Funnel analysis and segmentation |
| User Research | Surveys, exit-intent polls | Understanding the “why” behind the data |
Microsoft Clarity deserves a specific mention because it’s free, provides unlimited session recordings, and integrates directly with GA4. For businesses working within tight budgets, it gives access to most of the behavioural analytics capability of paid platforms at no cost, with a slightly less polished interface as the main trade-off.
Bringing Strategy and AI Into the Picture
A technically sound, compliant, and psychologically informed website is the foundation. Digital marketing strategy and AI personalisation sit on top of that foundation rather than replacing it.
Digital marketing strategy determines which traffic reaches your site in the first place, and traffic quality directly affects conversion rate. A page converting poorly might not have a conversion problem at all; it might be receiving the wrong visitors. AI-driven personalisation, showing different content based on visitor behaviour or referral source, can meaningfully lift conversion once the basics are in place, though it’s rarely worth investing in before the fundamentals are sorted.
For SMEs building this capability internally rather than outsourcing it entirely, ProfileTree’s digital training programmes cover the analytics and data interpretation skills needed to run this kind of work with confidence.
Building Your Conversion Rate Optimisation Programme
Conversion rate optimisation isn’t a one-off project. The businesses that see sustained results treat it as an ongoing cycle: gather data, form a hypothesis, test, learn, and repeat. Every iteration builds a clearer picture of how your specific audience behaves.
The starting point doesn’t need to be complicated. Review your GA4 funnel data to find the page with the highest drop-off. Run a scroll heatmap to see how far visitors actually get. Form one testable hypothesis. Run it for two weeks. That single cycle, repeated consistently, is how meaningful improvements in conversion rate optimisation get built over time.
If you’d like ProfileTree to carry out an initial review of your website’s conversion performance, our team works with businesses across Northern Ireland, Ireland, and the UK to find where visitors are dropping off and what testing would have the biggest impact. Get in touch to start the conversation.
FAQs About Conversion Rate Optimisation
What is a good conversion rate for a UK business?
It depends heavily on the sector. UK e-commerce typically ranges from 1% to 4%, with wide variation by product type and price point. B2B professional services generally convert at 1% to 3% because decision cycles are longer. Rather than chasing a generic industry average, track improvement against your own baseline.
How long should an A/B test run?
A minimum of two full business weeks, regardless of when statistical significance is first reached. Ending a test too early on a small sample is one of the most common mistakes in conversion rate optimisation, and it produces a result that looks decisive but is actually driven by a skewed subset of your traffic.
Can you run conversion rate optimisation testing without cookies?
Yes, and UK businesses increasingly need to plan for exactly that. As more visitors decline cookie consent under UK GDPR and PECR, server-side tracking and first-party data collected through forms and signed-in sessions become more important, since neither depends on the same consent mechanism as browser cookies.
Does conversion rate optimisation affect SEO?
Generally, yes, and positively. Improved user experience signals, such as lower bounce rates and longer session durations, tend to correlate with stronger rankings. The main risk is technical: poorly implemented A/B testing scripts can cause layout shift, which is a Core Web Vital that affects search ranking.
What’s the difference between conversion rate optimisation and SEO?
SEO brings more visitors to your site. Conversion rate optimisation converts more of the visitors you already have. The two work well together: a site that ranks well but converts poorly is wasting the value of its own organic search performance.
How much traffic do I need before conversion rate optimisation is worthwhile?
Traditional A/B testing becomes unreliable below roughly 1,000 monthly sessions on the specific page being tested. Below that threshold, qualitative methods such as user interviews and session recordings tend to give more useful direction per pound spent than a formal test could.