YouTube Statistics: What the Numbers Mean for Your Business
Table of Contents
YouTube is the second-largest search engine in the world. For a business owner, that sentence carries more weight than almost any marketing statistic you will read today. This guide goes beyond listing YouTube statistics and explains what each data point means in practice for SMEs in the UK and Ireland trying to build a presence on the platform.
Whether you are deciding whether to invest in video production, wondering how YouTube fits into your SEO strategy, or trying to make sense of your channel analytics, the figures below give you a grounded starting point. Every YouTube statistic in this article is drawn from a named, verifiable source.
YouTube Usage Statistics: The Global Picture
Understanding YouTube’s scale provides context for every decision you make about video content. These YouTube statistics are not included here to impress; they are here because they determine whether investing in a channel is worth your time and money. The YouTube statistics below cover the most-cited metrics from Google’s published data and DataReportal’s annual Digital Report.
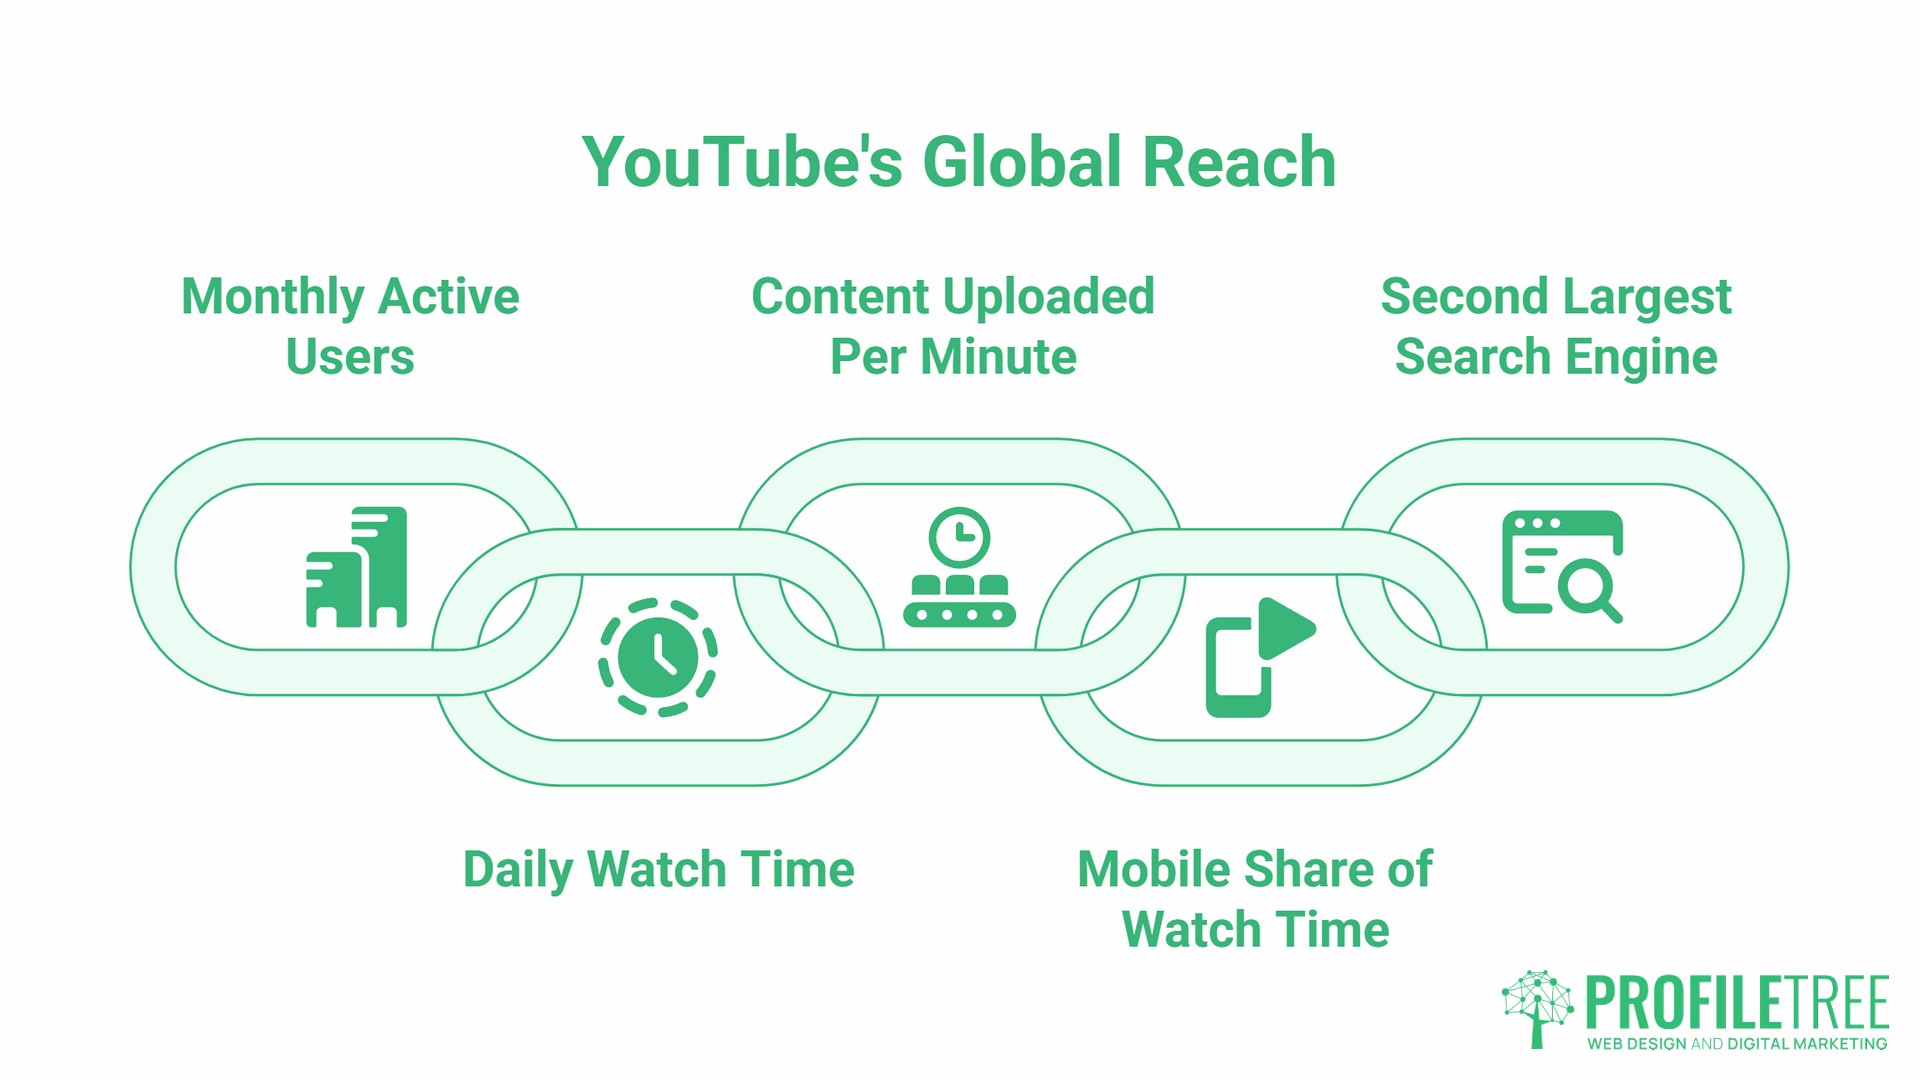
YouTube’s monthly active user base reached approximately 2.7 billion in 2025, growing from 2.5 billion in 2023 (Alphabet earnings, 2025). Users collectively watch more than 1 billion hours of content every day, and more than 500 hours of video are uploaded to YouTube every minute (YouTube Official Blog).
The competitive environment is real. For a business channel to get any traction, production quality and consistent publishing schedules matter far more than they did five years ago.
| Metric | Figure | Source |
|---|---|---|
| Monthly active users | 2.7 billion+ | Alphabet, 2025 |
| Daily watch time | 1 billion+ hours | YouTube Official Blog |
| Content uploaded per minute | 500+ hours | YouTube Official Blog |
| Mobile share of watch time | 63%+ | DataReportal, 2025 |
| Second largest search engine | Yes | Semrush, 2025 |
The mobile figure is worth pausing on. If the majority of views happen on a phone, a video filmed in 4K on a camera that nobody bothered to caption is already working against itself. Vertical framing, subtitles, and large on-screen text are not optional extras for mobile audiences; they are baseline requirements.
YouTube Statistics for the UK and Ireland
Global figures tell one story; the UK and Ireland picture tells another. Most competitor articles on YouTube statistics default to US-centric data. The regional numbers below are more relevant to businesses trading in Northern Ireland, the Republic of Ireland, and across Great Britain.
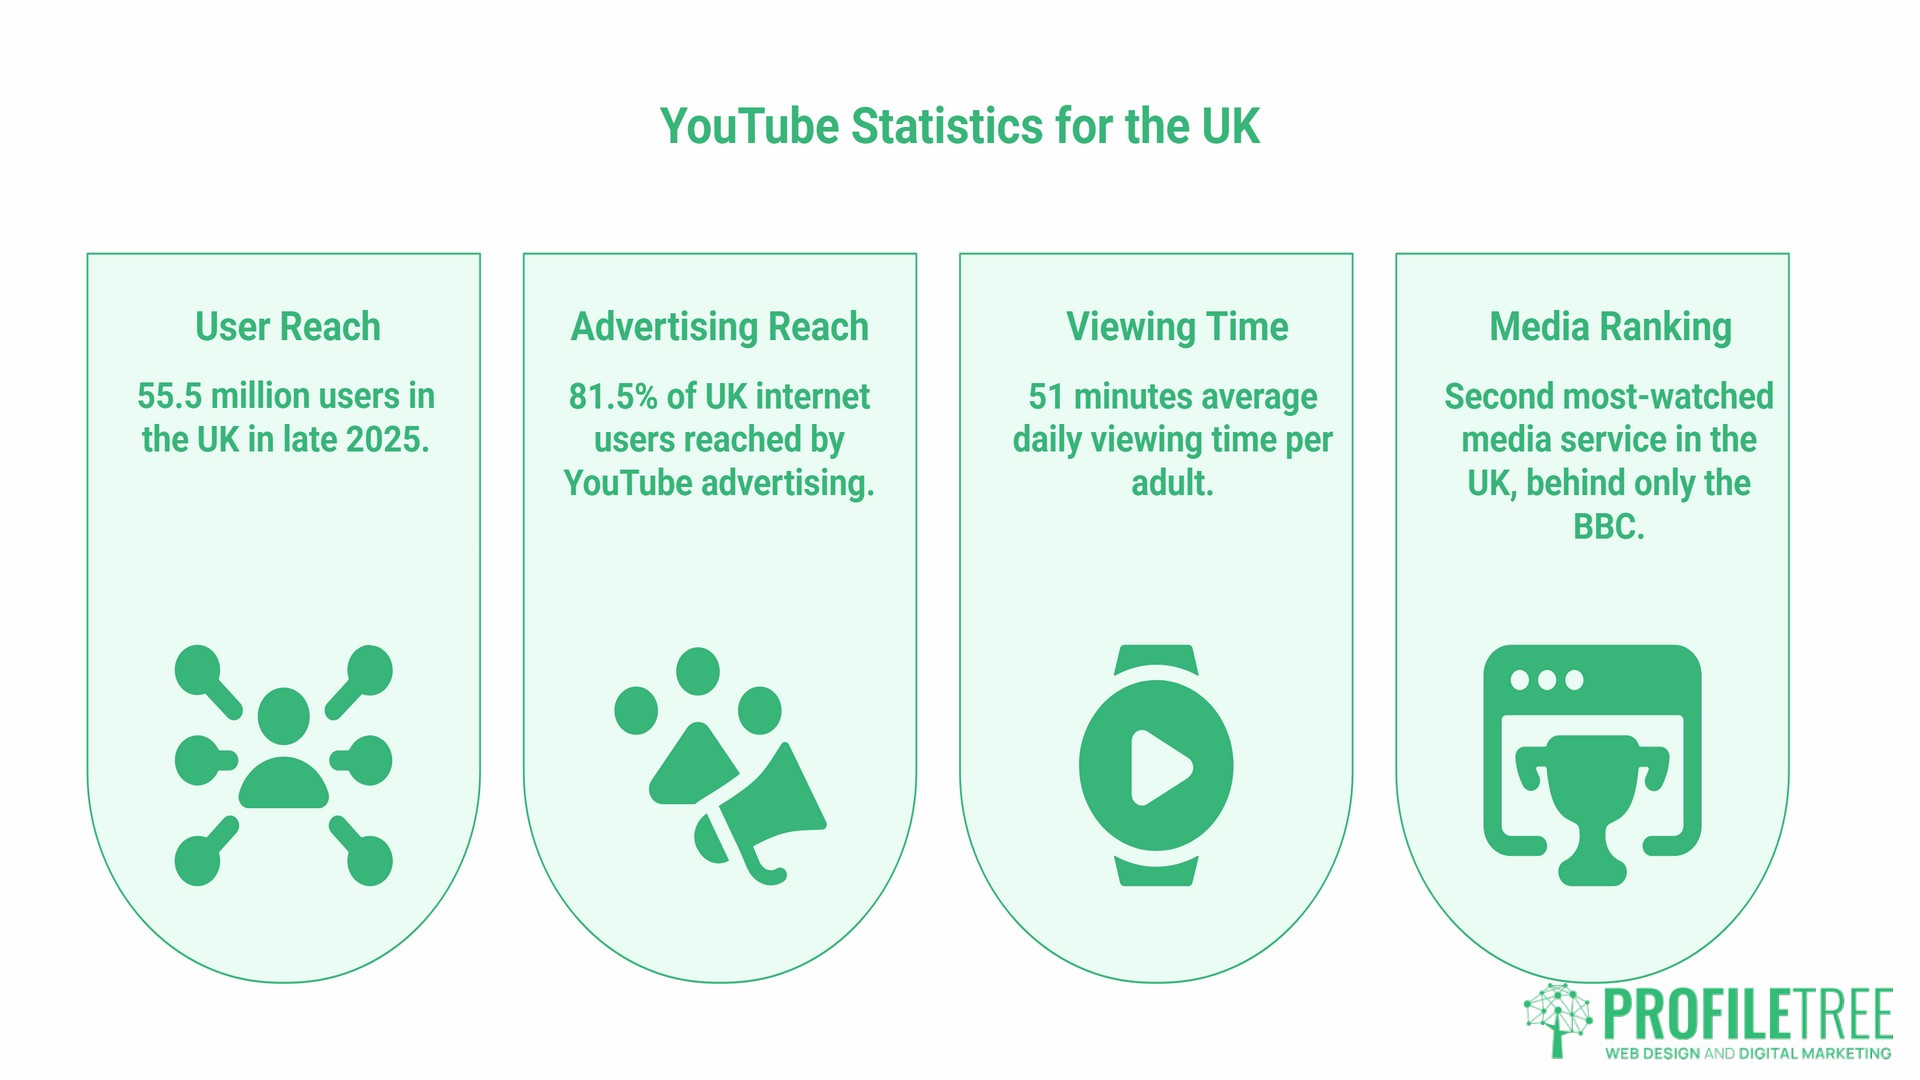
DataReportal’s Digital 2026 United Kingdom report puts YouTube’s advertising reach in the UK at 55.5 million users in late 2025, equivalent to 81.5% of the total UK internet user base. That penetration rate is higher than any other video platform in the country. It means YouTube is not a niche channel for younger demographics; it is a mainstream media environment that reaches the vast majority of UK adults your business might want to speak to.
According to DataReportal’s global analysis, the largest age cohort on YouTube is 25 to 34-year-olds, followed by 35 to 44-year-olds. The platform’s gender split in the UK was almost exactly even in 2025, with 50.1% male and 49.9% female users (The Global Statistics, citing DataReportal data). For professional services, accountancy, legal, or trades businesses in Northern Ireland, that breadth of demographic reach matters: your potential clients are on YouTube across every age group from their twenties onwards.
Ofcom’s Media Nations 2025 report recorded YouTube as the second-most-watched media service in the UK, behind only the BBC, with UK adults spending an average of 51 minutes daily watching YouTube content. For businesses publishing video, those are 51 minutes per day of potential audience attention that no other single video channel comes close to matching.
YouTube Statistics for the UK, at a glance:
- 55.5 million users in the UK in late 2025 (DataReportal, Digital 2026 United Kingdom)
- 81.5% of UK internet users reached by YouTube advertising (DataReportal, 2025)
- 51 minutes average daily viewing time per adult (Ofcom, Media Nations 2025)
- Second most-watched media service in the UK, behind only the BBC (Ofcom, Media Nations 2025)
YouTube Shorts Statistics: Short-Form Video and What It Means for SMEs
YouTube Shorts crossed 200 billion daily views in June 2025, a figure confirmed by YouTube CEO Neal Mohan at the Cannes Lions International Festival of Creativity. That represents a roughly 186% increase from the 70 billion daily views reported in March 2024 (Alphabet Q1 2024 earnings). These Shorts youtube statistics signal an algorithm that actively rewards short-form content from business channels, not just creators.
More than 2 billion signed-in users watch Shorts every month (YouTube, 2023; the most recently published official figure). The platform now has more than 10 million channels publishing Shorts daily, as confirmed by Alphabet CEO Sundar Pichai on the Q1 2026 earnings call.
For SMEs, the practical case for Shorts is straightforward. A single filming session that produces one long-form explainer video can also produce four to six Shorts from the same footage: a key tip extracted, a question answered, a before-and-after moment shown. The incremental cost of that additional content is low.
ProfileTree has covered the short-form versus long-form decision in detail for businesses working through their video strategy. If you are weighing up where to start, our guide to short-form vs long-form video for YouTube growth works through the trade-offs by business type and budget.
The relationship between Shorts and long-form content works in both directions. Shorts that perform well bring viewers to a channel, who then watch longer videos. Longer videos that rank in search bring subscribers who then engage with Shorts. Building both formats into a channel strategy, rather than choosing one, produces compounding growth over time.
| Content Type | Optimal Length | Primary Metric | Best Use |
|---|---|---|---|
| YouTube Shorts | Under 60 seconds | Completion rate | Brand awareness, quick tips |
| Tutorial videos | 7 to 15 minutes | Watch time | SEO, expertise demonstration |
| Product demos | 2 to 5 minutes | Click-through to website | Consideration stage |
| Webinars / live | 30 to 90 minutes | Engagement, Q&A | B2B lead nurturing |
YouTube Marketing Statistics: ROI and Business Performance
These are the YouTube marketing statistics that tend to appear in boardroom presentations, and for good reason. The figures below are drawn from published research and represent the strongest available evidence for video’s commercial impact.
Wyzowl’s State of Video Marketing 2026 report, based on a survey of 266 respondents conducted in late 2025, found that 85% of video marketers say video has helped them generate leads, and 83% say video has directly increased sales. The same report found 91% of businesses use video as a marketing tool, matching the all-time high recorded in 2023.
Landing pages that include video convert at rates up to 80% higher than those without. This figure is widely cited in multiple published studies and has been consistently replicated since it was first reported by EyeView Digital.
B2B companies using video marketing grow revenue 49% faster than those without a video strategy (Aberdeen Group, The Impact of Video Marketing). This finding dates back to Aberdeen Group’s benchmark research and has been confirmed by subsequent industry studies; the directional pattern remains consistent even when precise percentages vary.
The search visibility case for video is also strong. Pages with embedded video are 53 times more likely to appear on Google’s first page than pages without video (Forrester Research). This reflects the relative scarcity of competition for video results compared to text pages across the same queries. A business investing in SEO services alongside video production gains two distinct search channels from a single piece of content.
Video marketing performance benchmarks:
- 85% of video marketers say video has helped them generate leads (Wyzowl, State of Video Marketing 2026)
- 83% of video marketers say video has directly increased sales (Wyzowl, State of Video Marketing 2026)
- Landing page conversion uplift of up to 80% with embedded video (EyeView Digital)
- 49% faster revenue growth for B2B companies with video strategies (Aberdeen Group)
- Pages with video are 53 times more likely to appear on Google’s first page (Forrester Research)
YouTube for B2B: Statistics That Matter for Lead Generation
Most YouTube statistics articles focus on B2C use cases: product demonstrations, consumer brands, influencer content. B2B YouTube statistics are less covered but arguably more commercially significant for professional service businesses in Northern Ireland and Ireland.
Decision-makers watch the video. According to Google’s published research, 70% of B2B buyers and researchers watch video content during their purchasing journey (Google, 2025). A further 96% of B2B buyers say video is an important factor when deciding whether to move forward with a vendor (Brightcove, 2024).
The content they watch skews toward problem-solving: how-to videos, case-study walkthroughs, and expert explanations of complex topics. For a professional services firm, an accountancy practice, or a manufacturing business, this means YouTube is a viable lead generation channel, provided the content is structured around the questions your prospects are actually searching for rather than the content you find easiest to produce.
The length and format that work in B2B differ from those in consumer content. Longer videos, between 10 and 20 minutes, perform better for high-consideration purchases because they allow forthe depth of explanation that builds confidence. Short testimonial clips and process explainers perform well at the consideration stage, when a prospect is comparing options.
ProfileTree’s video marketing services include B2B content strategy as a distinct offering, covering both the creative production side and the channel optimisation work that determines whether well-made content actually gets found.
Turning YouTube Statistics into a Video Strategy
Data without application is interesting but not useful. This section takes the most useful YouTube statistics from the sections above and maps them to specific decisions an SME needs to make. Treating YouTube statistics as decision inputs rather than trivia is what separates channels that grow from those that stall.
- The mobile viewing majority dictates production decisions. If the majority of your audience is watching on a phone, your editing approach needs to account for it. Text overlays must be large enough to read on a 6-inch screen. If your video relies on fine visual detail, such as a spreadsheet walkthrough or technical diagram, the framing needs to be tight enough to make that detail legible. Captions are not optional: a significant proportion of mobile viewers watch without sound, particularly during evening viewing hours.
- The completion rate signal dictates video length. YouTube’s algorithm distributes content partly based on how much of a video people watch. A ten-minute video where viewers leave at three minutes sends a negative signal. A four-minute video where viewers watch to the end sends a positive message. Start with shorter videos, use your Analytics retention graph to identify exactly where viewers drop off, and then adjust.
- The reality of search engines dictates keyword research. YouTube search is a separate exercise from Google keyword research, though the two overlap. Search terms on YouTube tend to be more instructional: “how to”, “what is”, “why does”. Optimising video titles, descriptions, and chapter markers for these terms is the YouTube equivalent of on-page SEO.
- The YouTube lead-generation statistics justify production investment. Amateur production undermines credibility in ways that are hard to recover from. A viewer who forms a negative impression of a business based on poor audio or lighting is unlikely to revisit that judgment. Professional video production removes that barrier and reflects the quality of the service behind it.
“The businesses I see succeeding on YouTube are not the ones chasing views,” says Ciaran Connolly, founder of ProfileTree. “They are the ones who understand exactly who they are making videos for and what question that person needs answered. A plumber in Belfast who makes a clear, well-filmed video explaining the five signs your boiler needs replacing will generate more enquiries from that one video than a brand that produces a glossy promotional reel and waits for it to go viral.”
YouTube Channel Analytics: Understanding Your Own Statistics
Once a channel is active, the most important YouTube statistics are your own. YouTube Analytics provides enough data to make meaningful decisions about content direction, posting frequency, and format mix. The challenge for most SME owners is knowing which numbers to focus on.
- Watch time is the metric with the most weight in YouTube’s distribution algorithm. Total watch time across your channel matters, and average view duration for individual videos matters. Both should trend upward over time.
- Click-through rate (CTR) measures the percentage of people who see your video as a thumbnail and choose to click. A CTR below 2% generally indicates a thumbnail or title problem rather than a content problem. Custom thumbnails, tested iteratively, consistently outperform automatically generated ones.
- Audience retention shows you, second by second, where viewers drop off in your video. The first 30 seconds is where most drop-off occurs. If your opening does not establish quickly what the viewer will get from watching, they leave. This is the area where most amateur business channels lose ground.
- Traffic sources show you how people are finding your videos: YouTube search, suggested videos, direct links, or external sources. A channel with strong search traffic is more durable than one dependent on suggested content, which is subject to algorithm changes.
If reading YouTube Analytics feels like learning a new language, ProfileTree’s digital training services cover channel analytics as part of broader video marketing training programmes designed for business owners with no prior platform experience.
How to Start: The Practical First Steps
Starting a YouTube channel is one of those tasks that benefits from doing it properly once rather than redoing it after six months of modest results. Our beginner’s guide to creating a YouTube channel covers the setup process in full.
The YouTube statistics in this guide point toward a few consistent principles that should shape your approach from day one.
- Start with a search. Identify the questions your ideal clients are typing into YouTube’s search bar. Build your first five to ten videos around those specific queries. This approach generates search traffic from the outset rather than relying on subscribers you have not yet earned.
- Publish consistently rather than heavily. A channel that publishes one video per week for twelve months outperforms a channel that publishes twenty videos in one month and then goes quiet. Consistency builds subscriber habit and sends positive signals to the algorithm.
- Treat the first five seconds as the most important part of every video. YouTube statistics on retention consistently show that the opening moments determine whether a viewer stays or leaves. State clearly what the video is about and why it is worth watching. Do not start with a logo animation.
- Invest in audio before you invest in camera equipment. Poor audio is the single production quality issue that causes most viewers to abandon a video. A decent external microphone costs less than a new camera and makes a greater difference to watchability.
You can also read more about the rise of short-form video to understand how platform behaviour is shifting and how to position your content accordingly.
Working with ProfileTree on Video Strategy
ProfileTree is a Belfast-based digital agency working with SMEs across Northern Ireland, Ireland, and the UK. The team delivers video production, YouTube marketing strategy, SEO, and digital training as connected services rather than isolated offerings.
The link between the YouTube statistics in this guide and real business outcomes depends on execution. Understanding that the majority of views happen on mobile is one thing; having a production setup and editing approach that accounts for it is another. If you would like to talk through what a video strategy looks like for your specific business, you can get in touch with the team here.
Frequently Asked Questions About YouTube Statistics
How many people use YouTube in the UK?
DataReportal’s Digital 2026 United Kingdom report puts YouTube’s reach at 55.5 million users in the UK in late 2025, equivalent to 81.5% of the total UK internet user base. Ofcom’s Media Nations 2025 report records YouTube as the second most-watched media service in the UK, behind only the BBC.
Is YouTube Shorts better than TikTok for SMEs?
The two platforms serve different purposes and different audiences. TikTok skews younger and drives discovery for new audiences who were not already looking for your content. YouTube Shorts sit within an ecosystem where viewers already have buying intent, particularly when they arrive via search. For SMEs in professional services, trades, or B2B, YouTube Shorts tend to produce more commercially useful engagement. For consumer brands targeting under-30s, TikTok may offer stronger reach. The best approach for most SMEs is to cross-post the same content to both rather than choosing between them.
What is the average ROI for YouTube advertising?
A Nielsen marketing mix model meta-analysis commissioned by Google, covering 53,153 campaigns over 104 weeks, found that Google AI-powered video campaigns on YouTube deliver 17% higher return on ad spend than manual campaigns (Nielsen/Google, 2024). ROI varies significantly by sector, campaign structure, and landing page quality. The more relevant metric for most SMEs is cost per qualified lead rather than blended return on ad spend.
How often should a small business post on YouTube?
Consistency matters more than frequency. One video per week, published reliably, produces better long-term results than sporadic bursts. Most business channels that sustain growth over two or more years publish between one and two videos per week. Starting at a cadence you can maintain, even if that means one video per fortnight, is preferable to starting at an unsustainable pace and falling away.
Which age group uses YouTube the most in Ireland?
DataReportal data aligns Ireland’s demographic profile with the broader European picture: the 25 to 34 age group represents the largest cohort of YouTube users, followed closely by 35 to 44-year-olds. The platform’s gender split in the UK and Ireland is broadly even, meaning YouTube reaches male and female audiences in roughly equal proportions.
Does YouTube help with Google rankings?
Not directly, in the sense that having a YouTube channel does not automatically improve your website’s position in Google search. The indirect effects are meaningful. Pages with embedded video are 53 times more likely to appear on Google’s first page than pages without video (Forrester Research). YouTube videos also appear in Google search results for queries where Google judges that the video serves the searcher well, giving a well-optimised video the potential to rank in both YouTube and Google search simultaneously. Embedding videos on website pages also increases average time on page, which is a positive engagement signal.