
Twitter (X) Analytics: What Still Works Free
Table of Contents
AI Summary
Free Twitter analytics still exist, but the working list is much shorter than most published guides suggest. Per-post data remains free to every X account inside the mobile app, while account-level dashboards moved behind X Premium in June 2024. X then closed its self-serve API tiers in February 2026 and moved new developers onto pay-per-use billing, which removed the last free route for third-party tools to read X data at any scale.
The practical result is that free third-party tiers now schedule posts rather than report on them, and several tools that older articles still recommend have either closed, been absorbed, or quietly dropped X. This guide sets out what each free route gives you, checked against each provider’s own pricing or documentation in September 2026.
Most guides to free Twitter analytics were written before two separate rounds of change and have never been checked since. The first round, in 2023, closed the free API and took a large part of the third-party market with it. The second, in early 2026, removed the free developer tier altogether and pushed X Pro to the top subscription tier. Tools recommended in good faith three years ago are, in several cases, no longer at the address people remember.
This guide covers what native X analytics show without payment, which third-party free tiers genuinely connect to an X account today, what happened to the tools that disappeared, and how to link X activity to business results without buying a subscription. ProfileTree’s social media marketing team builds this kind of low-cost measurement routine for clients across Northern Ireland, Ireland and the UK, and most of it costs nothing to run.
Are Twitter Analytics Free Now?
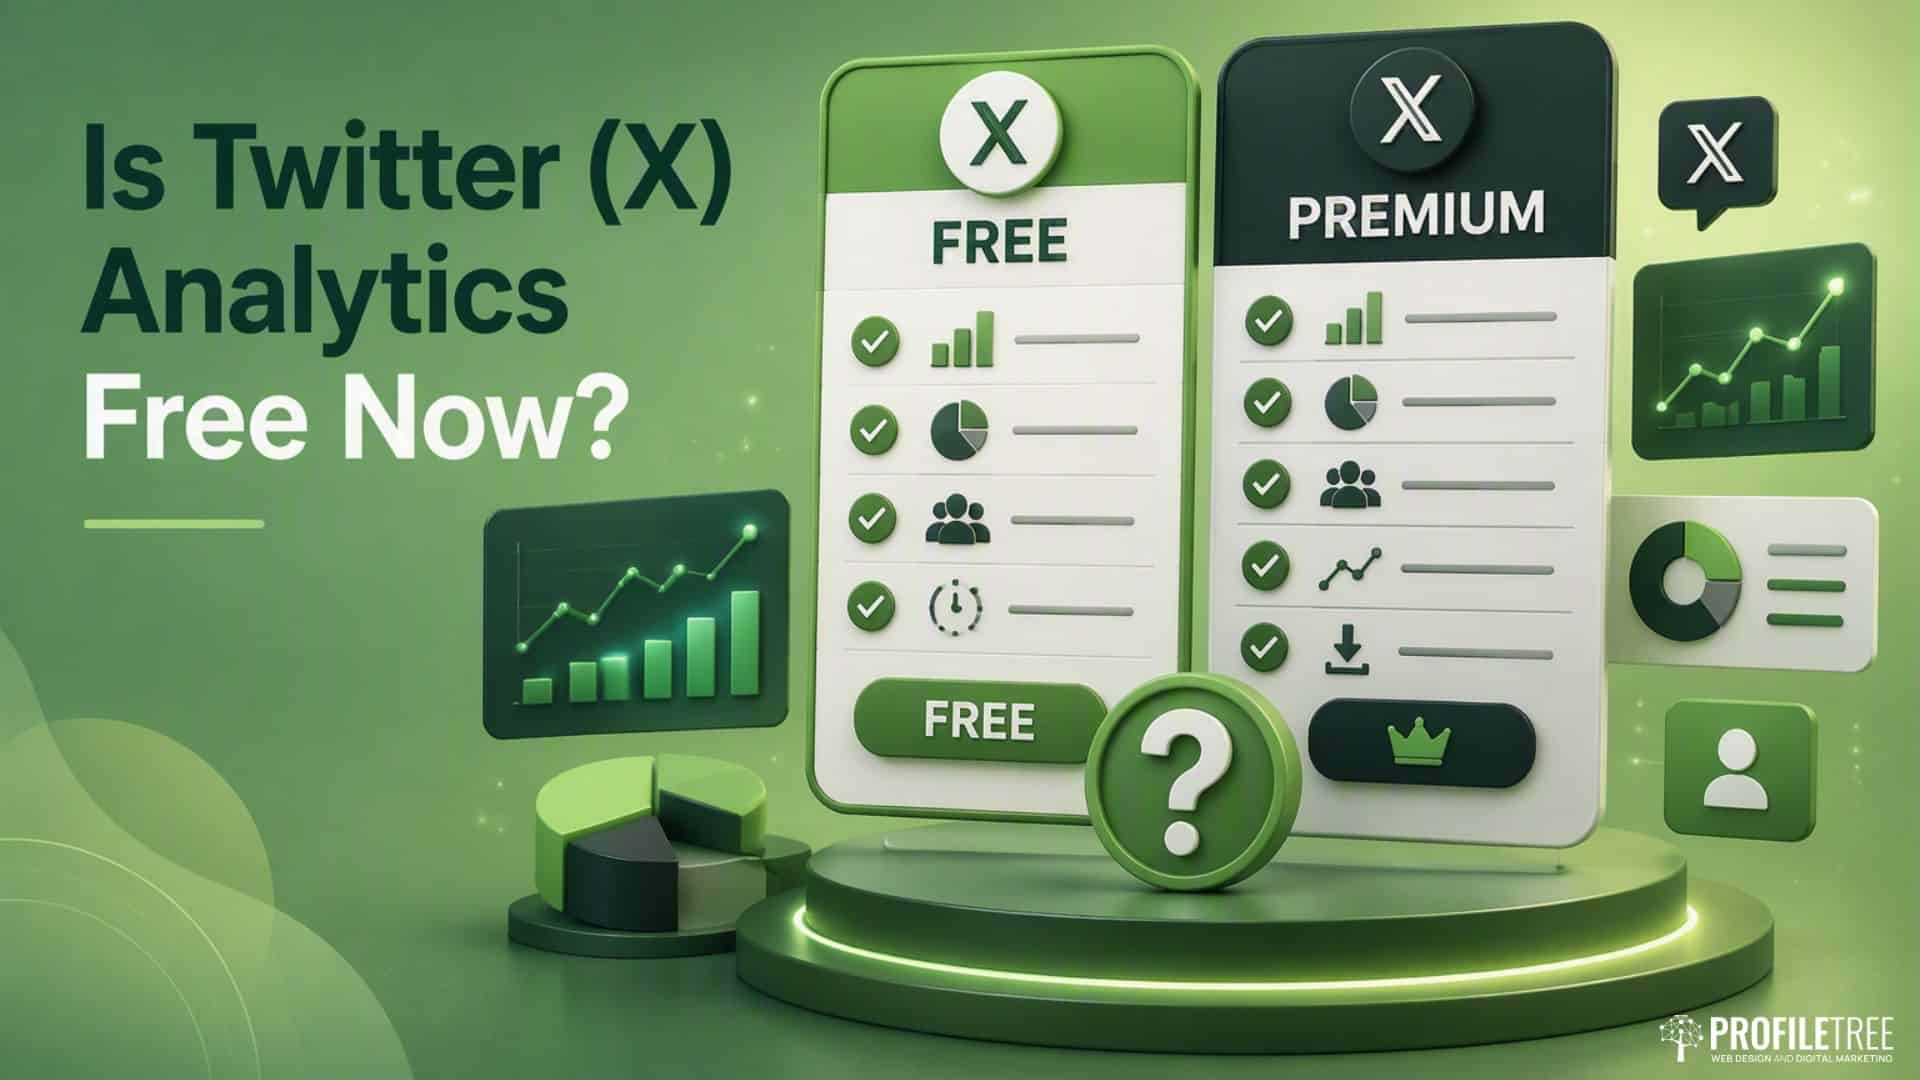
Partly. Post-level data stayed free, account-level data did not, and that single split decides whether you need to pay for anything at all.
| Access route | Cost | What you get | Best suited to |
|---|---|---|---|
| Native mobile app, per post | Free | Impressions, engagements, profile visits and link clicks for each published post, via the bar chart icon | Any account, and the only free route that works on all of them |
| Native account dashboard, desktop | X Premium | Account-wide impressions, engagement rate, top posts, audience and video tabs | Businesses already paying for Premium for other reasons |
| X Pro, formerly TweetDeck | X Premium+ | Multi-column monitoring, keyword streams, multiple accounts | Newsrooms and teams doing live monitoring all day |
| Your X data archive | Free | A downloadable copy of your own account data, requested from settings | Record keeping, not performance reporting |
| Third-party free tiers | Free, capped | Mostly scheduling and follower trends; reporting on X is usually paid | Businesses that want free publishing rather than free analytics |
For most small and medium businesses, the mobile app plus one free third-party tier covers the job. What money buys is historical depth, audience demographics and the convenience of not doing the arithmetic yourself.
What Did the X API Changes Actually Kill?
This is where most published advice goes wrong, and it now has two dates rather than one.
When X restricted its free API tier in early 2023 and repriced the paid tiers, a large part of the third-party analytics market closed within months. Then in February 2026, X replaced self-serve tiers with pay-per-use billing: new developers buy credits and pay per call, with no free tier to sign up for. Existing free-tier accounts were migrated across with a one-time credit, Basic subscribers were moved onto pay-per-use from June 2026, and the $5,000 Pro tier was deprecated in August 2026. A tool that wants to show you your X numbers now pays X for every read it makes on your behalf, which is why so few of them do it for nothing.
Here is the status of the tools most often recommended, checked against each provider’s own site in September 2026.
| Tool | Status | What changed |
|---|---|---|
| X native post analytics, mobile | Free and working | Per-post metrics stayed free for every account |
| X native account dashboard | Premium only | Account-wide analytics restricted to paid tiers from June 2024 |
| X Pro, formerly TweetDeck | Premium+ only | Free until August 2023, then Premium, then moved to the top tier on 26 March 2026 with no advance notice |
| Social Bearing | Closed | Announced in April 2023 that its free API access had been revoked and the service could not continue |
| MentionMapp | No longer available | The network visualisation tool is gone and the original address no longer serves it |
| Followerwonk | Absorbed | Acquired by Fedica; the follower search and comparison tools now run inside the Fedica dashboard |
| Twitonomy | Working, reduced | Still running with features suspended after the API restrictions; free use covers on-screen profile and follower analysis, while export sits on the paid tier |
| Buffer, free plan | Schedules X, does not report on it | X connects on the free plan, but Buffer’s own help centre states that X analytics need a paid plan |
| Metricool, free plan | X excluded | The free plan cannot connect X at all; X is a paid add-on on paid plans only |
| SocialDog, free plan | Working, narrow | Free tier gives two weeks of follower-count trends on X, and scheduling, but no post analytics |
| Tweet Binder, free report | Working, capped | One free report of up to 200 posts from the previous seven days |
Two entries deserve more than a table row, because they contradict what nearly every list still says.
TweetDeck is not free, and it is no longer cheap. It sat on the $8 Premium tier for over two years, then moved to Premium+ on 26 March 2026, reported by Engadget and MacRumors at $40 a month or $395 a year in the US, with pricing varying by region. Existing subscribers lost access mid-cycle without warning. X’s then head of product said a more powerful replacement would arrive within a week or two; no like-for-like free monitoring tool has appeared since, and he left the company in August 2026. If your social workflow assumes TweetDeck exists, it needs rebuilding, and our breakdown of what X Pro now costs and who it still suits goes through the options.
Social Bearing and MentionMapp are gone. Social Bearing shut down in April 2023 when its free API access was withdrawn. MentionMapp’s visualisation tool is no longer available at its former address. Any guide still recommending either was not checked before publication.
How Do You Check Twitter Analytics without X Premium?
Three routes remain, in order of how much they cost and how much work they take.
Option A: per-post analytics in the mobile app
Open the X app, find a post you published, and tap the small bar chart icon beneath it. That shows impressions, engagements, profile visits and link clicks for that post, free, on any account. It is slower than a dashboard when you want a month at a glance, and it is the most direct free route to real numbers.
This is also the honest answer to the common question about checking impressions without paying. There is no separate free impressions checker that works reliably. The app is the tool.
Option B: free third-party tiers that still connect to X
Only a handful of free plans still support X, and each has a real limit worth knowing before you spend twenty minutes signing up.
Buffer connects three channels on the free plan and holds ten queued posts per channel, with each slot freeing up once a post publishes. There is also a lifetime cap of eight unique channel connections on a free account. The catch sits in Buffer’s own help centre: X analytics are a paid-plan feature, and Buffer cannot pull sent-post data for X channels on the free plan. The same page notes that X does not report impressions or views through its API at all, so Buffer’s visibility chart is unavailable for X on any plan. Read Buffer as a good free scheduler for X, and not as free X reporting.
SocialDog is built around X specifically, and its free plan is narrower than most write-ups suggest. Its pricing page lists two social profiles, of which only one may be an X account, ten scheduled posts per profile, and an analytics window of two weeks. On X, that window covers follower-count trends only. Post analytics start on the paid tiers. As a free way to watch whether your follower count is moving and to keep a small queue running, it works.
Fedica is where the Followerwonk tools went, which matters if your old process depended on follower search or account comparison. Its free plan connects one account per platform with a combined follower ceiling, and it is a publishing tier rather than an analytics one: Fedica’s own X follower analysis page states plainly that follower analysis is not included on the free plan and starts on Grow. Worth knowing before you migrate a Followerwonk habit across.
Tweet Binder, now part of Audiense, gives one genuinely free report of up to 200 posts from the previous seven days, for a hashtag, keyword or account. That is enough to measure a small launch, an event hashtag or a week of brand mentions, and nowhere near enough for a long campaign or a historical trend. Used inside those limits it is one of the more useful free options left.
Twitonomy still runs, with one caveat that most guides get backwards. The one-click Excel export and the automated Followers Report are paid features. A free account gives you manual, on-screen profile analysis: posting habits, mentions, hashtags and follower lists you can read but not download. That suits a quick read on a single account before a pitch or a partnership.
A note on what is not free. Metricool is frequently listed as a free X analytics option and is not. Its free plan cannot connect X at all, and on paid plans X is a separate add-on. Metricool’s help centre puts the current add-on at €10 or $10 per month for each connected account, with accounts that had the add-on before July 2026 keeping the older €5 rate. Budget for the plan, the add-on and, in practice, an X Premium subscription on the account itself.
Option C: work it out yourself
For engagement rate you do not need a tool. Take a sample of recent posts, add up the engagements, and divide by impressions from the mobile app. That is the same calculation the native dashboard runs, it costs nothing, and you will know exactly how the number was produced. For a wider view across platforms, our guide to free social media analytics tools covers the equivalent routes on Facebook, Instagram and LinkedIn.
What Replaced the Free Tools that Closed?
Nothing replaced them like for like, and it is worth being straight about that rather than sending people hunting.
The free monitoring dashboard has no free successor. X Pro moved up a tier rather than being replaced, and the promised alternative has not appeared. Teams that ran keyword columns all day are now choosing between Premium+, a paid cross-platform tool, or a cruder routine of saved searches and notifications.
Follower research moved rather than died. The Followerwonk tools live inside Fedica, and the demographic and geographic breakdowns that made them useful sit on a paid tier there. Nothing free does that job now at the same depth.
Hashtag and campaign reporting survived in capped form. Tweet Binder’s free 200-post report is the closest free equivalent to what several closed tools used to offer, provided your question fits inside seven days.
Account-level history came back as a download rather than a dashboard. Requesting your X data archive from account settings gives you a free copy of your own posts, followers and account records. It is a file, not a report, and it will not hand you a clean impressions history, but it is yours and it costs nothing.
The pattern behind all of it is the same. Reading X data now costs money, so free tiers have drifted towards publishing, where the cost to the provider is much lower.
Which X Metrics Actually Matter to a Business?
The metrics worth acting on depend on what you use X for. A Belfast accountancy practice and a London e-commerce brand will not track the same things, and a few principles hold across both.
| Metric | What it tells you | How to use it |
|---|---|---|
| Impressions | How many times a post appeared on a screen | A high count with low engagement is a content problem, not a reach problem |
| Engagement rate | Whether content connects with the people seeing it | Track your own trend over months rather than chasing a published benchmark |
| Link clicks | How many people acted on something you posted | The metric tied most directly to traffic and leads |
| Profile visits | Whether a post prompted curiosity about the business | If visits rarely turn into follows, the profile may not explain what you do |
| Follower growth rate | Whether reach is genuinely building | More useful than total count; watch it month on month |
| Top mentions | Who amplifies your content | Identifies partners, press contacts and advocates worth talking to |
One caution on engagement rate. Published benchmarks vary wildly because sources use different denominators. X’s own dashboard divides engagements by impressions. Several industry reports divide interactions by follower count instead. Those two formulas produce very different numbers from identical activity, so check which one a benchmark used before you measure yourself against it, and write down the formula you picked so next quarter’s figure is comparable.
“The businesses that get value out of social measurement are the ones that pick two or three metrics tied to something commercial and then stop looking at the rest. Link clicks, and what happens after the click, will tell you more about whether X is worth your time than any follower number, and both are free to track,” says Ciaran Connolly, founder of ProfileTree.
Comparing impressions by post type, whether text, video, image or poll, is the fastest way to work out which format deserves repeating. Video tends to under-report its real value on a single-platform dashboard, because a clip’s reach usually extends well beyond X once it is reused elsewhere, which is why video production is generally planned across channels rather than for one feed.
How Do You Benchmark a Competitor’s X Account for Free?
Most guides either claim competitor tracking cannot be done without a login or push an enterprise listening platform. Neither is accurate, and the maths takes about ten minutes.
Take a sample of ten recent posts from the account. Add up the visible engagements, meaning likes, reposts and replies. Divide by the account’s follower count, then multiply by 100. That gives a rough engagement rate you can set beside your own, as long as you calculate yours the same way.
This will not give you impressions or click data, which stay private. It is enough to judge whether a rival’s following is genuinely engaged or inflated by follow-unfollow tactics, and it uses only what the account owner chose to make public. Where benchmarking feeds into a wider positioning decision, it belongs alongside a proper digital strategy review rather than sitting on its own.
How Do You Connect X Activity to Business Outcomes?
The question most businesses struggle with is what their posting is actually worth. The gap between a repost and a sale is real, and closing it takes three habits rather than a tool.
Tag every link you post. UTM parameters are short pieces of code added to a URL that tell Google Analytics where a visitor came from. A link posted on X should look like this:
https://yourdomain.co.uk/services/?utm_source=x&utm_medium=social&utm_campaign=spring-guide
Keep the naming consistent across every post, because inconsistent tags are worse than none.
Track which content drives traffic, not just engagement. Engagement and traffic do not always move together. A post with forty likes and no link clicks is entertaining an audience rather than building a pipeline. Over three or four weeks, compare engagement rate against link click rate by content type, then put your effort behind whatever moves people to the site.
Look at what X visitors do after they arrive. Once tagging is in place, check whether they bounce, browse or convert. This is where search engine optimisation and social work overlap. A page that ranks well but converts social traffic badly usually has a landing page problem rather than a channel problem, and that is a website design fix rather than a social media one.
Which Numbers Are Safe to Ignore?
Four metrics cause more confusion than they are worth.
Total follower count. A large following with low engagement often points to follow-unfollow tactics or dormant accounts. A smaller, engaged audience in the right sector produces more business.
Total impressions without context. Impressions count how many times a post appeared on a screen, not whether anyone read it or acted on it. They include your own views of your own posts.
Likes. A like takes the least effort of any interaction and carries the least commercial signal. An account generating steady replies and link clicks at lower volume is performing better in any sense that matters.
Viral moments. A post that travels outside your target audience can distort a month’s figures without producing a single enquiry. Look at who engaged, not only how many.
What Does a Simple Monthly Review Look Like?
Analytics only create value if something changes as a result. A monthly review does not need to be elaborate.
- Pull your top ten posts by link clicks, not likes or impressions, and look for a shared format or topic.
- Check follower growth month on month. Steady, flat, or falling after a specific event?
- Review website traffic from X in Google Analytics. Are those visitors staying or bouncing?
- Look at your top mentions. Are the accounts amplifying you the ones you want?
- Compare this month with last. Name one thing that worked, one that did not, and one change to test next month.
That loop takes under an hour. Teams that want it built into a wider reporting rhythm, or want staff able to run it without one person holding all the knowledge, usually fold it into a digital training session.
What Are the UK GDPR Rules on Exporting X Data?
If you export follower lists, collect public handles into a marketing database, or pull audience data through a third-party tool, that activity falls under UK GDPR the moment it involves identifiable people. This is the gap in almost all Twitter analytics guidance, and it matters for any UK or Irish business building a prospect list from public profiles.
The Information Commissioner’s Office has been clear that publicly accessible does not mean freely usable. Its joint statement on data scraping with other data protection authorities sets out that publicly available personal information remains subject to data protection law, and that the people who collect it carry responsibilities for what they do with it.
Before exporting a follower list or a competitor’s audience data, confirm three things: why you need the data, how long you will keep it, and whether you can delete it on request. If any of those has no answer yet, do not export. Legitimate interests will usually cover straightforward benchmarking, and it still requires you to have thought it through and written it down.
When Does Paying for Analytics Start to Make Sense?
Free routes cover most of what a small or medium business needs. Paid tools earn their cost in four situations: managing several accounts that need unified reporting, benchmarking against named rivals at scale, running paid campaigns on X where attribution has to be granular, and sending automated reports to people who will never log into a dashboard.
There is a calculation worth running first. X Premium unlocks the native dashboard for one platform. A single cross-platform subscription often covers more ground for similar money, and if X is one channel among several, that usually wins. Pay X directly when X is the channel, not when it is one of five.
Where Should You Start this Week?
If you take one thing from this guide, make it this: check whether the tools in your current process still exist before you plan another quarter around them. A surprising number of businesses are working from a documented workflow that names two or three products which closed in 2023.
Start with the mobile app for post data. Add one free third-party tier if you want a cleaner view, chosen for what it actually does rather than what a list claimed. Tag every link you post. Run the five-step review once a month. That covers measurement for most SMEs at no cost. Add paid tools when the reporting burden becomes the constraint, not before.
FAQs
What is the most useful free Twitter analytics option for a small business?
Start with the native mobile app, which costs nothing and covers per-post metrics properly. Add Buffer’s free plan if you want scheduling across three channels, remembering that its X reporting needs a paid Buffer plan. Tweet Binder’s free report is worth keeping in reserve for a specific hashtag or launch week. Between those, most small businesses can make decisions without spending anything.
Are Twitter analytics completely free on mobile?
Per-post metrics are. Tap the bar chart icon beneath any published post to see impressions, engagements, profile visits and link clicks. The account-level dashboard, which aggregates trends and ranks your top posts, requires X Premium and is only available on desktop.
How do I check my Twitter analytics without X Premium?
Use the mobile app’s per-post icon for free data, then calculate engagement rate yourself by dividing engagements by impressions. Free third-party plans will not fill the gap the way older guides suggest: Buffer’s X analytics need a paid plan, SocialDog’s free tier shows two weeks of follower trends only, and Fedica’s free plan does not include X follower analysis. The manual route is the one that works on every account.
Is TweetDeck still free?
No. TweetDeck became X Pro and moved behind X Premium in August 2023, then moved again on 26 March 2026 to the higher Premium+ tier, reported at $40 a month or $395 a year in the US. Existing Premium subscribers lost access without notice. Any guide still describing it as a free monitoring tool has not been checked since.
I keep finding tools that claim to be free and then ask for a subscription. Which ones actually work?
That frustration is reasonable, because “free” gets used loosely for free trials, free scheduling and free plans that exclude X entirely. As of September 2026, the routes that genuinely cost nothing are X’s own per-post mobile analytics, your X data archive, Tweet Binder’s 200-post seven-day report, and follower-trend views on free scheduler tiers such as SocialDog. Everything else in the category is either a trial, a paid tier, or a free plan that does not connect X.
What happened to Followerwonk, Social Bearing and Twitonomy?
Social Bearing closed in April 2023 after its free API access was revoked. Followerwonk was acquired by Fedica and its tools now run inside the Fedica dashboard rather than as a standalone product, with the demographic features on a paid tier. Twitonomy still operates with reduced functionality; its free tier covers on-screen profile and follower analysis, while the automated Followers Report and Excel export are paid.
Why did so many free Twitter analytics tools disappear at once?
Because the data stopped being free to fetch. X restricted its free API tier in early 2023, then in February 2026 replaced self-serve tiers with pay-per-use billing, so new developers pay per call with no free allowance. A tool showing your X numbers is paying X for every read, which is why free tiers across the category now offer publishing rather than reporting.
Can you tell me whether it is worth paying for X Premium just to see my own analytics?
It depends on whether the dashboard saves you enough time to justify the cost. If you post a few times a week, the free per-post view plus a monthly spreadsheet gives you the same information for nothing. If you post daily across several accounts and report to someone else, the subscription usually pays for itself in time saved, though a cross-platform tool often covers more ground for similar money.
Is it legal to export a competitor’s follower list in the UK?
Exporting data about identifiable people brings UK GDPR into play, whether or not the profiles are public. You need a lawful basis, usually legitimate interests for straightforward benchmarking, a defined retention period, and the ability to delete someone’s data on request. Reading public numbers on screen to calculate an engagement rate carries far less risk than downloading and storing a list of named individuals.