What Is GTmetrix? A Practical Guide to Reading and Acting on Your Results
Table of Contents
GTmetrix is a free web performance testing tool that analyses how quickly your site loads, scores it against Google’s Lighthouse metrics, and tells you exactly what to fix. For web agencies, developers, and business owners across the UK and Ireland, it has become one of the most-used tools in the technical toolkit — not because it produces a neat letter grade, but because it breaks down performance into actionable problems with clear guidance on how to solve them.
If you’ve run a test and come away confused by terms like LCP, TBT, waterfall charts, or Structure scores, this guide covers what each one means, how to configure your tests correctly, and how to turn your results into a practical improvement plan.
What GTmetrix Actually Measures
GTmetrix runs your URL through Google Lighthouse and its own set of custom audits, then presents the results across two separate scoring systems. Understanding the difference between them is the most important thing to grasp before you do anything else with the tool.
Performance Score vs. Structure Score
The Performance score is your Google Lighthouse score, pulled directly from Lighthouse performance data. It reflects how well the page performs against the same metrics Google uses in its own PageSpeed Insights tool. A strong Performance score correlates with good Core Web Vitals.
The Structure score is GTmetrix’s proprietary assessment. It draws on Lighthouse audits and GTmetrix’s own custom checks to evaluate how the page is built. Two pages with identical Performance scores can have very different Structure scores depending on factors like image compression, caching headers, and third-party script handling.
Core Web Vitals: The Three Metrics That Matter Most
GTmetrix highlights three Core Web Vitals at the top of every report:
Largest Contentful Paint (LCP) measures how long it takes for the largest visible element — usually a hero image or heading block — to load. Google’s threshold for a “good” LCP is under 2.5 seconds. For most UK-hosted sites running a standard WordPress theme with unoptimised images, LCP is the metric that fails first.
Total Blocking Time (TBT) measures how long the main thread is blocked while the page loads, preventing users from interacting with it. It’s the Lighthouse proxy for First Input Delay (FID). A TBT above 200ms is a red flag; above 600ms is a serious problem, usually caused by heavy JavaScript execution.
Cumulative Layout Shift (CLS) measures visual stability — how much the page content shifts around as elements load in. A score above 0.1 is a pass; above 0.25 is a fail. CLS issues commonly come from images without declared dimensions, dynamically injected content, or web fonts loading late.
“When we audit client sites at ProfileTree, LCP failures are consistently the most common issue we encounter,” says Ciaran Connolly, founder of ProfileTree. “Nine times out of ten it comes down to unoptimised hero images, slow server response times, or render-blocking scripts — all of which are fixable once you know where to look.”
How to Set Up Your GTmetrix Test Correctly
Running a test from the wrong location produces misleading results. GTmetrix defaults to a Vancouver, Canada server, which will add significant latency to any UK or Ireland-hosted site and make your TTFB look far worse than it is for your actual users.
Choosing the Right Test Location
For businesses targeting UK and Irish audiences, always switch the test location to London, UK, before running your analysis. This means your Time to First Byte (TTFB) reflects the real-world experience of visitors from Belfast, Dublin, Manchester, or London — not someone accessing your site from North America.
You can change the server location by clicking “Analysis Options” on the GTmetrix homepage before pasting your URL. Free account users can select from seven global locations, including London, Sydney, São Paulo, Mumbai, Hong Kong, and San Antonio, alongside the default Vancouver option.
Test Multiple Pages, Not Just Your Homepage
Your homepage is not representative of your site’s performance. A product page loaded with images, a blog post pulling in heavy embeds, or a WooCommerce checkout with multiple payment scripts will often perform significantly worse than a clean homepage. Run tests on:
- Your highest-traffic landing pages (check Google Search Console for these)
- Any page that drives enquiries or conversions
- Your most image-heavy content pages
- Pages where you’ve had complaints about load speed
Run the Test More Than Once
Server load, CDN caching state, and network conditions all affect GTmetrix results. A single test can return an outlier score if it catches your server mid-request spike or before your CDN has cached the page. Run three tests and work from the average rather than the single highest score.
Reading the GTmetrix Report: Tab by Tab
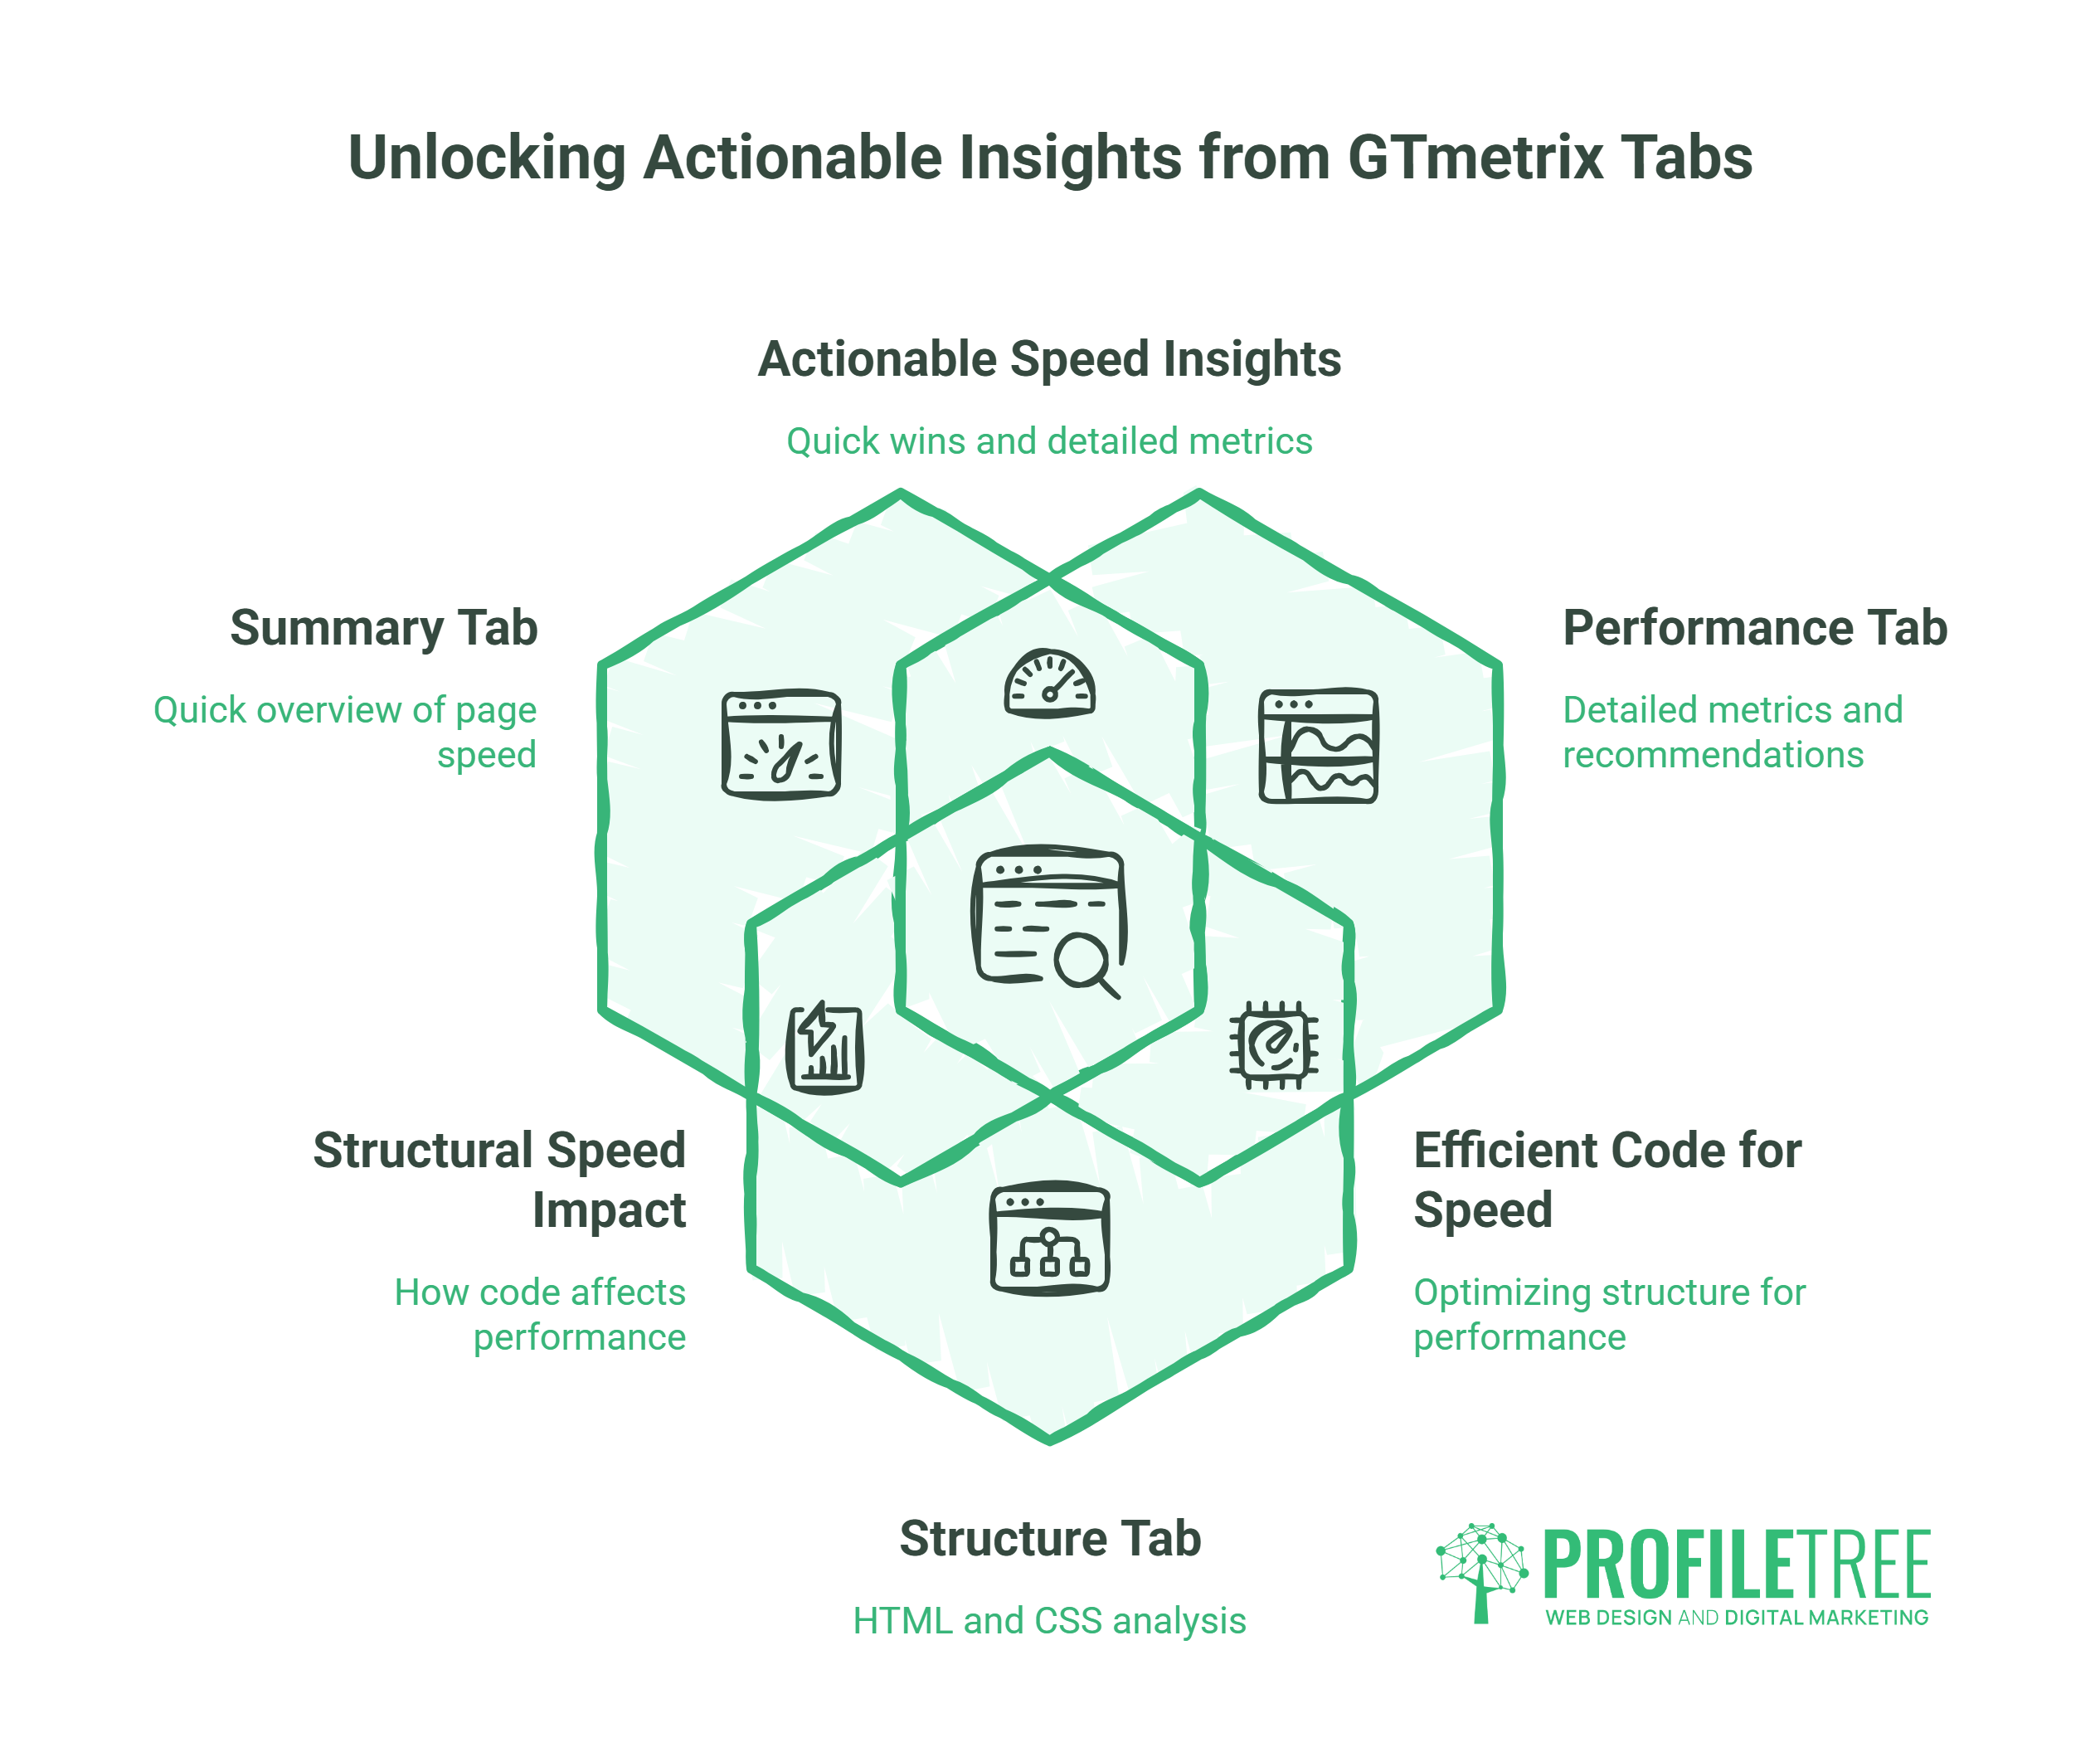
Once your test completes, you land on the main report page. The six tabs — Summary, Performance, Structure, Waterfall, Video, and History — each give you a different view of the same page load. Most people only look at the Summary tab and miss the most actionable data.
Summary Tab
The Summary tab gives you Speed Visualisation — a timeline showing when key events fire as the page loads — alongside your Top Issues list. The Top Issues section is where GTmetrix surfaces the audits with the biggest impact on your score. These are your starting points for any optimisation work.
Pay attention to the “Page Details” section at the bottom of the Summary tab. Total page size and the number of HTTP requests both affect load times. A page making 150+ HTTP requests or weighing over 3MB is a strong signal that there’s unnecessary bulk to remove.
Performance Tab
The Performance tab expands on the Web Vitals data with additional Lighthouse metrics: First Contentful Paint (FCP), Speed Index (SI), and Time to Interactive (TTI). Toggle on “Metrics Details” at the right of the metrics bar to see a deeper breakdown of how each metric is calculated and what’s contributing to a low score.
This tab also shows Browser Timing data — DOMContentLoaded and fully loaded times — which are useful for diagnosing server-side delays separate from client-side rendering issues.
Structure Tab
The Structure tab is the most actionable part of the GTmetrix report for most sites. It lists every audit GTmetrix runs against your page with a pass, warning, or fail status and an impact rating. Think of it as a prioritised punch list for your developer.
Common Structure failures on UK business sites include:
- Serve static assets with an efficient cache policy — assets like images and scripts aren’t being cached, so repeat visitors reload everything from scratch
- Properly size images — images are being served at dimensions larger than they’re displayed, wasting bandwidth
- Eliminate render-blocking resources — CSS or JavaScript files are loading before the page content, delaying FCP
- Enable Keep-Alive — the server closes HTTP connections between requests instead of reusing them, adding round-trip overhead
Waterfall Tab
The Waterfall tab is where experienced developers spend most of their time. It shows every resource your page loads — HTML, CSS, JavaScript, images, fonts, third-party scripts — as horizontal bars on a timeline, colour-coded by request phase.
Reading a waterfall chart:
- DNS lookup (teal): time spent resolving the domain
- Connect (orange): establishing the TCP connection
- SSL (pink): TLS handshake time for HTTPS
- Send (green): time sending the request
- Wait (TTFB) (yellow): time waiting for the first byte of the response — this is your server response time
- Receive (blue): time downloading the response body
A waterfall with a very long yellow bar on the first HTML request points to a slow server or unoptimised PHP execution. A long horizontal gap where nothing loads often indicates a render-blocking script preventing subsequent assets from downloading in parallel. Hover over any row in the waterfall to see a full breakdown of its load phases.
Video Tab
The Video tab records the visual rendering of your page as a video so you can see exactly what users see during the load sequence. This is particularly useful for identifying CLS issues — you can watch layout shifts happen in real time — and for sharing with non-technical clients or stakeholders who struggle to interpret raw data.
History Tab
The History tab plots your GTmetrix results over time. Once you start running regular tests (or use the monitoring feature), this becomes your most important performance management view. A sudden drop in Performance score after a deployment is immediately visible here, making it far easier to correlate performance regressions with specific site changes.
Fixing Common GTmetrix Issues
Understanding the report is only half the job. The Structure tab’s audit recommendations map directly to specific actions, and most of them can be addressed without custom development.
Image Optimisation
Oversized images are the single most common GTmetrix issue on WordPress business sites. If GTmetrix flags “Properly size images” or “Serve images in next-gen formats,” the fix usually involves converting images to WebP format and ensuring they’re served at the correct display dimensions. Plugins like ShortPixel or Imagify handle this automatically on upload.
For image lazy loading — which defers offscreen images until they’re needed — WordPress 5.5 and above handles this natively, but some themes and builders override the default behaviour. Check your Structure tab to confirm lazy loading is active on images below the fold.
Server Response Time (TTFB)
A TTFB above 600ms on the London test node usually points to one of three causes: shared hosting under load, slow database queries on a WordPress site (common on sites with large post databases and no object caching), or a PHP execution bottleneck. For ProfileTree clients, WordPress hosting with object caching and server-side optimisation typically cuts TTFB from 800ms–1.2s down to under 200ms.
Render-Blocking Resources
If GTmetrix flags render-blocking CSS or JavaScript, the page is loading scripts in the <head> that delay the browser from rendering any visible content. The fix involves deferring non-critical JavaScript (moving it to load after the main content) and inlining critical CSS. In WordPress, plugins like WP Rocket and Perfmatters provide UI controls for this without touching code directly.
Caching
“Serve static assets with an efficient cache policy” means your server isn’t sending the right headers to tell browsers to store copies of your CSS, JS, and images locally. For Apache servers, this is a .htaccess configuration change; for Nginx, a change to the server config. On managed WordPress hosting, this is usually handled at the server level.
GTmetrix vs. Google PageSpeed Insights: Which Should You Use?
Both tools use Google Lighthouse under the hood, but they behave differently and often return different scores for the same URL. Understanding why helps you interpret results more accurately.
| GTmetrix | Google PageSpeed Insights | |
|---|---|---|
| Data source | Lighthouse (controlled lab) | Lab data + Chrome UX Report (real users) |
| Test location | Configurable (London for UK) | Google’s infrastructure |
| Mobile emulation | Desktop default; mobile on paid plans | Both desktop and mobile by default |
| Core Web Vitals | Lab-measured proxies (TBT instead of FID) | Real-world field data where available |
| Historical data | Yes (with account) | No |
| Waterfall chart | Yes | No |
The key difference is that PageSpeed Insights can show you field data from the Chrome User Experience Report (CrUX) — real measurements from actual Chrome users visiting your site. GTmetrix only shows lab data from a controlled test environment. For understanding what Google actually sees, PageSpeed Insights’ field data is more authoritative. For diagnosing specific problems and tracking changes over time, GTmetrix’s waterfall and history features make it a better diagnostic tool.
Use both. Run GTmetrix from the London node to diagnose problems and track improvements. Check PageSpeed Insights to see what Google’s field data says about your actual user experience.
The GTmetrix Grade Paradox: Why an ‘A’ Doesn’t Always Mean Fast
The GTmetrix letter grade (A to F) is calculated from the Performance score, which is a weighted average of the Lighthouse metrics. It is entirely possible to achieve an ‘A’ grade while failing Core Web Vitals — particularly LCP — because the grade reflects the weighted composite, not each metric individually.
This matters because Google’s ranking signals care about Core Web Vitals, not the GTmetrix letter grade. A site with a GTmetrix ‘B’ grade and green Core Web Vitals will generally outperform a site with an ‘A’ grade and a failing LCP in terms of page experience signals.
When reporting to clients or stakeholders, focus on Core Web Vitals status (green/amber/red) and the specific metrics that are failing. The letter grade is a useful at-a-glance indicator, but it can mislead non-technical audiences into thinking a ‘B’ site is fine when its LCP is 4.2 seconds.
Using the GTmetrix WordPress Plugin
GTmetrix offers a WordPress plugin that connects your dashboard to your GTmetrix account via API key, allowing you to run and schedule tests without leaving the admin interface. The setup process:
- Install and activate “GTmetrix for WordPress” from the plugin directory
- In your GTmetrix account, navigate to Account > API Usage and copy your API key
- Paste the key into the plugin settings along with your account email
- The plugin adds a GTmetrix widget to your WordPress dashboard and a GTmetrix menu item in the admin toolbar
The plugin is useful for agencies managing multiple client sites, as you can generate one API key per site to track tests separately. You can schedule automated tests (hourly, daily, weekly, or monthly) and receive email reports, though your daily test credit allowance applies regardless of whether you trigger tests manually or via schedule.
Whether you use the plugin or the GTmetrix website makes no functional difference to the results — the test runs identically. The plugin saves time if you’re already logged into WordPress and want to run a quick check without switching tabs.
Monitoring Performance Over Time
One-off GTmetrix tests tell you where you are today. Regular monitoring tells you whether you’re moving in the right direction — and alerts you when a plugin update, new image, or code change causes a regression.
For agencies and developers managing client sites, a practical monitoring approach involves:
- Running a monthly baseline test from the London node on the three to five most important pages
- Logging results in a simple spreadsheet with dates and any site changes made that month
- Setting a threshold: if Performance drops below 80 or LCP exceeds 3 seconds, investigate immediately
GTmetrix’s paid monitoring feature automates this and can send alerts when performance drops below defined thresholds, but the manual approach is sufficient for most small business sites.
For a fuller picture of how your site performs in production, pair GTmetrix testing with website performance monitoring across your key user journeys, including mobile behaviour and third-party script impact. ProfileTree’s SEO services include technical audits that cover Core Web Vitals alongside crawlability, indexation, and on-page signals.
Frequently Asked Questions
Is GTmetrix accurate?
GTmetrix lab data is consistent and repeatable, but it isn’t identical to real-world user experience. Lab tests use fixed network conditions and a simulated browser, so they don’t capture the variability of actual user devices, connection speeds, or server load during busy periods. Scores also fluctuate slightly between tests due to server-side variability and third-party script loading differences. For the most accurate picture, cross-reference GTmetrix with Google PageSpeed Insights’ field data, which draws on real Chrome user measurements where enough traffic data exists.
What is a good GTmetrix score?
Aim for a Performance score of 90 or above (GTmetrix Grade A or B) and, more critically, green Core Web Vitals: LCP under 2.5s, TBT under 200ms, and CLS under 0.1. For competitive industries, the pages ranking at the top of Google for most commercial queries now meet or exceed these thresholds. If you’re on page two or three and your Core Web Vitals are red or amber, performance is likely contributing to your ranking position.
Why does my GTmetrix score change every time I test?
Score variation between tests is normal. Contributing factors include server response time fluctuations under load, CDN cache state (a cold cache will perform worse than a warm one), third-party script availability (an ad network or analytics script that’s slow on one test run can drag down the score), and network conditions between GTmetrix’s test server and yours. If you’re seeing a variation of more than 10–15 points between consecutive tests, it usually points to server instability or inconsistent third-party script performance.
Is the free version of GTmetrix enough?
For most small business sites and individual projects, yes. The free Basic plan gives you access to seven test locations, including London, unlimited on-demand tests (subject to daily credit limits), full access to the waterfall chart and all tabs, and basic history. The paid plans add mobile testing, additional test locations, monitoring slots, and API access for automation. If you’re managing more than three or four client sites and need automated alerts, the entry-level paid plan is worth the cost.
How do I test a WordPress site behind a password?
GTmetrix can’t test sites behind Basic Authentication without credentials. On the Analysis Options panel, expand the “Connection” section. You’ll find a “Basic Auth” field where you can enter a username and password. This lets GTmetrix pass authentication and test your staging or dev environment before it goes live — a useful check before any major deployment.