Social Media Marketing Effectiveness: A Data-Led Guide for UK SMEs
Table of Contents
Social media marketing effectiveness is not a matter of opinion. It shows up in pipeline data, in website traffic reports, and in the gap between businesses that grow their audiences with purpose and those that post without a plan.
The challenge for most SME marketing managers is not a lack of social media activity. It is a lack of clarity on whether that activity is working. Likes and follower counts are easy to track and easy to misread. Revenue attribution is harder, and in a post-cookie tracking environment, it has become harder still.
This guide cuts through the noise. It covers key statistics on social media marketing effectiveness, explains what those numbers mean for UK and Irish businesses specifically, and provides a framework for connecting your social media data to decisions your business can act on.
What Does Social Media Marketing Effectiveness Actually Mean?
Before reaching for a dashboard, it is worth being precise about what you are measuring. Social media marketing effectiveness refers to the degree to which your social media activity delivers against defined business objectives. That definition sounds obvious, but most businesses skip it and jump straight to metrics, which is why engagement rates get reported to leadership while actual pipeline impact goes untracked.
Effectiveness is always relative to goal. A campaign designed to build brand awareness should be measured on reach, share of voice, and branded search volume, not on direct sales. A campaign-driving event registration should be measured by registrations, not by likes.
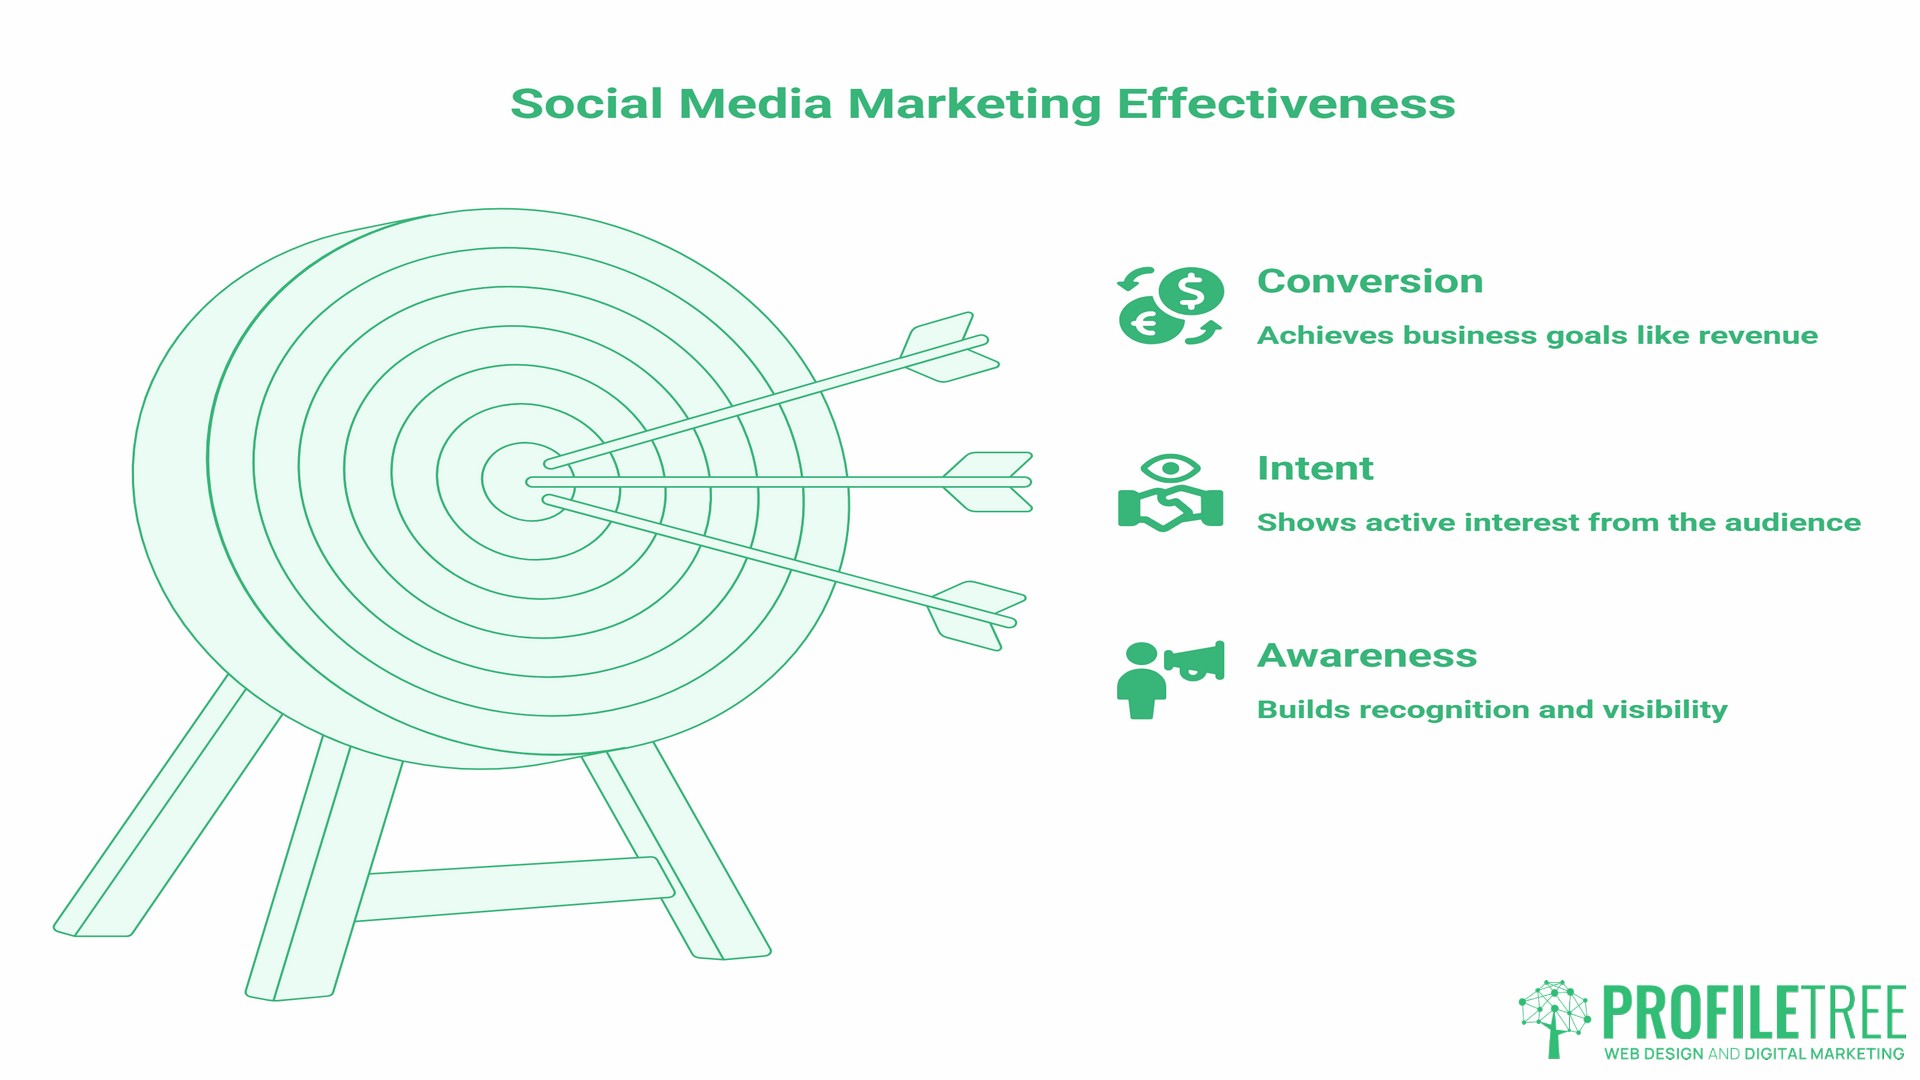
The three-tier framework that search engines and marketers broadly agree on maps effectiveness across:
Awareness: Can your target audience find and recognise you? Measured through reach, impressions, follower growth, and share of voice relative to your sector.
Intent: Are people showing active interest? Measured through engagement rate, click-through rate, profile visits, link clicks, and direct messages.
Conversion: Is social activity contributing to revenue? Measured through attributed leads, assisted conversions in GA4, and customer acquisition data tied back to social entry points.
Most SME social media reports cover the first tier adequately and the second partially. The third tier, where social media marketing effectiveness directly translates into business results, is where analysis typically breaks down.
Social Media Marketing Effectiveness Statistics: The Data That Matters
Platform Reach and the Scale Opportunity
The scale of social media as a channel is not in question. According to DataReportal’s October 2025 data, there are approximately 5.66 billion social media user identities worldwide, representing 68.7% of the global population. In the UK specifically, Ofcom’s 2025 Adults’ Media Use and Attitudes report confirms that 89% of UK adult internet users use at least one social media platform, rising to 97% among those aged 16 to 34.
For UK SMEs, this scale only matters if the right audience segment is reachable within budget. The more relevant statistic is not how many people are on a platform globally, but what the average organic reach of a business post is within that platform’s current algorithm.
Facebook’s organic reach for business pages has declined steadily. Socialinsider’s 2025 research puts Facebook’s average non-boosted post reach at around 1.2% of page followers. On Instagram, organic reach has also fallen, with a 12% year-on-year decrease recorded in their 2025 data. These numbers make the case for thinking carefully about content quality and paid amplification, not for abandoning social entirely.
Engagement Rate Benchmarks by Platform
Not all engagement is equal, and not all platforms reward the same type of content. Based on Socialinsider’s 2025 benchmark data, analysed across 70 million social media posts:
| Platform | Average Engagement Rate | Strongest Content Format |
|---|---|---|
| TikTok | 2.5% (by followers) | Short-form video |
| 0.45% (by followers) | Reels, carousel | |
| 3.85%+ (by impressions) | Documents, text posts | |
| 0.15% (by followers) | Video, events | |
| X (Twitter) | 0.12% (by followers) | Text, threads |
One important note on LinkedIn: its engagement rate is measured by impressions rather than followers, which is how the platform calculates it natively. This makes it difficult to compare directly with the other platforms in the table. The LinkedIn figure shows that content reaching professional audiences on that platform prompts a higher interaction rate than content on purely social platforms.
Video Content and Social Media Marketing Effectiveness
The relationship between video content and social media marketing effectiveness is one of the best-evidenced connections in the data. Wyzowl’s 2025 State of Video Marketing report, based on survey data collected in late 2024, found that 87% of people say watching a video convinced them to buy a product or service, and 83% of video marketers say video directly increased sales.
Short-form video, specifically content under 90 seconds, now accounts for the majority of social media video consumption. According to Wyzowl’s 2025 data, 78% of people say they would most like to watch a short video to learn about a product or service, ahead of all other content formats including articles, infographics, and webinars.
For SMEs that have not yet invested in video production, these numbers present a clear opportunity gap. A food producer in Northern Ireland wanting to reach wholesale buyers, or a professional services firm in Dublin trying to build thought leadership, will both generate more measurable impact from a consistent short-form video strategy than from static image posts, regardless of production budget.
ProfileTree’s video production and YouTube marketing services are built specifically for businesses at this stage, where the case for video is clear but the in-house resource to produce it consistently is not. You can see how we approach video content strategy for SMEs here: video marketing services.
“The mistake most SME clients make is treating social media video as a one-off project rather than a content programme,” says Ciaran Connolly, founder of ProfileTree. “A single well-produced video does not move the needle. What moves the needle is a sustained volume of short, useful content published consistently across the right platforms for your audience.”
The Paid Social Reality
Organic reach decline is real, and any honest assessment of social media marketing effectiveness has to address it. According to Sprout Social’s 2024 index, 68% of marketers are now running paid social campaigns alongside organic activity, up from 55% in 2022. The shift reflects not a loss of confidence in social media but an adaptation to how the platforms now distribute content.
For UK SMEs, paid social advertising presents both opportunities and risks. The opportunity is precise audience targeting at a relatively low cost compared to traditional media. The risk is wasted budget on broad targeting with poorly defined creative.
According to the Advertising Association and WARC’s expenditure data, UK social media ad spend was forecast to reach £8.8bn in 2025, with social media accounting for 53% of all UK online display advertising in 2024. This level of investment from UK businesses reflects the channel’s continued commercial relevance, though it also means audiences are seeing more paid content than ever, raising the bar for creative quality.
This is the connection that most social media guides miss. Social media marketing effectiveness is not just a social media problem. A high-performing paid social campaign sending traffic to a slow, poorly structured landing page will consistently underperform. The website is part of the effectiveness equation. Our guide to maximising ROI from digital marketing campaigns covers how these elements connect in practice.
Measuring Social Media Effectiveness in a Post-Cookie World
One of the most significant shifts in digital marketing measurement happened in April 2021, when Apple’s iOS 14.5 update introduced App Tracking Transparency, requiring apps to ask for explicit user permission before tracking activity across other apps and websites. Meta’s own data suggested that the change affected its ability to attribute conversions by approximately 15% in aggregate, though the impact varied considerably by sector and audience demographic.
For UK businesses, this sits alongside the General Data Protection Regulation (GDPR) and the Privacy and Electronic Communications Regulations (PECR), which together restrict the use of tracking cookies without explicit consent. The practical result is that the attribution data available in Meta Business Suite or LinkedIn Campaign Manager is now systematically incomplete.
What This Means for Your Measurement Approach
The most reliable way to address this measurement gap is to base your effectiveness reporting on first-party data rather than platform-reported figures. First-party data means information you collect directly: GA4 event tracking on your own website, CRM data tied to lead sources, and email list growth attributed to specific social campaigns.
GA4’s approach to attribution is more nuanced than the previous Universal Analytics model. It supports data-driven attribution by default, which distributes credit across multiple touchpoints in the customer journey rather than assigning all credit to the last click. For SMEs running both organic and paid social, this provides a more accurate picture of how social media contributes to conversions alongside search, email, and direct traffic.
A practical starting point for any SME is to ensure UTM parameters are applied consistently to all social media links, paid and organic. This is the minimum requirement for GA4 to differentiate social traffic sources accurately. Without it, campaign performance data in GA4 will be unreliable regardless of how sophisticated the platform-level reporting appears.
Connecting Social Data to Business Decisions
Statistics on social media marketing effectiveness are only valuable when they inform a decision. The gap between “we have the data” and “we know what to do next” is where most SME marketing teams lose time and budget.
When the Data Shows High Reach, Low Engagement
This pattern typically means your content is being distributed but is not compelling enough to prompt interaction. The content may be too generic, too promotional, or poorly matched to the platform’s native format. On LinkedIn, for example, long-form text posts about industry topics consistently outperform company news posts in organic engagement. On Instagram, static product images underperform Reels by a significant margin in most sectors.
The decision: review your content mix by format and topic, not just by posting frequency. Identify the specific post types that generate above-average engagement for your account and produce more of them.
When the Data Shows High Engagement, Low Conversion
This is the most common source of frustration for SMEs. Content gets genuine interaction but it does not translate to website visits, enquiries, or sales. There are two likely causes: either the content is entertaining without being connected to a commercial outcome, or the conversion path from the social platform to the website is broken or under-optimised.
The decision: check what happens after the click. If traffic from social media to your website has a significantly higher bounce rate than traffic from other sources, the problem is often a mismatch between the social content’s tone and the landing page’s message. Our work on digital marketing strategy for SMEs frequently surfaces this as the primary conversion bottleneck, not the social content itself.
When the Data Shows Strong Video Watch Time but Low Click-Through
Short-form video that holds attention but does not drive traffic off-platform is a common pattern on TikTok and Instagram Reels, where the platforms actively suppress external link clicks in the content itself. For businesses where the primary goal is direct website traffic, this means rethinking the role of these platforms. They work better for brand awareness and audience building than for direct traffic generation, with a separate step required to convert social followers into website visitors via profile links, stories, or paid retargeting.
The decision: separate your platform KPIs by goal. Do not hold TikTok to the same click-through rate target as LinkedIn, where link posts are native. Measure each platform against the goal it is realistically suited to deliver.
Platform Effectiveness: Where Should UK SMEs Invest?
The answer depends on your audience, not on which platform is growing fastest globally.
LinkedIn for UK B2B
LinkedIn is the highest-value platform for most UK B2B businesses. The platform’s professional context means that content about business challenges, industry trends, and professional development consistently reaches buyers in a buying mindset. For professional services, technology, manufacturing, and agency sectors across Northern Ireland and Ireland, LinkedIn is typically where the most commercially relevant audience is accessible at the lowest cost.
The platform’s organic reach remains comparatively strong for accounts with engaged followings, and its advertising platform reaches audiences with measurably higher professional intent than consumer social platforms. According to LinkedIn’s own B2B Institute data, LinkedIn campaigns are reported to generate significantly stronger conversion rates for B2B lead generation than equivalent spend on other platforms, though this should be treated as self-reported data and tested against your own results.
Instagram and TikTok for Consumer-Facing Businesses
For UK SMEs selling directly to consumers, particularly in food, hospitality, retail, and lifestyle sectors, Instagram and TikTok offer the strongest organic reach potential through video content. The short-form video data from Wyzowl’s 2025 report is most pronounced on these platforms, and the cost of entry for consistent short-form video production has dropped considerably with improvements in smartphone camera quality and accessible editing tools.
TikTok’s UK presence remains strong, with average daily time spent on the platform sitting at 28 minutes per user according to Ofcom’s 2025 Online Nation report, significantly ahead of comparable platforms. For businesses targeting younger consumers or building brand awareness in competitive retail categories, TikTok’s discoverability for new accounts remains stronger than Instagram’s, where existing follower counts have more influence on organic reach.
For a detailed breakdown of how TikTok specifically performs across UK age groups and sectors, the TikTok UK statistics page covers the platform’s growth patterns in the UK market.
Facebook for Local Service Businesses
Facebook’s organic reach may be low, but its local business features and the demographic profile of its UK user base make it the most effective platform for local service businesses that rely on community visibility. Ofcom’s 2025 data shows that Facebook and Messenger reach 93% of UK adults across their combined services. Facebook Groups, Events, and the local business recommendation feature all create organic visibility pathways that are less dependent on follower count than standard post reach.
For trades, local retailers, healthcare providers, and community services across Northern Ireland and Ireland, Facebook’s local targeting in paid advertising remains among the most cost-effective options available.
The UK Regulatory Context: Effectiveness and Compliance
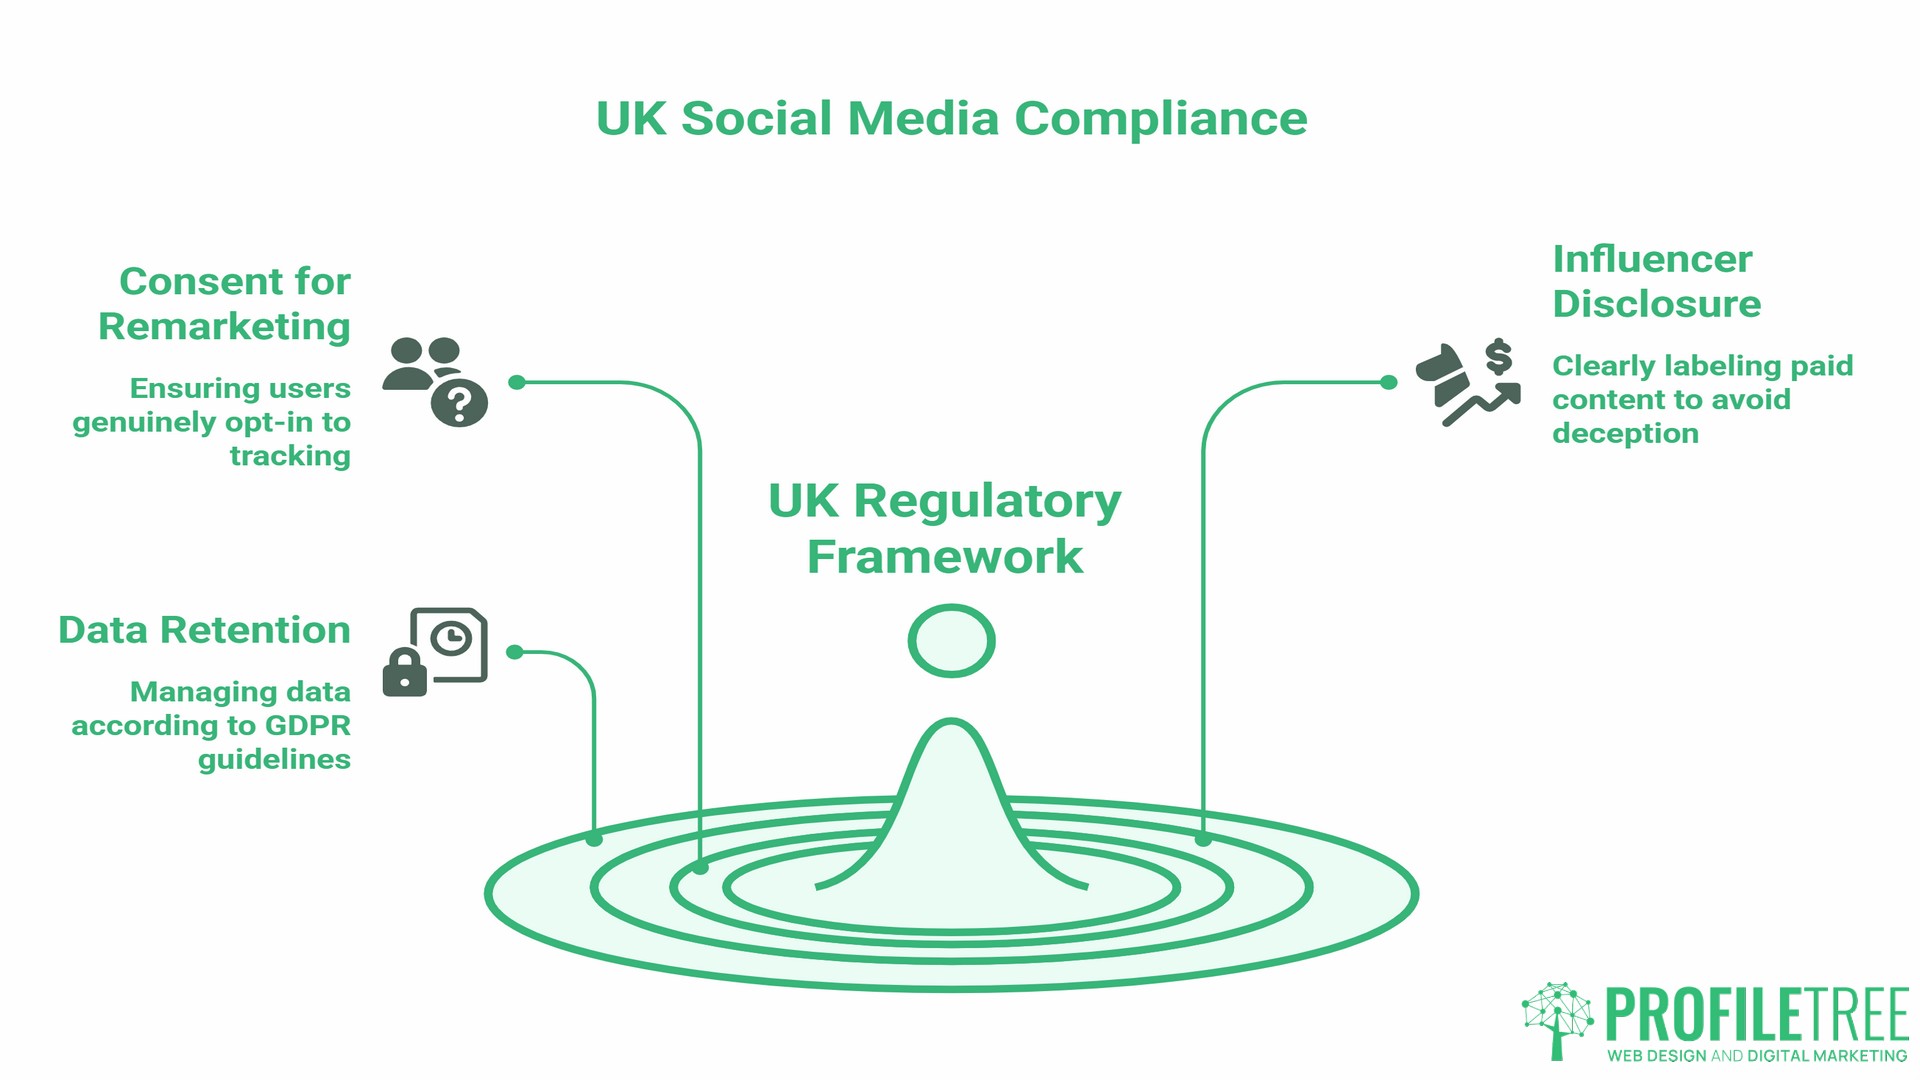
Social media marketing effectiveness in the UK operates within a regulatory framework that does not apply identically in other markets. UK GDPR, the PECR, and the Advertising Standards Authority’s (ASA) social media guidelines all set boundaries that affect how you can collect data, retarget audiences, and label paid content.
The key practical obligations for UK SMEs running social media campaigns:
Consent for remarketing: If you are running retargeting campaigns based on website visitor data, your cookie consent mechanism must be properly configured and genuinely allow users to decline tracking. Pre-ticked boxes, confusing consent flows, or consent banners that make declining harder than accepting are all non-compliant under UK GDPR.
Influencer and paid content disclosure: The ASA and the Competition and Markets Authority (CMA) require all paid social media content, including influencer posts, to be clearly labelled as advertising. “Ad,” “Paid partnership,” or “Sponsored” labels are required where a commercial relationship exists, regardless of the platform’s own labelling tools.
Data retention: Customer data captured through social media lead-generation forms, chatbots, or competition entries is subject to the same data retention principles as any other personal data under the UK GDPR. You must have a lawful basis for holding it and a defined retention period.
For businesses working through the broader landscape of digital marketing compliance, the guide to ethics and legalities of digital marketing covers the regulatory context in more depth.
Connecting Social Media Results to Wider Digital Strategy
Social media marketing effectiveness does not exist in isolation. The businesses that generate the strongest measurable returns from social media are almost always those where social activity is connected to a wider digital strategy that includes SEO, content marketing, and website performance.
The relationship works in both directions. Social media distributes content and builds brand awareness, which in turn generates branded search queries that organic SEO captures. SEO content provides shareable material that gives social channels something valuable to post beyond promotional material. Website performance determines whether the social traffic generates conversions, which affects the ROI figures that justify the social media budget in the first place.
For SMEs that have social media activity but weak organic search visibility, building that SEO foundation is typically the higher-priority investment. Social media marketing effectiveness statistics look very different for a business whose website converts at 3% compared to one converting at 0.5%, even if both businesses are running identical social campaigns.
ProfileTree works with SMEs across Northern Ireland, Ireland, and the wider UK to build this connected approach, where social media strategy, content marketing, and SEO are planned together rather than in separate silos. An overview of how social media activity can directly support revenue growth is covered in the social media and sales statistics article.
AI tools are also changing how social media content is produced and measured. Businesses using AI to assist with content creation, audience analysis, and campaign optimisation are reporting efficiency gains, though the quality of AI-assisted content still requires editorial oversight to maintain the authenticity that performs well organically. For SMEs exploring this area, a cost-benefit analysis of AI implementation provides a practical starting point for understanding where AI creates genuine value in a marketing context.
The 30-Minute Monthly Social Media Effectiveness Audit
A monthly audit does not need to be complex to be useful. This 10-point checklist covers the metrics that most reliably indicate whether your social media marketing effectiveness is improving or declining.
- Reach vs previous month: Is your total organic reach growing, stable, or declining across your primary platforms?
- Engagement rate by format: Which content formats are generating above-average engagement for your account specifically?
- Click-through rate from social to website: Is social media sending more or fewer qualified visitors to your site than last month?
- Bounce rate for social traffic in GA4: Are social visitors engaging with your website content or leaving immediately?
- Assisted conversions from social: How many conversions in GA4 had a social touchpoint somewhere in the journey, even if it was not the last click?
- Top performing post of the month: What made it perform? Can you replicate the format, topic, or timing?
- Lowest performing post of the month: Was it a content problem, a timing problem, or a format mismatch?
- Follower growth rate: Is your audience growing? Has growth slowed, and if so, does that correspond to a change in posting frequency or content type?
- Ad spend vs attributed revenue: For any paid campaigns running, is the cost per lead or cost per acquisition moving in the right direction?
- Competitor social activity check: Are competitors posting more, less, or differently? Are they generating visible engagement on content themes you are not covering?
Running through this checklist each month takes 20 to 30 minutes with access to your platform analytics and GA4. It produces the minimum dataset needed to make informed decisions about where to focus social media resources in the following month.
Frequently Asked Questions
What are the four main indicators of social media marketing effectiveness?
The four indicators that most frameworks agree on are reach (how many people your content is reaching), engagement (how actively your audience interacts with it), conversion (how many of those interactions lead to a business outcome), and retention (whether social media activity supports repeat purchases or ongoing customer relationships). Most SME reporting covers the first two adequately but underinvests in tracking the third and fourth.
Is social media marketing still effective for small businesses in the UK?
Yes, but not in the same way it was five years ago. Organic reach on most platforms has declined significantly, so posting alone is unlikely to generate meaningful business results without either a substantial existing audience or paid amplification. The businesses seeing the strongest social media marketing effectiveness results are those running a combination of consistent organic content, modest paid boosting of their best-performing posts, and retargeting campaigns for website visitors. Social media remains a cost-effective channel for UK SMEs; it simply requires more strategic management than it did when organic reach was higher.
How do I measure social media ROI if I do not sell products online?
Focus on micro-conversions rather than direct sales attribution. Micro-conversions include form completions, phone calls tracked via call analytics, resource downloads, email newsletter sign-ups, and event registrations. In GA4, set these up as conversion events and apply UTM parameters to all social media links so GA4 can attribute these to specific social channels and campaigns. Over time, you will build a dataset that connects social media activity to lead generation, even without a direct e-commerce sale to track.
Which social media platform has the highest ROI for UK businesses?
It depends on your business model. For B2B businesses, LinkedIn consistently generates the highest-quality leads and the strongest conversion rates in the professional services and technology sectors, even though its cost-per-click is higher than Meta’s. For consumer-facing businesses, Instagram and TikTok deliver stronger results through video content, particularly for brands where visual appeal is central to the product. Facebook remains the most effective platform for local service businesses targeting the 35 to 54 age group through a combination of organic community activity and locally targeted paid campaigns.
How has iOS 14 affected social media measurement?
The iOS 14.5 update in April 2021 introduced App Tracking Transparency, which required users to explicitly consent to cross-app tracking. The majority opted out. This reduced Meta’s ability to track user behaviour off-platform, creating a gap between the conversions Meta reports and those GA4 records. For most businesses, Meta now under-reports conversions relative to reality. The most reliable workaround is implementing Meta’s Conversions API alongside the standard pixel, which uses server-side event matching to reduce the attribution gap. UK businesses should also ensure their cookie consent setup is collecting first-party data compliantly under UK GDPR and PECR.
How often should I audit my social media effectiveness?
Monthly tactical audits covering the metrics in the checklist above, and quarterly strategic reviews. The quarterly review is where you step back from individual post performance and assess whether your overall social media approach is aligned with your business goals, whether the platforms you are on are still the right ones for your audience, and whether your content mix reflects where your audience is spending attention. Annual audits should coincide with your broader marketing strategy review and include a reassessment of budget allocation across channels.
What is a realistic engagement rate for a UK SME on Instagram?
Based on Socialinsider’s 2025 benchmark data, an engagement rate of 0.45% on Instagram posts is now the cross-industry average for business accounts. Accounts that post consistently, use Reels, and actively engage with their audience in comments can expect to sit above this average. Engagement rates have fallen approximately 28% year-on-year, according to Socialinsider’s analysis, which makes historical comparisons misleading. The more useful benchmark is your own account’s trend over time rather than absolute figures.