Business Analytics Tools: A Practical Guide for SMEs
Table of Contents
Business analytics tools have moved from large-enterprise territory to something any small or medium-sized business can realistically use. The challenge now isn’t whether to use them. It’s choosing the right one, getting the data in order, and actually acting on what the numbers show.
At ProfileTree, we’ve spent more than a decade working with SMEs across Northern Ireland, Ireland, and the UK. We see the same pattern repeatedly: businesses that make decisions based on data outperform those that rely on gut instinct, regardless of sector or size. “The businesses that grow fastest aren’t always the ones with the biggest budgets,” says Ciaran Connolly, founder of ProfileTree. “They’re the ones that know which numbers matter and check them regularly.”
This guide covers the main business analytics software options available today, how to choose between them, and what to watch out for during implementation.
What Is Business Analytics?
Business analytics is the process of using data to understand how a business is performing and to inform decisions about what to do next. It covers four broad activities: describing what has happened (descriptive analytics), diagnosing why it happened (diagnostic analytics), predicting what is likely to happen (predictive analytics), and recommending what action to take (prescriptive analytics).
Most SMEs start with descriptive analytics, which is simply reporting on sales, traffic, costs, or customer behaviour. The more sophisticated tools in this guide go further, helping you spot correlations, run what-if scenarios, and build models that forecast future outcomes.
Why the Tools Have Become More Accessible
Five years ago, building a reliable analytics dashboard required a data analyst or a significant IT investment. That has changed. Modern business analytics software comes with drag-and-drop interfaces, pre-built connectors to common platforms like Shopify, Xero, and Salesforce, and natural language query functions that let you type a question and get a chart back.
This shift matters for SMEs because it removes the technical barrier. You don’t need to hire a data scientist to find out which product lines are most profitable, which marketing channels drive real conversions, or where your website is losing visitors.
The Business Analytics Tools Worth Considering
The market is crowded, but a handful of platforms consistently come up in client conversations and practical use. Here’s how they compare.
Microsoft Power BI
Power BI is the most widely adopted analytics platform in the SME market, partly because of price and partly because most businesses already use Microsoft 365. It connects to hundreds of data sources, including Excel, SharePoint, Salesforce, and Google Analytics, and produces dashboards that update automatically.
- What it does well: The drag-and-drop report builder is genuinely intuitive. Sharing dashboards across a team is straightforward, and the mobile app is usable rather than an afterthought. Microsoft’s Copilot integration now lets users ask questions in plain English and get charts or summaries back without writing any code.
- Where it falls short: Power BI’s visualisations can look dated compared to Tableau. The free desktop version is useful for building reports, but sharing them properly requires a Pro licence.
- Pricing: From £8 per user per month for Pro. Premium capacity starts at £16 per user per month.
- Best for: Businesses already in the Microsoft ecosystem. Power BI reduces integration friction because it connects natively to tools you’re probably already paying for.
Our web design and development services often include Power BI dashboard setup for clients who need to track website performance alongside broader business data.
Tableau
Tableau’s strength is visualisation. If you need to present data to a board, to investors, or to clients who aren’t used to reading spreadsheets, Tableau produces charts and dashboards that communicate clearly and look professional.
- What it does well: The visualisation options are extensive. Tableau handles large datasets without slowing down, and its mapping capabilities are stronger than most competing tools. The 2025 Slack integration means teams can share data insights directly in their communication channels.
- Where it falls short: The price point is significantly higher than Power BI. At £55 per user per month for Creator licences, it’s harder to justify for smaller teams unless data storytelling is a genuine business need.
- Pricing: £55 per user per month (Creator), £25 per user per month (Explorer).
- Best for: Organisations where data presentation matters as much as data analysis. Useful for agencies, consultancies, and any business that regularly reports performance to external stakeholders.
Google Analytics
Google Analytics sits in a different category from the others. It’s specifically designed for website and app performance, not broader business intelligence. That said, for any business with an online presence, it’s an essential tool.
GA4, the current version, tracks the full user journey across website and app, measures conversion events, and shows which traffic sources drive real commercial outcomes. It integrates with Google Ads, Google Search Console, and Google Looker Studio for reporting.
- What it does well: It’s free, it’s well-documented, and Google’s own search algorithms use the same signals GA4 tracks. Understanding this data directly improves your ability to make decisions about content, paid spend, and site structure.
- Where it falls short: GA4’s interface is significantly more complex than its predecessor. Many small business owners find it confusing at first. The transition from session-based to event-based tracking also means historical comparisons require careful handling.
- Pricing: Free. Google Analytics 360 (enterprise) starts at around £100,000 annually and is not relevant for most SMEs.
- Best for: Every business with a website. It should be the first analytics tool you set up, not an afterthought.
Our digital marketing services include GA4 setup and configuration for new clients, because clean tracking data is the foundation on which everything else builds.
Google Looker Studio
Looker Studio (formerly Data Studio) is a free reporting tool that sits on top of GA4, Google Ads, Google Search Console, and other Google data sources. It’s worth mentioning separately from Google Analytics because its purpose is different: where GA4 collects and analyses data, Looker Studio presents it in shareable, customisable dashboards.
- What it does well: Free, flexible, and relatively easy to use once you understand the connector model. Good for building client-facing reports or internal dashboards without paying for Tableau or Power BI.
- Where it falls short: Limited to sources with available connectors. Non-Google data requires third-party connectors, which often carry additional costs.
- Pricing: Free.
- Best for: Businesses that primarily use Google’s ecosystem and need shareable reports without enterprise costs.
Qlik Sense
Qlik takes a different approach to most analytics platforms through its associative data model. Where most tools require you to ask a specific question and get an answer, Qlik lets you explore data freely, clicking through relationships to follow a thread wherever it leads.
- What it does well: The associative engine is genuinely useful for exploratory analysis, where you’re not sure what question to ask yet. Qlik Sense includes automated machine learning and is available as both a cloud and on-premise solution.
- Where it falls short: The learning curve is steeper than Power BI. It’s also less cost-effective for SMEs that just need standard reporting.
- Pricing: From around £18 per user per month for Professional.
- Best for: Data-heavy businesses where uncovering hidden relationships in complex datasets is a regular need, such as logistics, manufacturing, or multi-location retail.
Alteryx
Alteryx sits closer to the data preparation and advanced analytics end of the spectrum rather than standard business intelligence. It’s designed for teams that need to clean, blend, and model data before visualising it.
- What it does well: Alteryx handles complex data preparation tasks that would take hours in Excel in a fraction of the time. Its drag-and-drop workflow builder makes it accessible to analysts who aren’t developers.
- Where it falls short: The price point (around £4,950 per user per year for Designer) makes it difficult to justify for smaller businesses. It also has more tools than most SMEs need.
- Pricing: Approximately £4,950 per user per year.
- Best for: Organisations with genuinely complex data preparation requirements, typically larger businesses or those in regulated industries with multiple data sources that need significant transformation before analysis.
Business Analytics Tools Compared
| Tool | Best For | Pricing | Ease of Use |
|---|---|---|---|
| Power BI | Dashboards and reporting | From £8/user/month | Medium |
| Tableau | Advanced visualisation | From £25/user/month | Medium |
| Google Analytics | Website performance | Free | Medium |
| Looker Studio | Shareable dashboards | Free | Easy |
| Qlik Sense | Exploratory analytics | From £18/user/month | Hard |
| Alteryx | Data preparation | ~£4,950/user/year | Medium |
How to Choose the Right Business Analytics Software
The most common mistake businesses make is choosing a tool based on brand recognition or what a competitor uses. The right analytics software for your business depends on four things: where your data lives, who will use the tool, what decisions you need to make, and what you can realistically spend.
Start With Your Data Sources
Before evaluating any platform, list every system that holds data you want to analyse. This typically includes your website (GA4), your CRM, your accounting software, your ecommerce platform, and any industry-specific tools. The analytics platform that connects to all of them without expensive middleware will save you more than any feature difference between products.
Match the Tool to the User
A Power BI dashboard built by your IT team and accessed by your marketing manager once a month is not the same as a Looker Studio report that your whole team checks weekly. Think about who will actually use the tool day-to-day and whether they have the skills to maintain it. Our digital marketing services team frequently inherits analytics setups that were built by external consultants and never handed over properly; the reporting stopped being useful the moment the consultant left.
Define the Decision First
Good analytics tools are built around decisions, not data. Before choosing a platform, write down the three to five business decisions you want to make more confidently. If those decisions are all about website performance and marketing ROI, GA4 and Looker Studio may be sufficient. If you need to model cash flow scenarios or identify demand patterns across multiple product lines, you need something more capable.
Factor in Total Cost
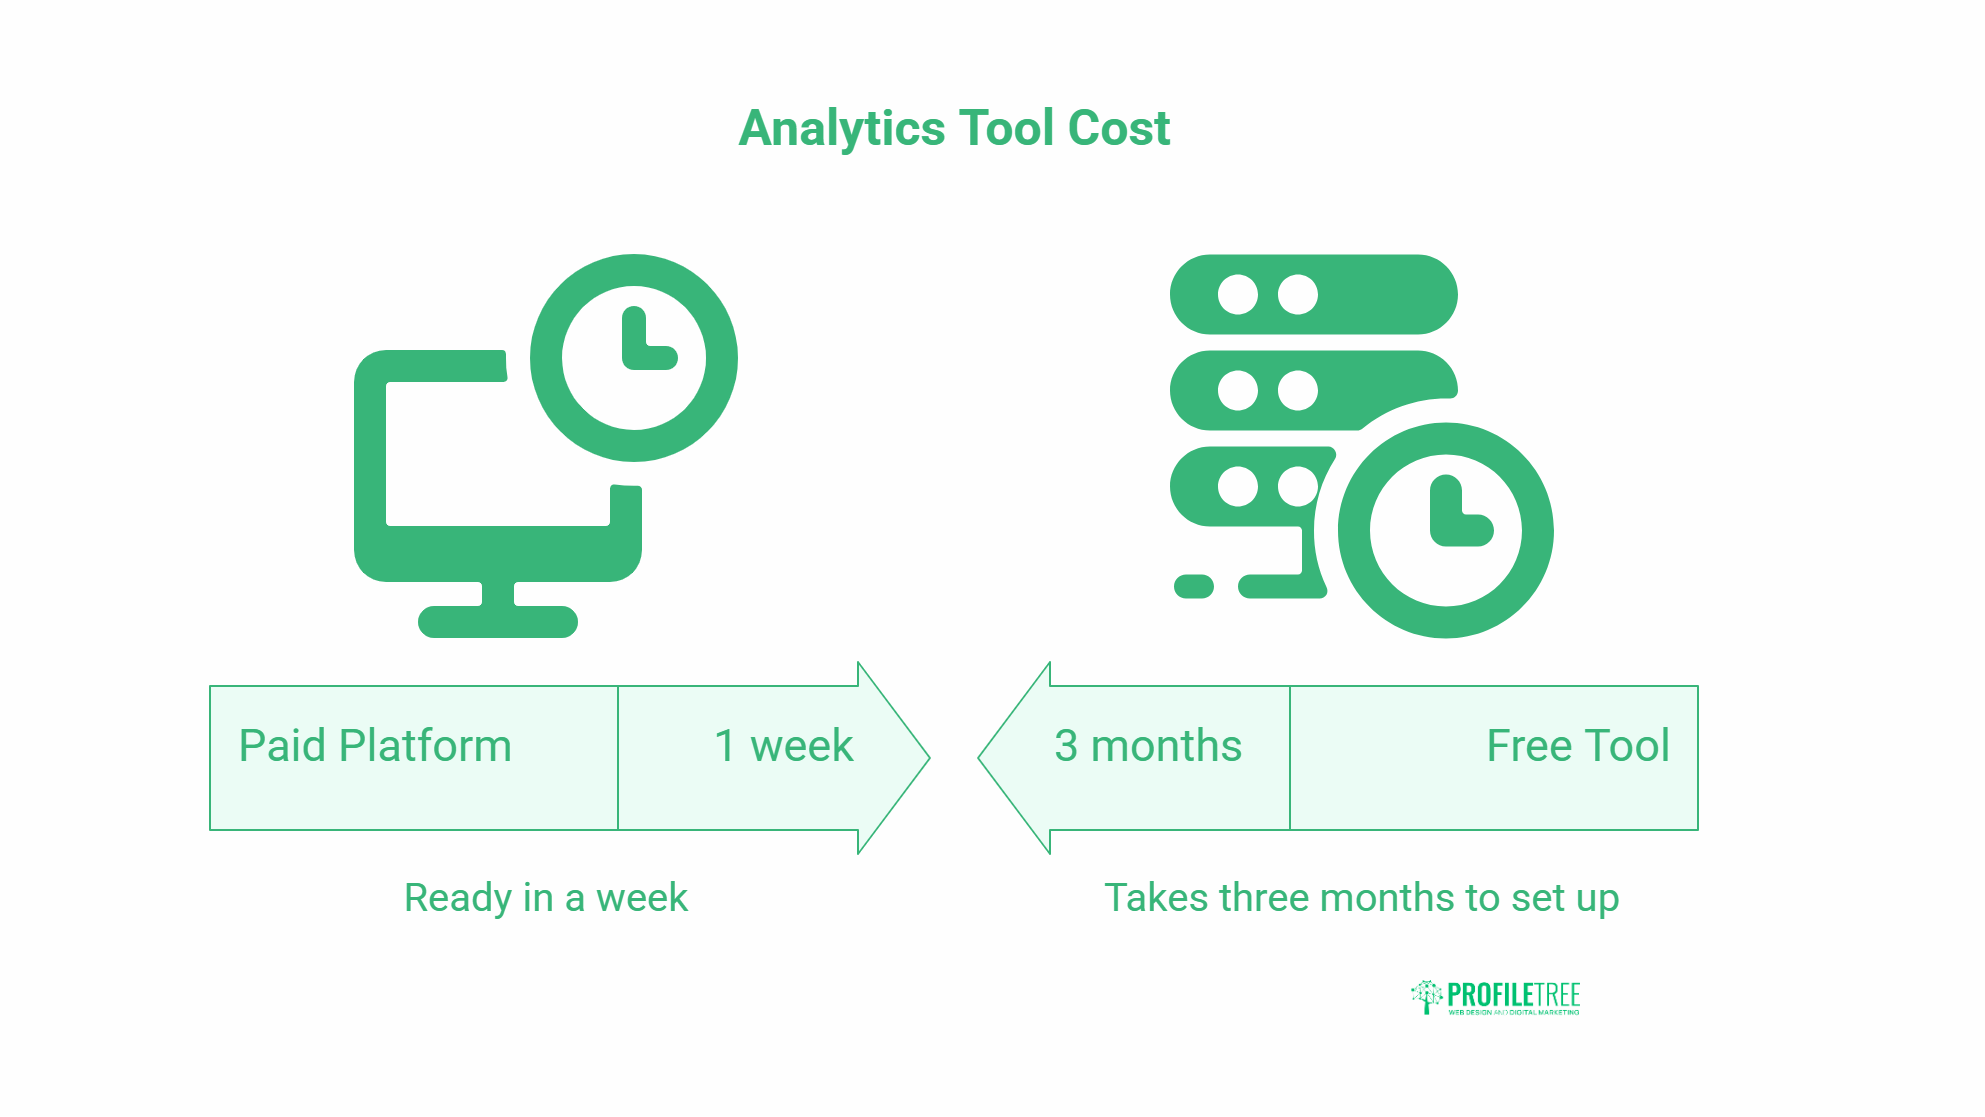
Licence costs are only part of the picture. Implementation, data cleaning, training, and ongoing maintenance all add to the real cost of analytics. A free tool that takes three months to set up properly can cost more in staff time than a paid platform that’s ready in a week. For Northern Ireland businesses, Invest NI’s digital transformation grants can cover a significant portion of analytics implementation costs for qualifying projects.
What Gets in the Way: Common Implementation Problems
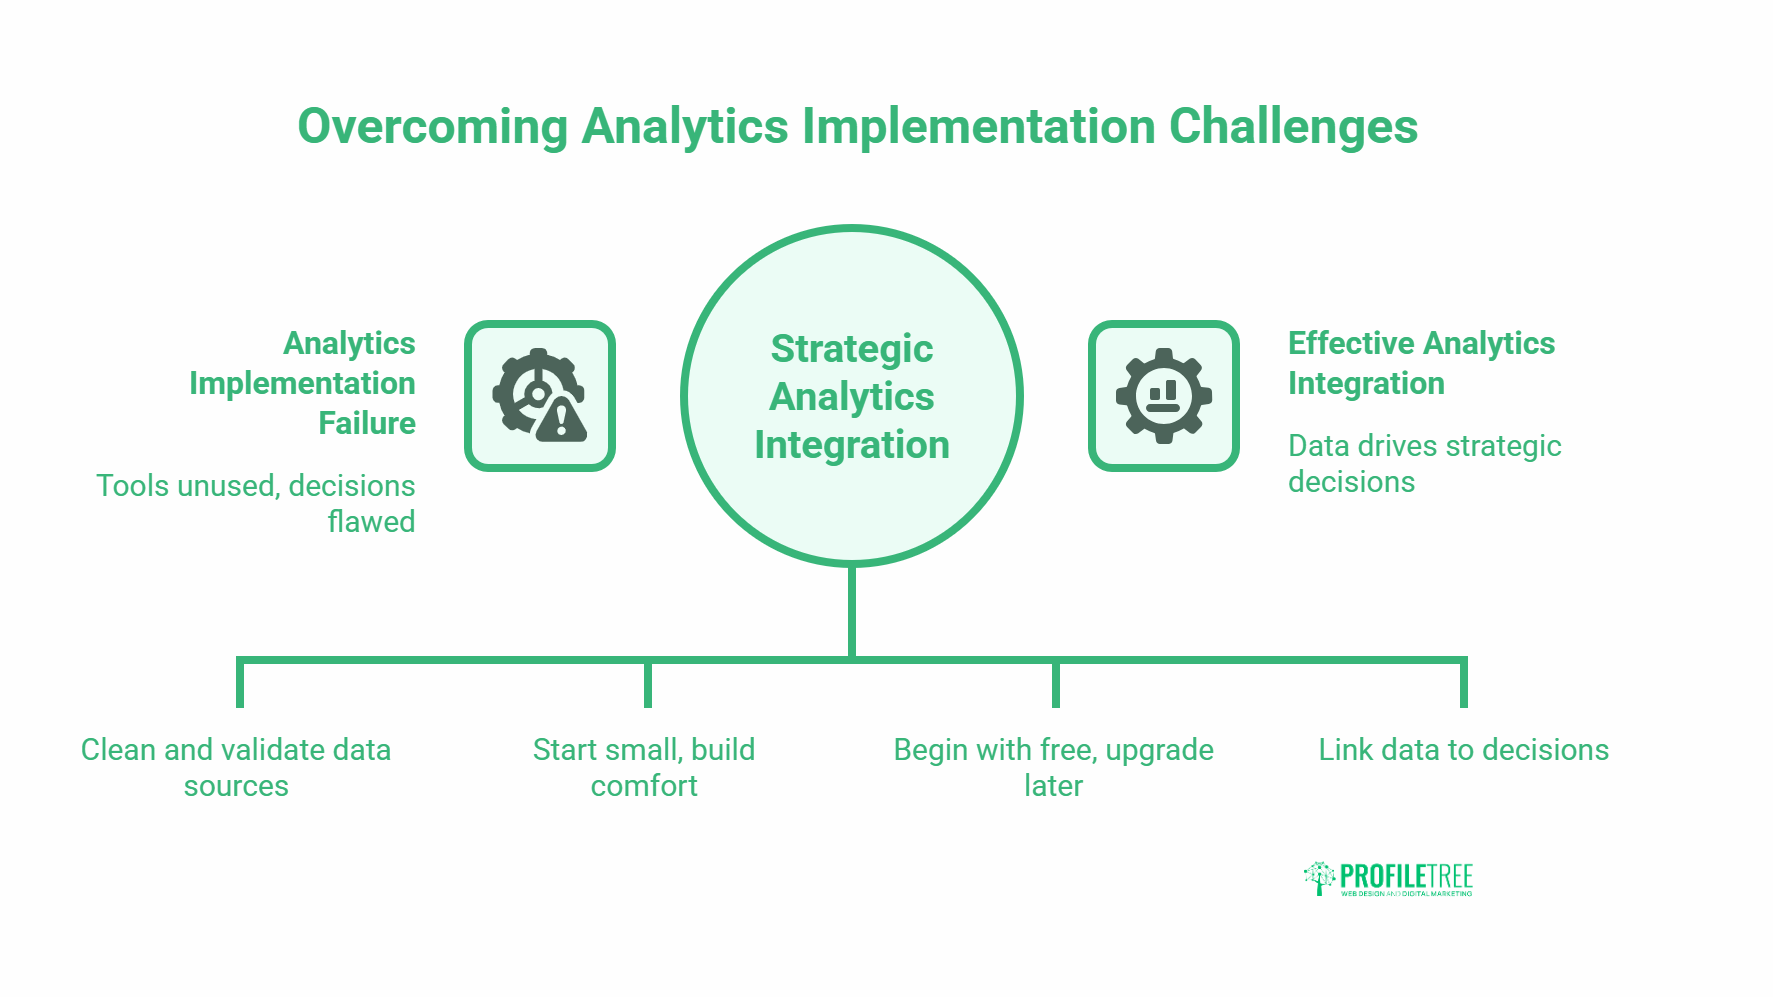
Data Quality
Analytics tools are only as reliable as the data you feed them. Inaccurate or inconsistent data in your CRM, duplicate customer records, or misconfigured tracking on your website will produce results that look credible but lead to wrong decisions. The fix is boring but unavoidable: audit and clean your data before you connect it to any analytics platform.
Skills and Adoption
Most analytics tools sit unused six months after purchase because the person who chose them isn’t the person who was supposed to use them daily. Build adoption by starting small: one dashboard, one team, one decision. Our AI transformation services include structured data literacy training that helps business teams get comfortable with analytics outputs before they’re expected to act on them.
Choosing the Wrong Level of Complexity
A manufacturing business in Antrim doesn’t need Alteryx. A Belfast e-commerce startup doesn’t need Tableau. Starting with more tool than you need is a common and expensive mistake. Begin with free tools, prove they’re being used, then upgrade when you’ve outgrown them.
How Analytics Fits Into a Broader Digital Strategy
Business analytics doesn’t exist in isolation. The data you collect from your website, your marketing channels, and your customer systems is only useful if it connects to decisions about content, campaigns, and services.
When we work with clients on content marketing strategy, analytics data drives the decisions about which topics to cover, which formats to use, and which pages need updating. When we work on web design projects, analytics from the old site shapes the architecture and conversion flow of the new one. The tools listed in this guide aren’t standalone investments; they’re infrastructure that makes every other part of your digital operation more effective.
The businesses that get the most from analytics aren’t necessarily the ones with the most sophisticated tools. They’re the ones that have built clear links between their data, their strategy, and their day-to-day decisions.
Frequently Asked Questions
What is the best business analytics tool for a small business?
For most small businesses, Google Analytics combined with Looker Studio covers website and marketing performance at no cost. For broader business intelligence, Power BI at £8 per user per month offers the best balance of capability and affordability, particularly for businesses already using Microsoft 365. Start with free tools, measure whether they’re actually being used, and upgrade only when you’ve clearly outgrown them.
What is the difference between business analytics and business intelligence?
Business intelligence typically refers to reporting on historical data: what happened, when, and how much. Business analytics goes further, using statistical methods, predictive modelling, and data mining to explain why things happened and forecast what is likely to happen next. In practice, most modern platforms blend both, with tools like Power BI covering standard BI reporting as well as more advanced analytical features.
What skills do you need to use business analytics tools?
Basic data literacy is more important than technical skills. Understanding how to read a chart, identify an outlier, and ask the right question of a dataset matters more than knowing how to code. Most modern analytics platforms are designed for non-technical users. Familiarity with spreadsheets helps. The harder skill is learning to connect data outputs to business decisions, which takes practice rather than training.
How much do business analytics tools cost for SMEs?
Costs range from free (Google Analytics, Looker Studio) to several thousand pounds per user per year for enterprise platforms. For most SMEs, Power BI Pro at £8 per user per month or Qlik Sense at around £18 per user per month cover the majority of use cases. Remember to account for implementation, training, and data preparation costs, which often exceed the licence fee in the first year.
Can analytics tools help with SEO and content marketing?
Yes, and this is one of the most direct use cases for SMEs. Google Search Console shows which queries are driving impressions and clicks to your website, where your rankings are dropping, and which pages underperform on click-through rate. Combined with GA4 conversion tracking, you can link specific pieces of content to specific business outcomes. This data sits at the centre of how ProfileTree builds content strategies for clients.
What are the main business analytics tools and techniques used in practice?
The most common techniques are dashboarding and reporting, conversion funnel analysis, cohort analysis, A/B testing, customer segmentation, and demand forecasting. The tools used to implement these vary by complexity: Excel and Looker Studio cover the basics, Power BI and Tableau handle intermediate needs, and platforms like Qlik or Alteryx support more advanced modelling. In digital marketing specifically, the combination of GA4, Google Search Console, and a CRM with reporting capability covers most analytical needs for SMEs.