Content Marketing Services
As Northern Ireland’s leading content marketing agency, we excel in crafting content that not only reaches but also resonates with your audience, and effectively conveys your brand’s message.
Our specialisation lies in creating impactful content that connects and engages, ensuring your brand’s story is told compellingly and memorably. Let us show you what’s possible with expert content marketing services.

Video Content Marketing
Our team of skilled videographers excel in capturing the essence of your business and in crafting captivating brand stories. Whatever your idea is, we can help bring it to life through striking visuals that inspire and motivate your target audience.
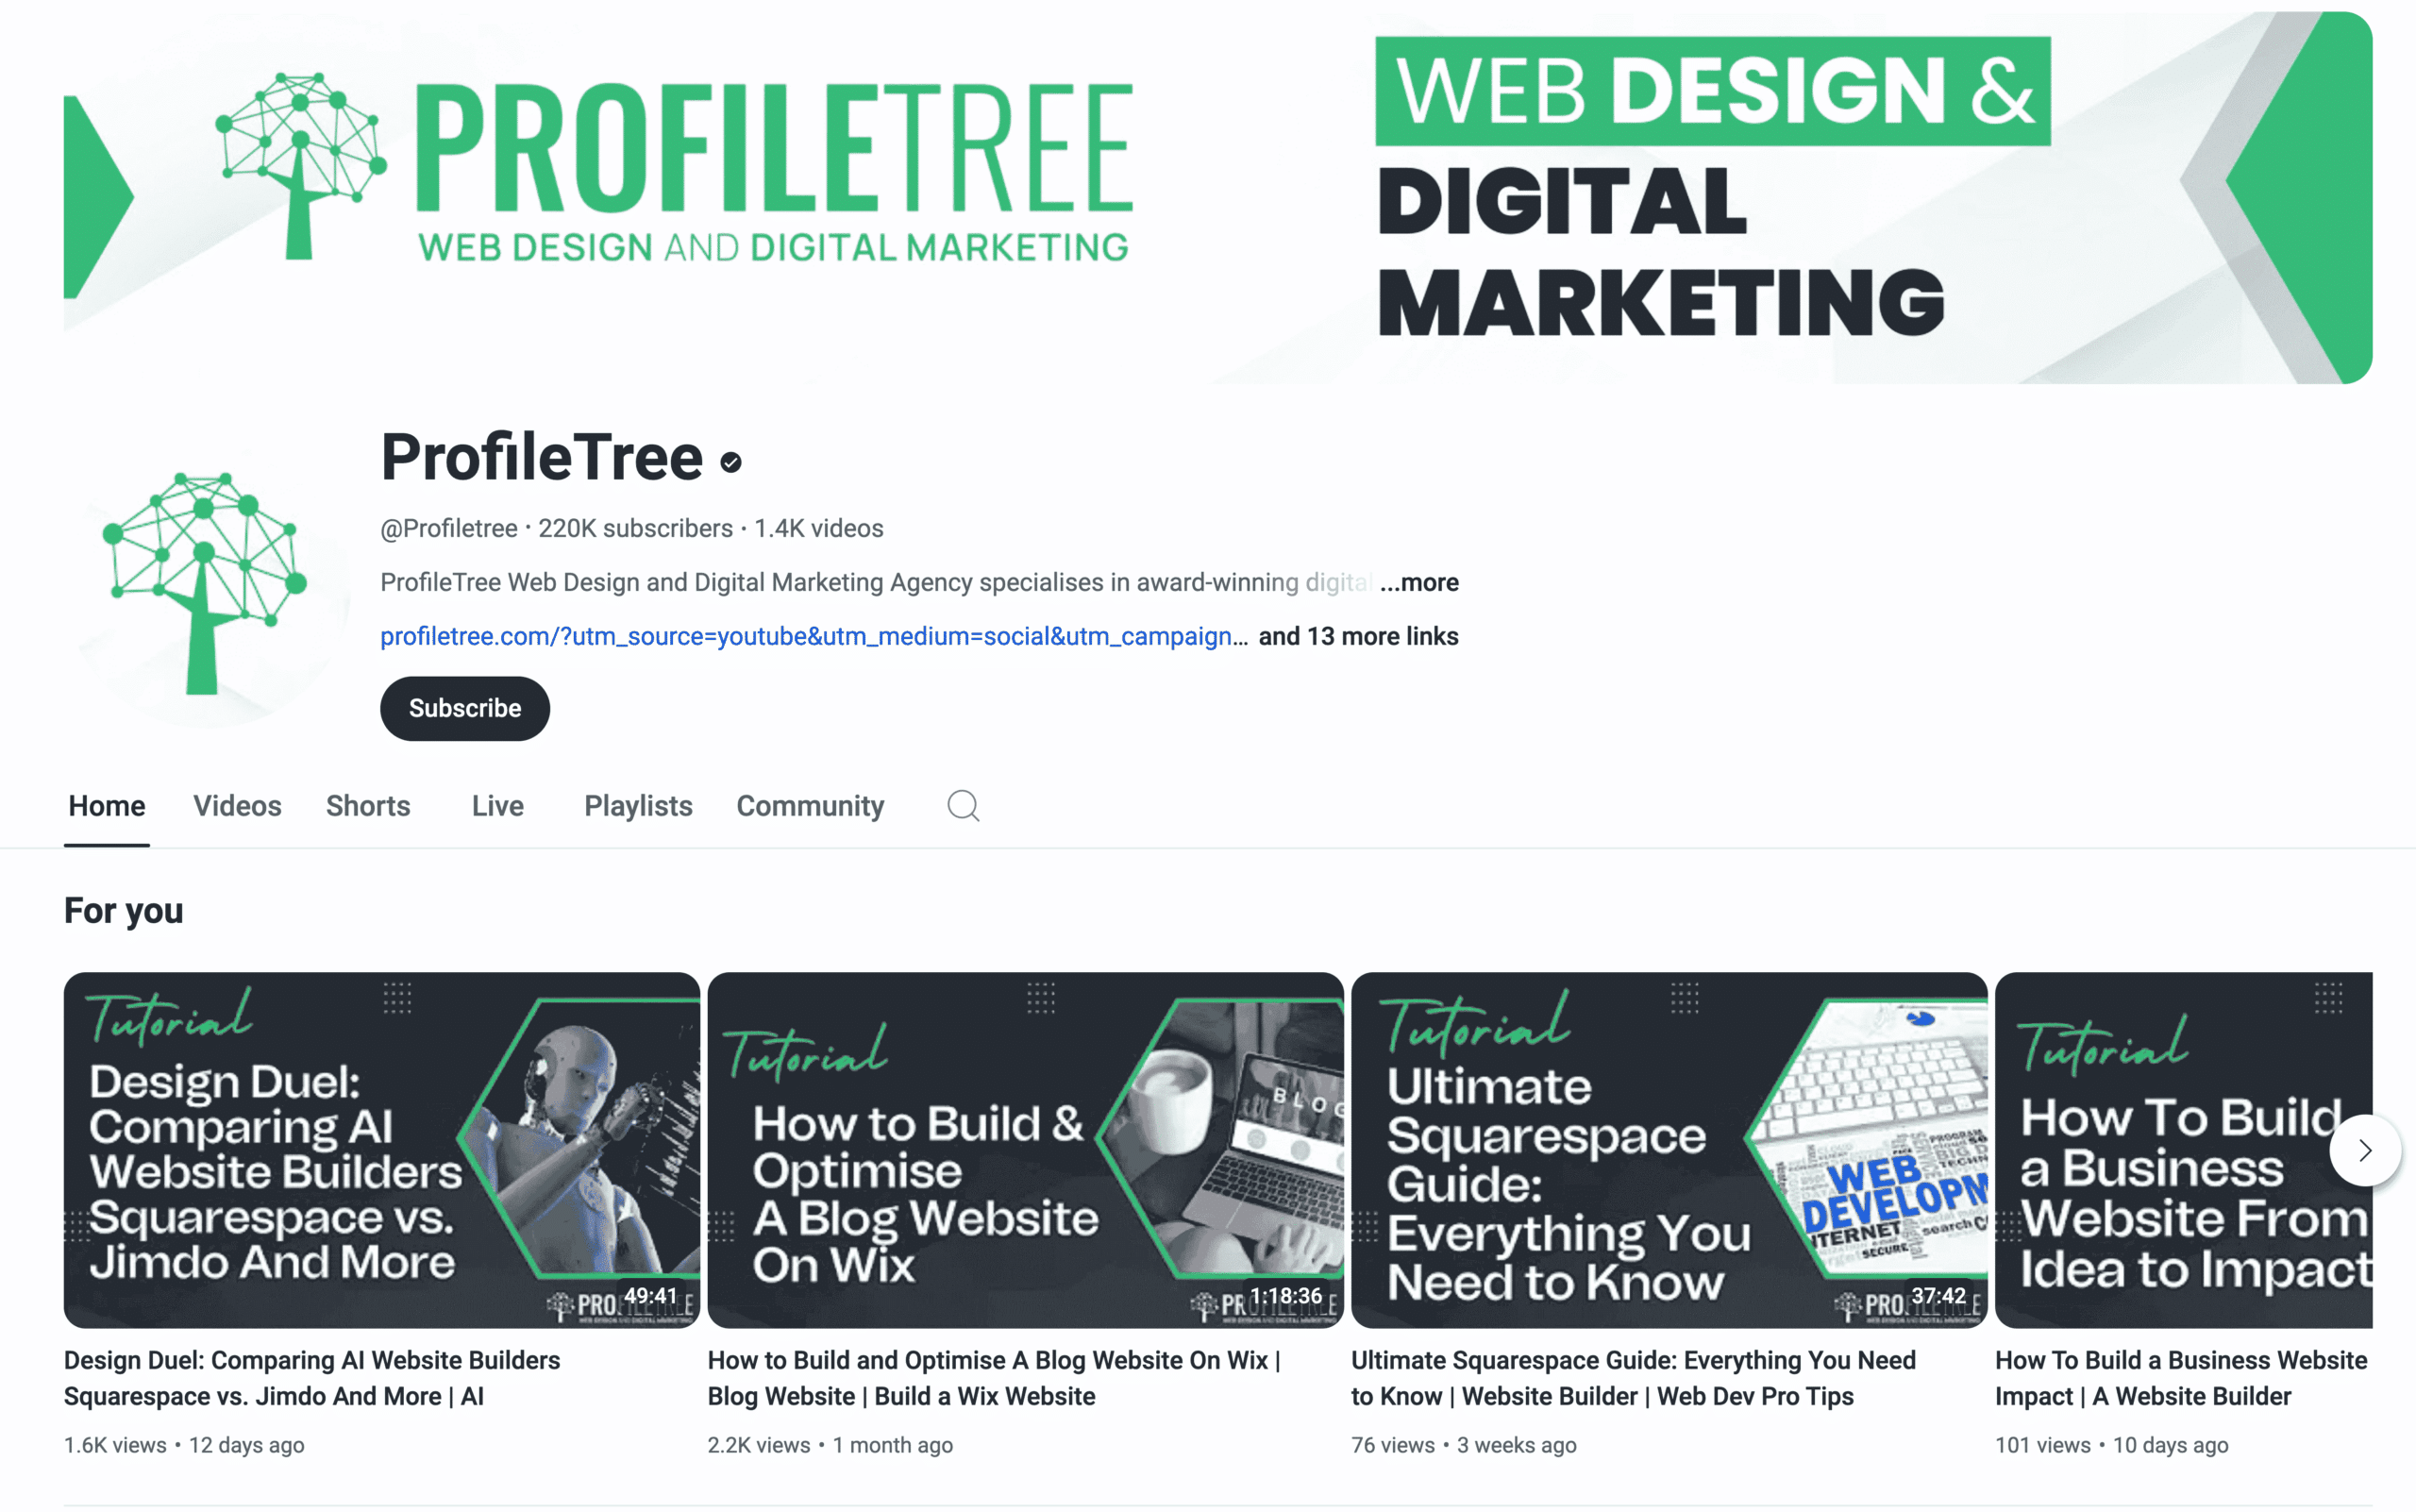
We specialise in producing video content that garners significant attention and delivers tangible results – as evidenced by our YouTube videos that generate hundreds of thousands of views.
Website Content Creation
Our approach to website content creation encompasses a dynamic blend of website graphics, animations, and interactive visuals, all tailored to enhance the user experience. This strategic combination propels your website’s content strategy forward, ensuring an engaging and memorable journey for your visitors.
With our in-house team of talented animators, web designers, and developers, we possess the comprehensive skills and resources needed to integrate these elements seamlessly. We are equipped to handle every aspect of your website’s content creation, ensuring a cohesive and impactful online presence.
Blog Writing and Copywriting
Our expertise in blog writing and copywriting encompasses crafting attention-grabbing headlines and persuasive body content. We excel in creating motivational and engaging materials that not only boost awareness but also drive sales and foster lasting engagement on your website and social media platforms.
Our skilled writers are adept at producing content that resonates with your audience, aligns with your brand voice, and effectively communicates your message, ensuring that every word contributes to your business’s success.
Content Strategy and Auditing
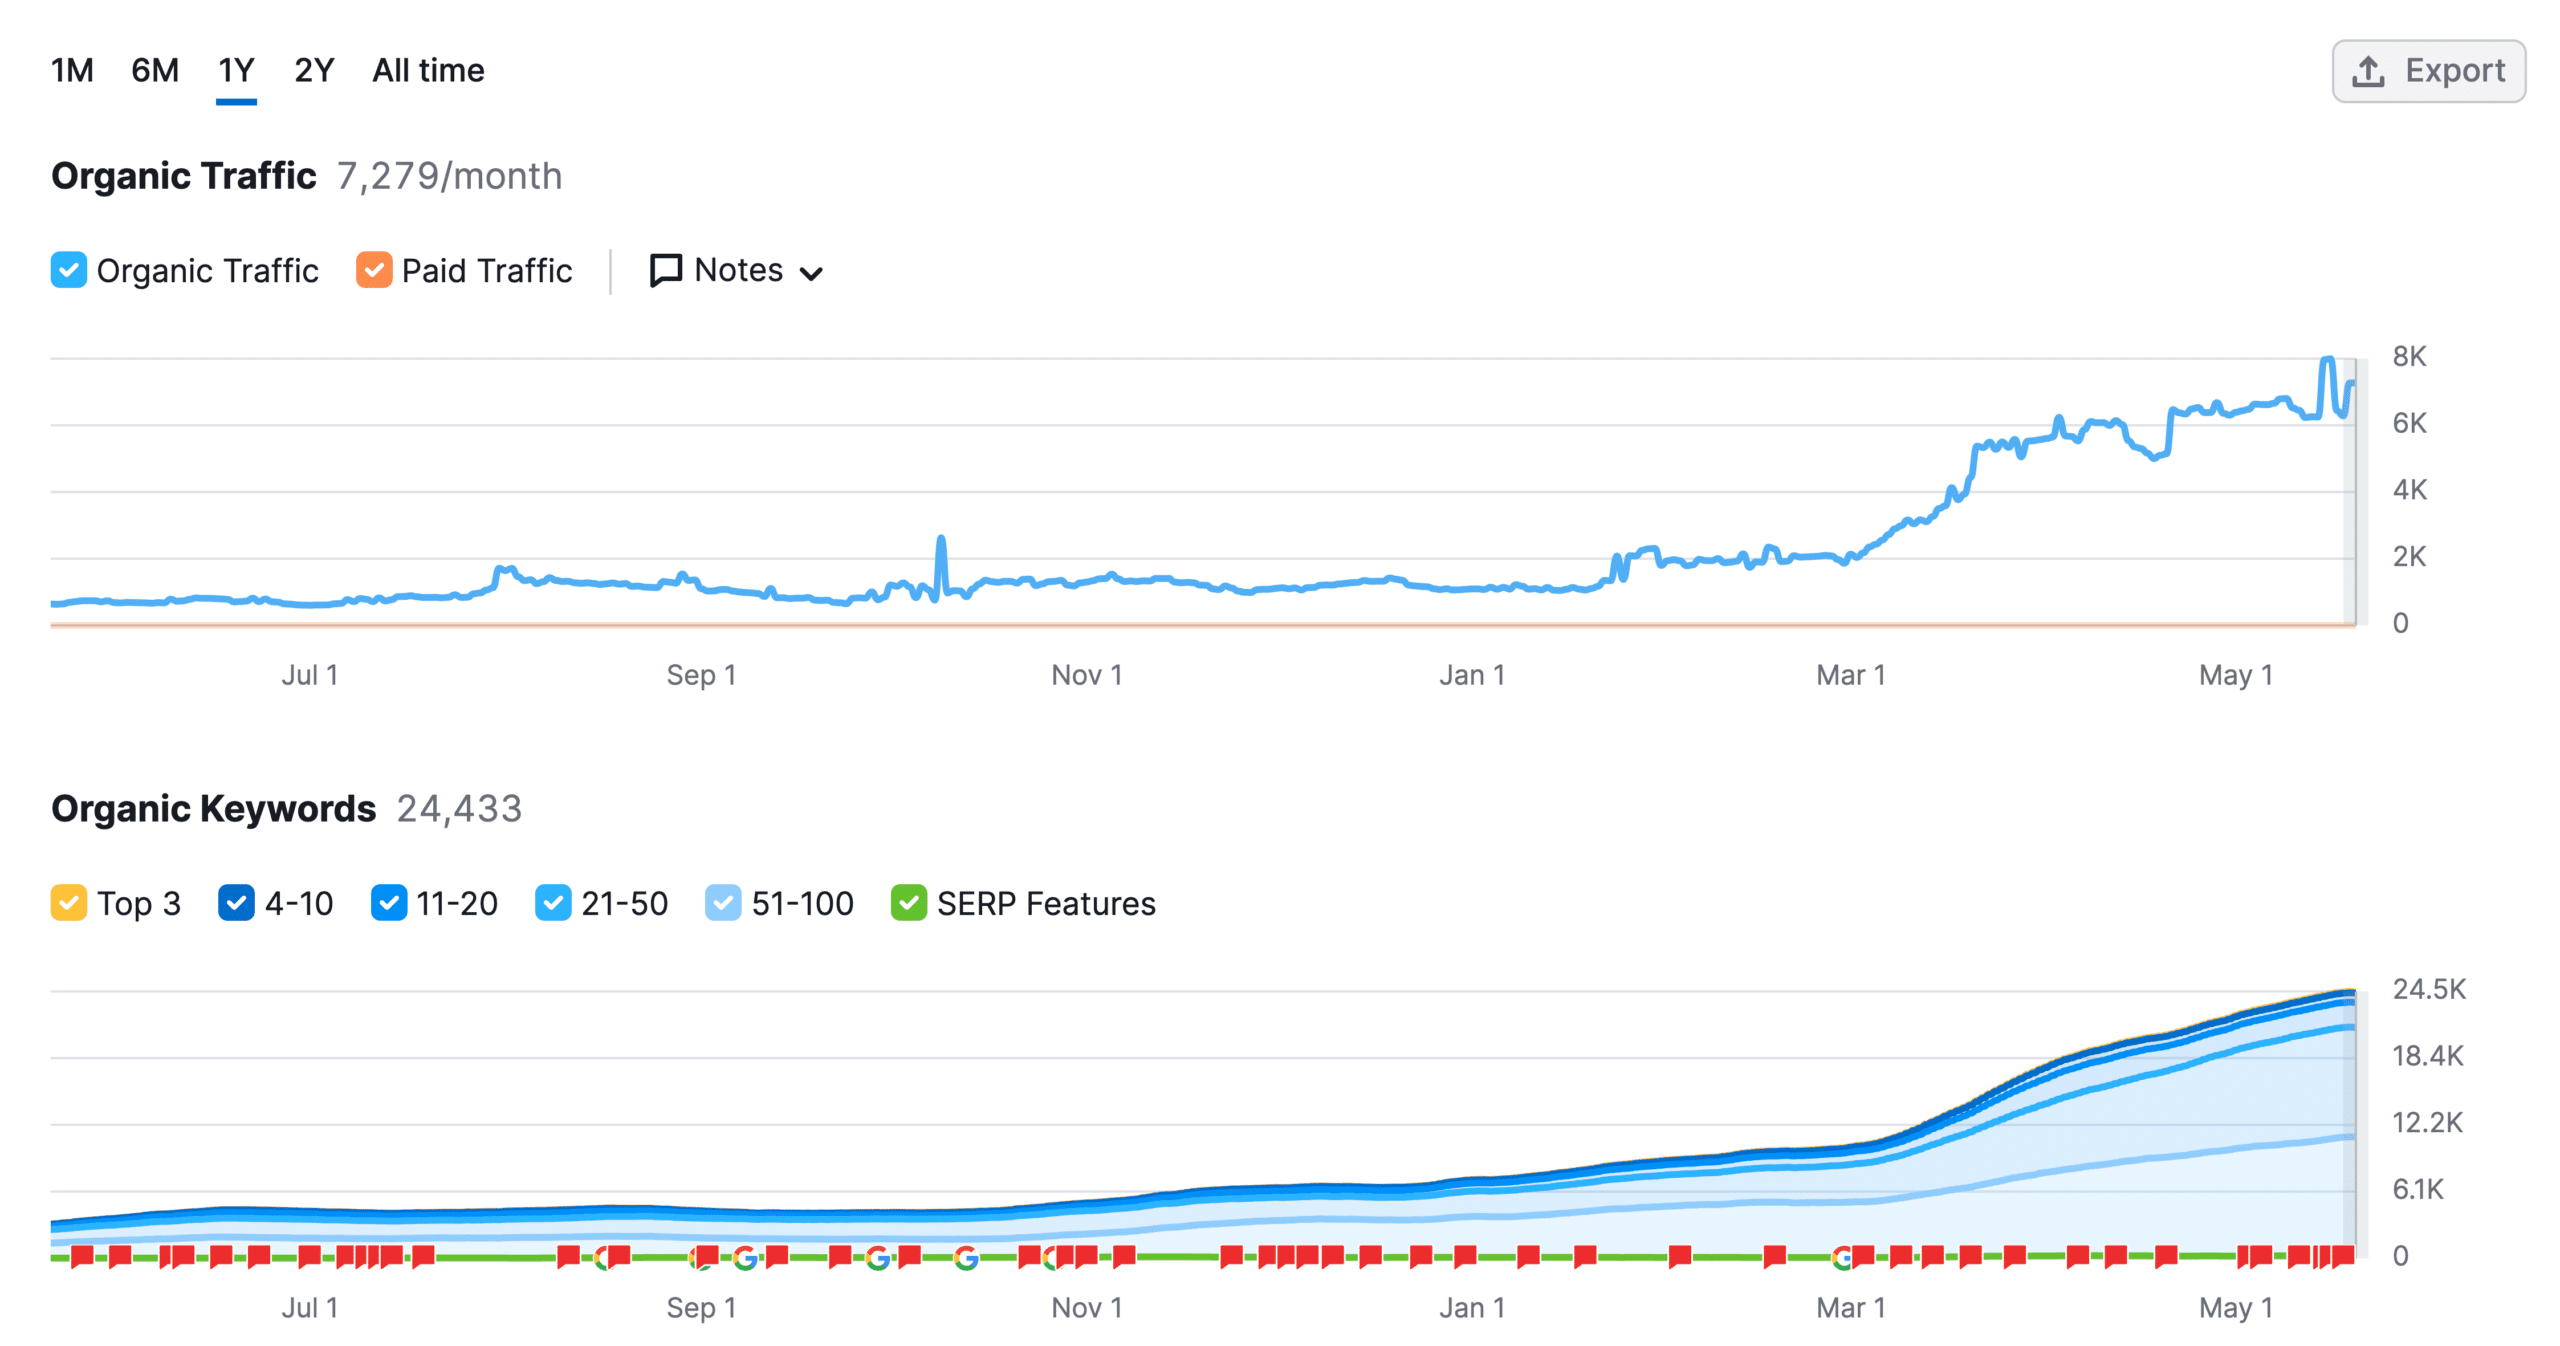
Our content auditing process is thorough and insightful, focusing on key performance indicators such as SEO effectiveness, engagement metrics, and the average time spent consuming content.
This detailed analysis allows us to clearly understand what aspects of your content strategy are resonating with your audience and what areas require refinement. This approach ensures that every piece of content is optimised for both performance and impact.
Ready to grow online? Start your project today.
Digital Content Creation Services
Voice Marketing Services
Staying ahead of the latest technology online means being ready when your customers change how they want to engage with your brand. Voice search in digital marketing is often overlooked, hence companies who add this into their marketing strategy can often find a bigger return compared to more competitive activities.
Animation Marketing Services
Animation offers a powerful tool in the realm of digital marketing, bringing concepts to life in an engaging and memorable way. Our Animation Marketing Services specialise in creating compelling animated content, perfect for corporate storytelling, product demonstrations, or just adding a dynamic flair to your digital presence.
Corporate Content Marketing Solutions
For businesses seeking to strengthen their brand in the corporate world, our Corporate Content Marketing Solutions offer a tailored approach. We focus on creating high-quality, professional content that resonates with a corporate audience.
Content Marketing Training
At ProfileTree, we offer comprehensive content marketing training designed to empower your team with the skills and knowledge necessary for successful content creation and strategy. Our training covers a wide range of topics, from the basics of content marketing to advanced techniques in creation, distribution, and analysis.
We delve into the art of crafting engaging written content, creating compelling visuals, and leveraging various digital platforms to maximise your content’s reach and impact. Our sessions are interactive and tailored to your business’s specific needs, ensuring that your team not only learns the theory but also understands how to apply these strategies effectively in real-world scenarios.
Local Content Marketing Solutions
Our Local Content Marketing Solutions are crafted to connect with local audiences throughout Northern Ireland, integrating regional insights and nuances into your content. This personalised approach ensures that your messaging is not only relevant but also resonates deeply with your local customer base, building a strong, loyal community around your brand.
Content Marketing Services - FAQs
Content marketing should go beyond generic videos or posts; it’s about creating material that genuinely represents your brand’s voice, values, and personality. Expect content that bridges the gap between brand awareness and audience value. The goal is to build trust, establish authority, and foster a connection that goes beyond mere promotion, encouraging long-term customer relationships.
In today’s digital world, content is king. Videos, blogs, podcasts, infographics – they’re everywhere. Here’s why your business needs to join in:
- Visibility: Without content, you’re invisible in search engines and social media
- Connection: It’s how modern audiences engage with brands
- Trust Building: Quality content shows expertise, building credibility
- Competition: Your rivals are doing it; don’t get left behind
- SEO: Content boosts your search rankings, driving more traffic
- Lead Generation: Content attracts and nurtures potential customers
Don’t let your business get left behind in the digital world.
Content creation costs vary widely based on type, quality, and production values: Here are some examples below.
- High-End: Videos with drone shots, VR, professional actors, or studio settings can be quite expensive
- Mid-Range: Professional blogs, standard videos, or custom infographics.
- Low-Cost: DIY options like smartphone videos, personal blogs, or using free design tools
- Free Tools: Canva for graphics, WordPress for blogs, YouTube for video hosting
- Time Investment: Even “free” options require your time to learn and create
We can guide you in choosing the right balance, showing you how to create impactful and affordable content or when to invest in higher-quality pieces for better ROI.
Absolutely! But success isn’t about volume; it’s about relevance and quality. Content marketing works when it’s:
- Tailored: Matches your audience’s needs and preferences
- Strategic: Aligns with your business goals (e.g., brand awareness, conversions)
- Diverse: Uses various formats (video, text, audio) for different learning styles
- Targeted: An animated video for complex topics, and case studies for B2B clients
- Consistent: Regular posting builds anticipation and habit
- Measurable: Using analytics to track engagement, leads, and sales
The key is understanding your audience and delivering what they need.
A successful content marketing strategy involves several phases:
- Analysis
- Planning
- Creating & Delivery
- Measurement & Adaptation
We offer tools, training and expertise for each phase, ensuring your strategy is data-driven, engaging, and results-oriented. Whether it’s using Google Analytics for tracking or Trello for scheduling, we’ll guide you to content marketing success.
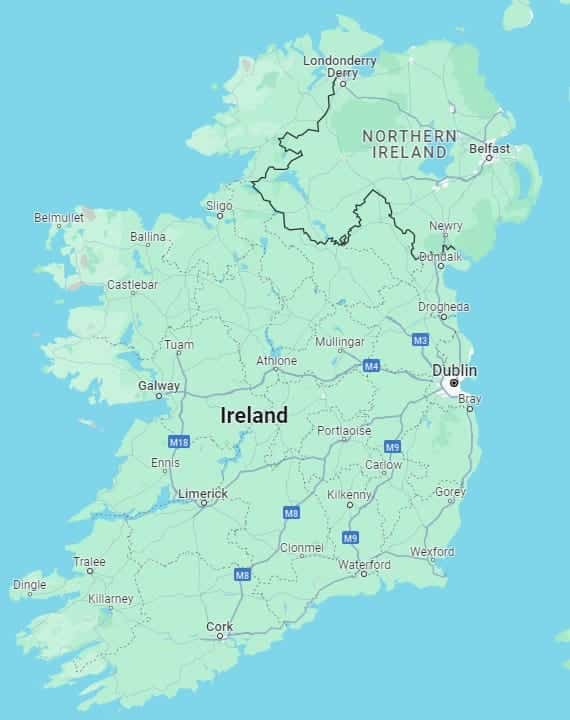
Northern Ireland Content Creation Agency
We’ve helped NI businesses across Omagh | Armagh | Newry | Lisburn | Ballymena and Bangor build a compelling presence that captures attention and interest. With us, your brand’s story will be one that people are eager to learn about and engage with.
Partnering with us means collaborating with an agency renowned for its track record of success. We’re not just about promising results; we demonstrate them. Our expertise lies in guiding you to achieve similar successes, whether through showcasing our proven strategies or by empowering you with the skills to create impactful content on your own.
Whether you’re looking to master content creation yourself or seeking our expert guidance to effectively reach your audiences, we’re here to assist. Get in touch today to see how we can help you get started on creating amazing content.

Web Design
We design stunning, user focused websites that present your brand beautifully and convert visitors into customers.

Web Development
We use the latest development tools to build websites that are optimised for peak performance at all times.

Website Hosting
We manage everything from site updates and reports to hosting, allowing you to focus on running your business.

Search Engine Optimisation
Using the latest SEO techniques, we help your brand get found for the right terms and by the right people.

Digital Marketing Strategy
Navigate the digital landscape with a marketing strategy. Our team crafts comprehensive plans that resonate with your target audience, drive engagement, and boost conversions.

Digital Marketing Training
Elevate your digital proficiency. Our in-depth training sessions equip your business with cutting-edge digital marketing techniques to outperform competitors and thrive online.

Social Media Strategy
Captivate and grow your social following. We create tailored social media strategies that ignite engagement, amplify your brand's online presence, and foster lasting connections.

Email Marketing Solutions
Harness the power of your mailing list. Our precision-targeted email marketing campaigns are engineered to nurture relationships and drive tangible business outcomes.

Content Marketing Services
Elevate your brand with our content marketing mastery. From thought-provoking blogs to eye-catching infographics, we craft content that captivates, informs, and converts your ideal audience.

Video Production
Capture your audience with compelling video content. Our production team creates visual stories that engage, inform, and leave a lasting impression.

Brand Storytelling
Bring your brand's story to life with authenticity. We craft compelling narratives that strike a chord with your audience, forging a powerful emotional bond with your brand.

Content Strategy Development
Strategic content that drives action. We develop content strategies that align with your business goals, ensuring every piece of content counts.

AI Training
Empower your business with AI expertise. Our tailored training demystifies AI, equipping your team with the knowledge to leverage its potential for growth and innovation.

AI Chatbots
Transform customer service with AI chatbots. We develop sophisticated chatbots that elevate user experience, streamline interactions, and deliver unparalleled efficiency.

AI Marketing
Transform your reach with AI-driven marketing. Harness data-driven insights for laser-targeted campaigns that captivate, engage, and convert your audience.

AI Tools for Business
Optimise your operations with cutting-edge AI tools. We integrate intelligent solutions that streamline processes, enhance efficiency, and support data-driven decision-making.
Join Our Mailing List
Grow your business with expert web design, AI strategies and digital marketing tips straight to your inbox. Subscribe to our newsletter.