150+ Social Media Statistics for 2026: UK, Ireland and Global Data
Table of Contents
There are now more than 5.66 billion active social media users worldwide. That figure means more than half the planet has a presence on at least one platform, and the average user is active across nearly seven of them each day. For businesses in Northern Ireland, Ireland and the wider UK, those numbers represent both an opportunity and a challenge: the audiences are there, but standing out requires a clear understanding of where people actually spend their time and what they respond to.
This guide compiles the most relevant social media statistics for 2026, covering platform usage, engagement benchmarks, advertising data and emerging trends. Where possible, we have highlighted data specific to the UK and Ireland, because the global averages from US-focused sources do not always reflect how British and Irish audiences behave online.
TL;DR: The Social Media Statistics That Matter Most in 2026
If you need the headline figures quickly, here they are.
| Metric | Global figure | UK figure |
|---|---|---|
| Total social media users | 5.66 billion | 57.1 million |
| Average platforms used per day | 6.75 | 6.1 |
| Average daily time on social media | 2 hours 21 minutes | 1 hour 46 minutes |
| Most used platform (monthly active users) | Facebook (3.07bn) | YouTube |
| Fastest growing platform | TikTok | TikTok |
| Share of internet users on social media | 70.6% | 84.3% |
Sources: DataReportal Global Digital Report 2026; Ofcom Online Nation 2025. Note for dev team: flag these figures for fact-check verification before publication; Ofcom figures should be confirmed against the most recent Online Nation report.
Global Social Media Usage Statistics
Social media crossed the 5 billion user milestone in 2023 and has continued to grow since. As of early 2026, DataReportal estimates the global user base at 5.66 billion, representing growth of roughly 4.8% year on year.
Key global usage figures:
- 5.66 billion people use social media globally (DataReportal, 2026)
- The average person uses 6.75 different social platforms per month
- Users spend an average of 2 hours and 21 minutes per day on social media
- Asia-Pacific accounts for the largest regional user base, with South and East Asia combined representing over 2.2 billion users
- Africa is the fastest-growing region in new user additions
One significant shift in 2025 and into 2026 is that pure growth has slowed in mature markets. In the UK, the US, and Western Europe, the focus has shifted from acquiring new users to retaining existing users and increasing engagement depth. This matters for businesses: platforms are responding by favouring content that keeps users on-site longer, with direct implications for the types of content that perform well organically.
Top Social Media Platforms Ranked by Active Users
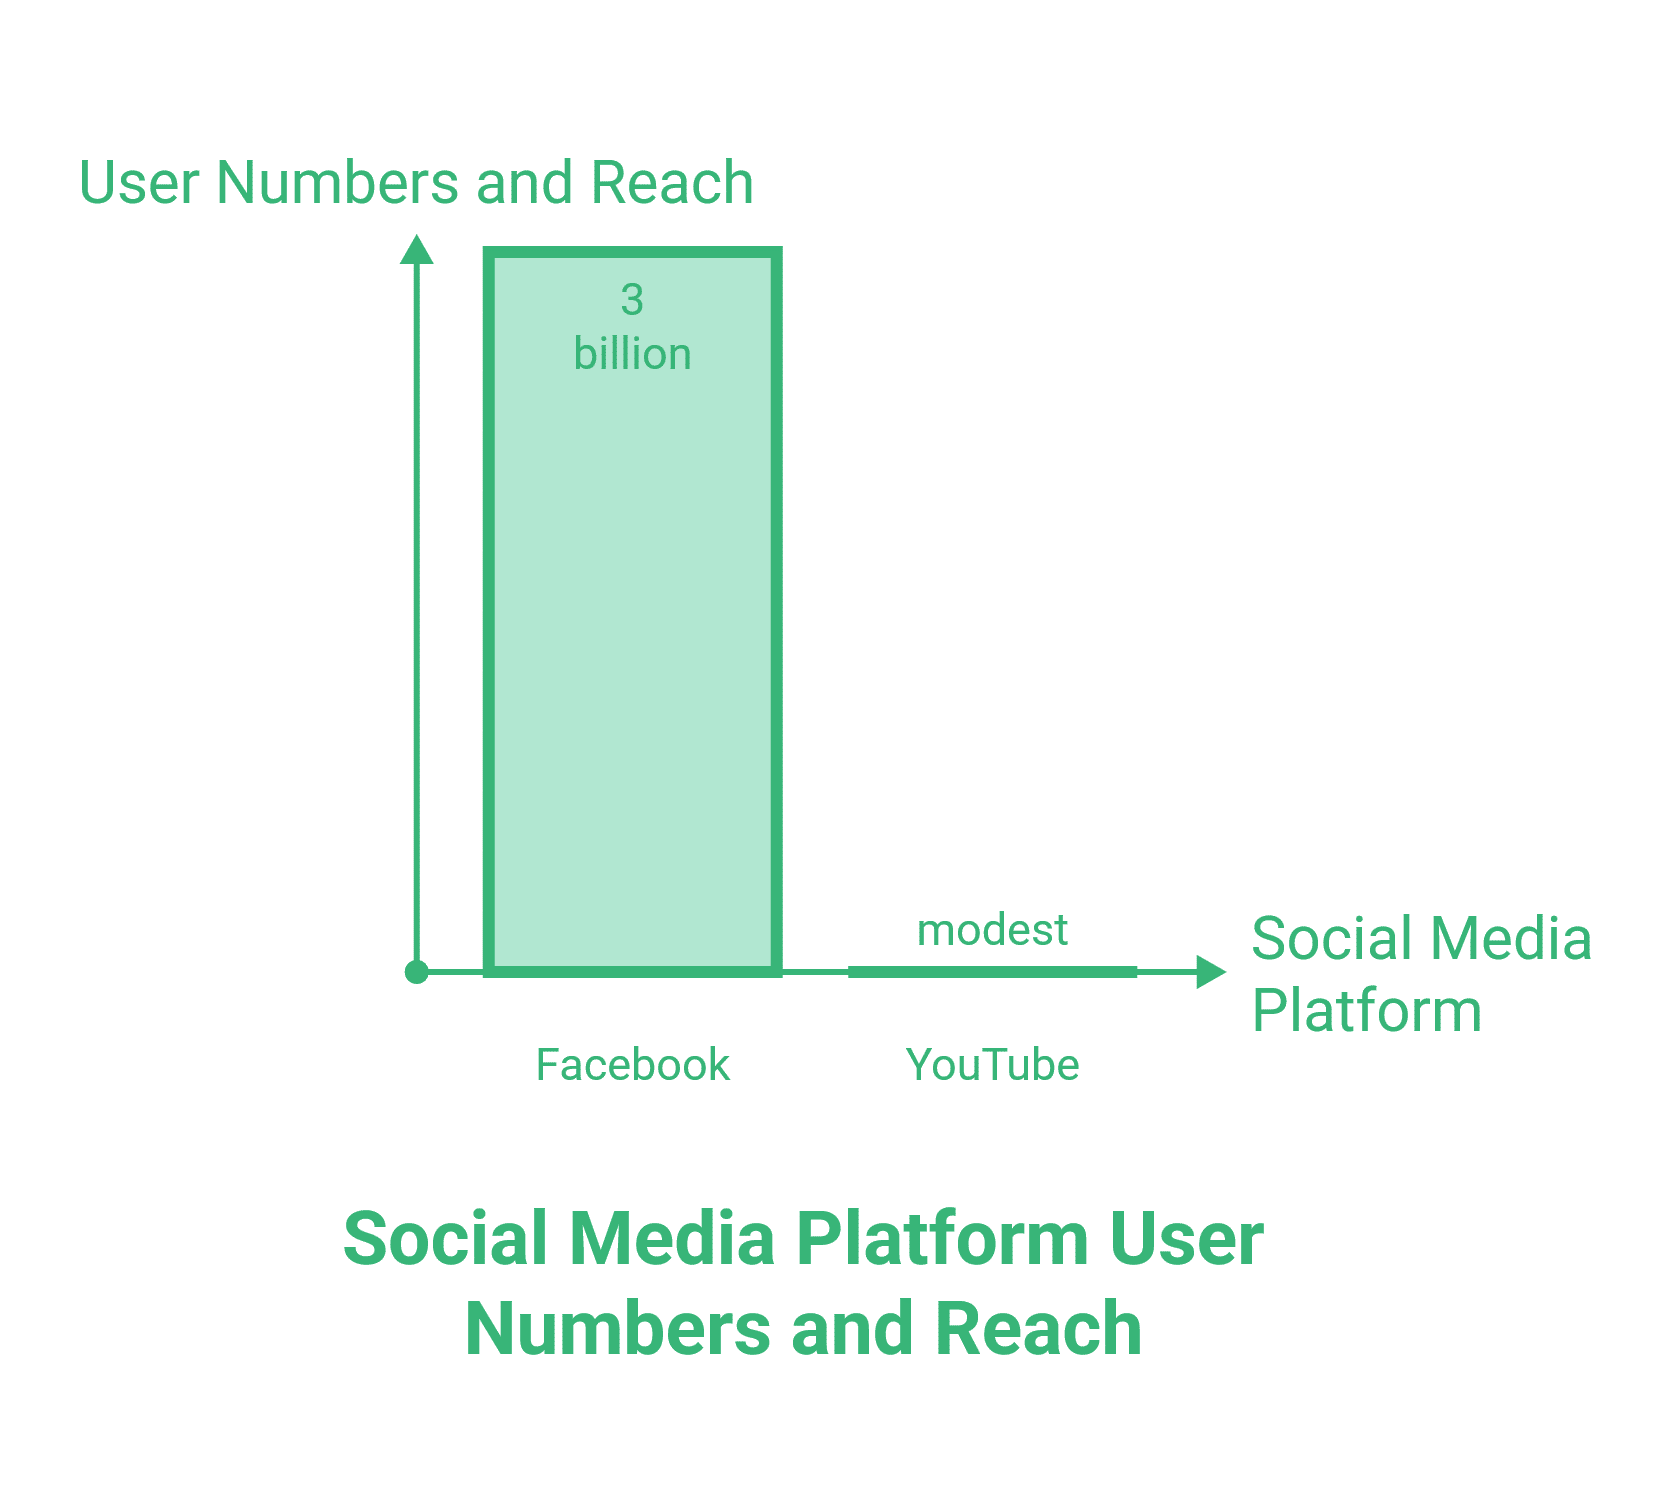
Not every platform deserves equal attention, and raw user numbers tell only part of the story. Facebook’s 3 billion users sounds impressive until you factor in that organic reach for business pages has fallen to a fraction of a percent. YouTube’s figures look modest by comparison until you remember it is also the world’s second-largest search engine.
The sections below cover the six platforms most relevant to businesses in Northern Ireland, Ireland and the UK. For each one, we have included the core usage figures, the demographic breakdown, and a short note on what the numbers actually mean for your content and advertising decisions.
Facebook remains the most-used social media platform globally by monthly active users, though its dominance among younger demographics has declined.
| Metric | Figure |
|---|---|
| Monthly active users | 3.07 billion |
| Daily active users | 2.11 billion |
| Largest age group | 25 to 34 (over 30% of users) |
| Average organic page post engagement rate | 0.07% |
| Daily video views | 4 billion+ |
What this means in practice: Facebook’s organic reach for business pages has declined sharply over the past four years. For most SMEs in Northern Ireland and Ireland, Facebook still delivers value through paid advertising, local community groups, and event promotion, rather than through standard page posts. Live video consistently outperforms static content and still commands an engagement rate of around 26%, higher than any other content type on the platform.
YouTube
YouTube sits in a category of its own. It functions simultaneously as a social platform, a search engine, and a content distribution network, making its statistics meaningfully different from those of every other platform on this list.
| Metric | Figure |
|---|---|
| Monthly active users | 2.70 billion |
| Daily active users | 122 million |
| Hours of video uploaded per minute | 500 hours |
| Average daily watch time per user | Over 60 minutes |
| Most dominant age group | 25 to 34 |
For businesses, YouTube’s search engine function is particularly valuable. It is the second-largest search engine in the world after Google, and YouTube videos often rank in Google search results as well. ProfileTree’s YouTube marketing services are specifically designed to help SMEs in Northern Ireland and the UK build a channel presence that generates consistent organic traffic, rather than treating YouTube as a place to upload and hope.
| Metric | Figure |
|---|---|
| Monthly active users | 2.4 billion |
| Daily active users | 990 million |
| Dominant age group | 18 to 29 (71% of users) |
| Reels average reach vs standard posts | 22% higher |
| Sponsored post engagement vs organic | 8x higher |
Instagram continues to shift toward short-form video as its primary growth driver. Reels now receive significantly higher organic reach than static image posts, a deliberate algorithmic shift by Meta to compete with TikTok. For product-based businesses and service companies with visual output (interior design, food, fitness, hospitality), Instagram remains one of the most cost-effective organic channels, provided the content strategy centres on Reels and Stories rather than static grid posts.
TikTok
| Metric | Figure |
|---|---|
| Monthly active users | 1.5 billion+ |
| Average monthly time per user | 31+ hours |
| Ad reach growth (year on year) | 12.6% |
| CTA videos: conversion rate uplift | Up to 152% |
| Dominant age group | Under 30 (47.4% of users) |
TikTok’s growth among over-25s is the most significant trend for businesses to watch. While it began as a platform for younger audiences, its user base has broadened considerably, and its algorithm’s willingness to surface content from small or new accounts to large audiences makes it one of the few remaining platforms where organic reach is genuinely achievable without a large existing following.
| Metric | Figure |
|---|---|
| Monthly active users | 310 million |
| Daily active users | 141 million |
| Dominant age group | 25 to 34 (60% of users) |
| B2B marketers using LinkedIn | 91% |
| B2C marketers using LinkedIn | 96% |
LinkedIn is the primary platform for B2B marketing in the UK and Ireland, particularly for professional services firms, technology companies, and businesses targeting decision-makers. Unlike most social platforms, LinkedIn’s organic reach has actually improved for content that generates genuine discussion. Long-form posts, opinion pieces, and data-led content perform substantially better than promotional announcements.
X (formerly Twitter) and emerging platforms
X’s monthly active user figures have been disputed since the platform changed ownership, with estimates ranging from 300 million to 550 million depending on the methodology. What is clear is that engagement rates have declined for most business accounts, and ad spend on X has fallen among major brands. For most SMEs, X now plays a secondary role in the social media mix, most useful for real-time commentary, customer service responses, and press visibility rather than as a primary content channel.
Threads, launched by Meta in 2023, has grown to over 300 million registered users but has yet to demonstrate strong engagement rates for business content. Mastodon and Bluesky remain niche platforms with limited reach for commercial content.
UK and Ireland Social Media Statistics
This is the section that most global statistics guides miss entirely. The UK and Ireland market has distinct characteristics that affect how businesses should allocate their social media budgets and time.
United Kingdom
- 57.1 million social media users in the UK as of early 2026 (DataReportal)
- UK users spend an average of 1 hour 46 minutes per day on social media, below the global average of 2 hours 21 minutes (Ofcom Online Nation)
- YouTube is the most visited social platform among UK adults
- Facebook reaches 73% of UK internet users monthly
- LinkedIn has over 36 million registered users in the UK, one of the highest penetration rates in Europe
- TikTok’s UK user base exceeded 20 million in 2025
Ireland
- 3.9 million social media users in Ireland (DataReportal)
- Irish users show higher-than-average LinkedIn adoption relative to population size, reflecting the concentration of tech and professional services firms
- Facebook retains a stronger hold on older demographics in Ireland compared to the UK
Northern Ireland context
Northern Ireland businesses operate in a market that bridges UK and Irish consumer behaviours. Facebook and YouTube are the dominant platforms for reaching local audiences, but LinkedIn is critical for B2B firms targeting clients across both jurisdictions. The digital marketing landscape in Northern Ireland is also shaped by funding programmes from Invest NI and the UK Shared Prosperity Fund, several of which support digital skills development and social media capability-building for SMEs.
ProfileTree, based in Belfast, works with businesses across Northern Ireland, Ireland and the UK to develop social media strategies that reflect these regional differences, rather than applying global benchmarks that do not translate to local market conditions.
Social Media Engagement Benchmarks
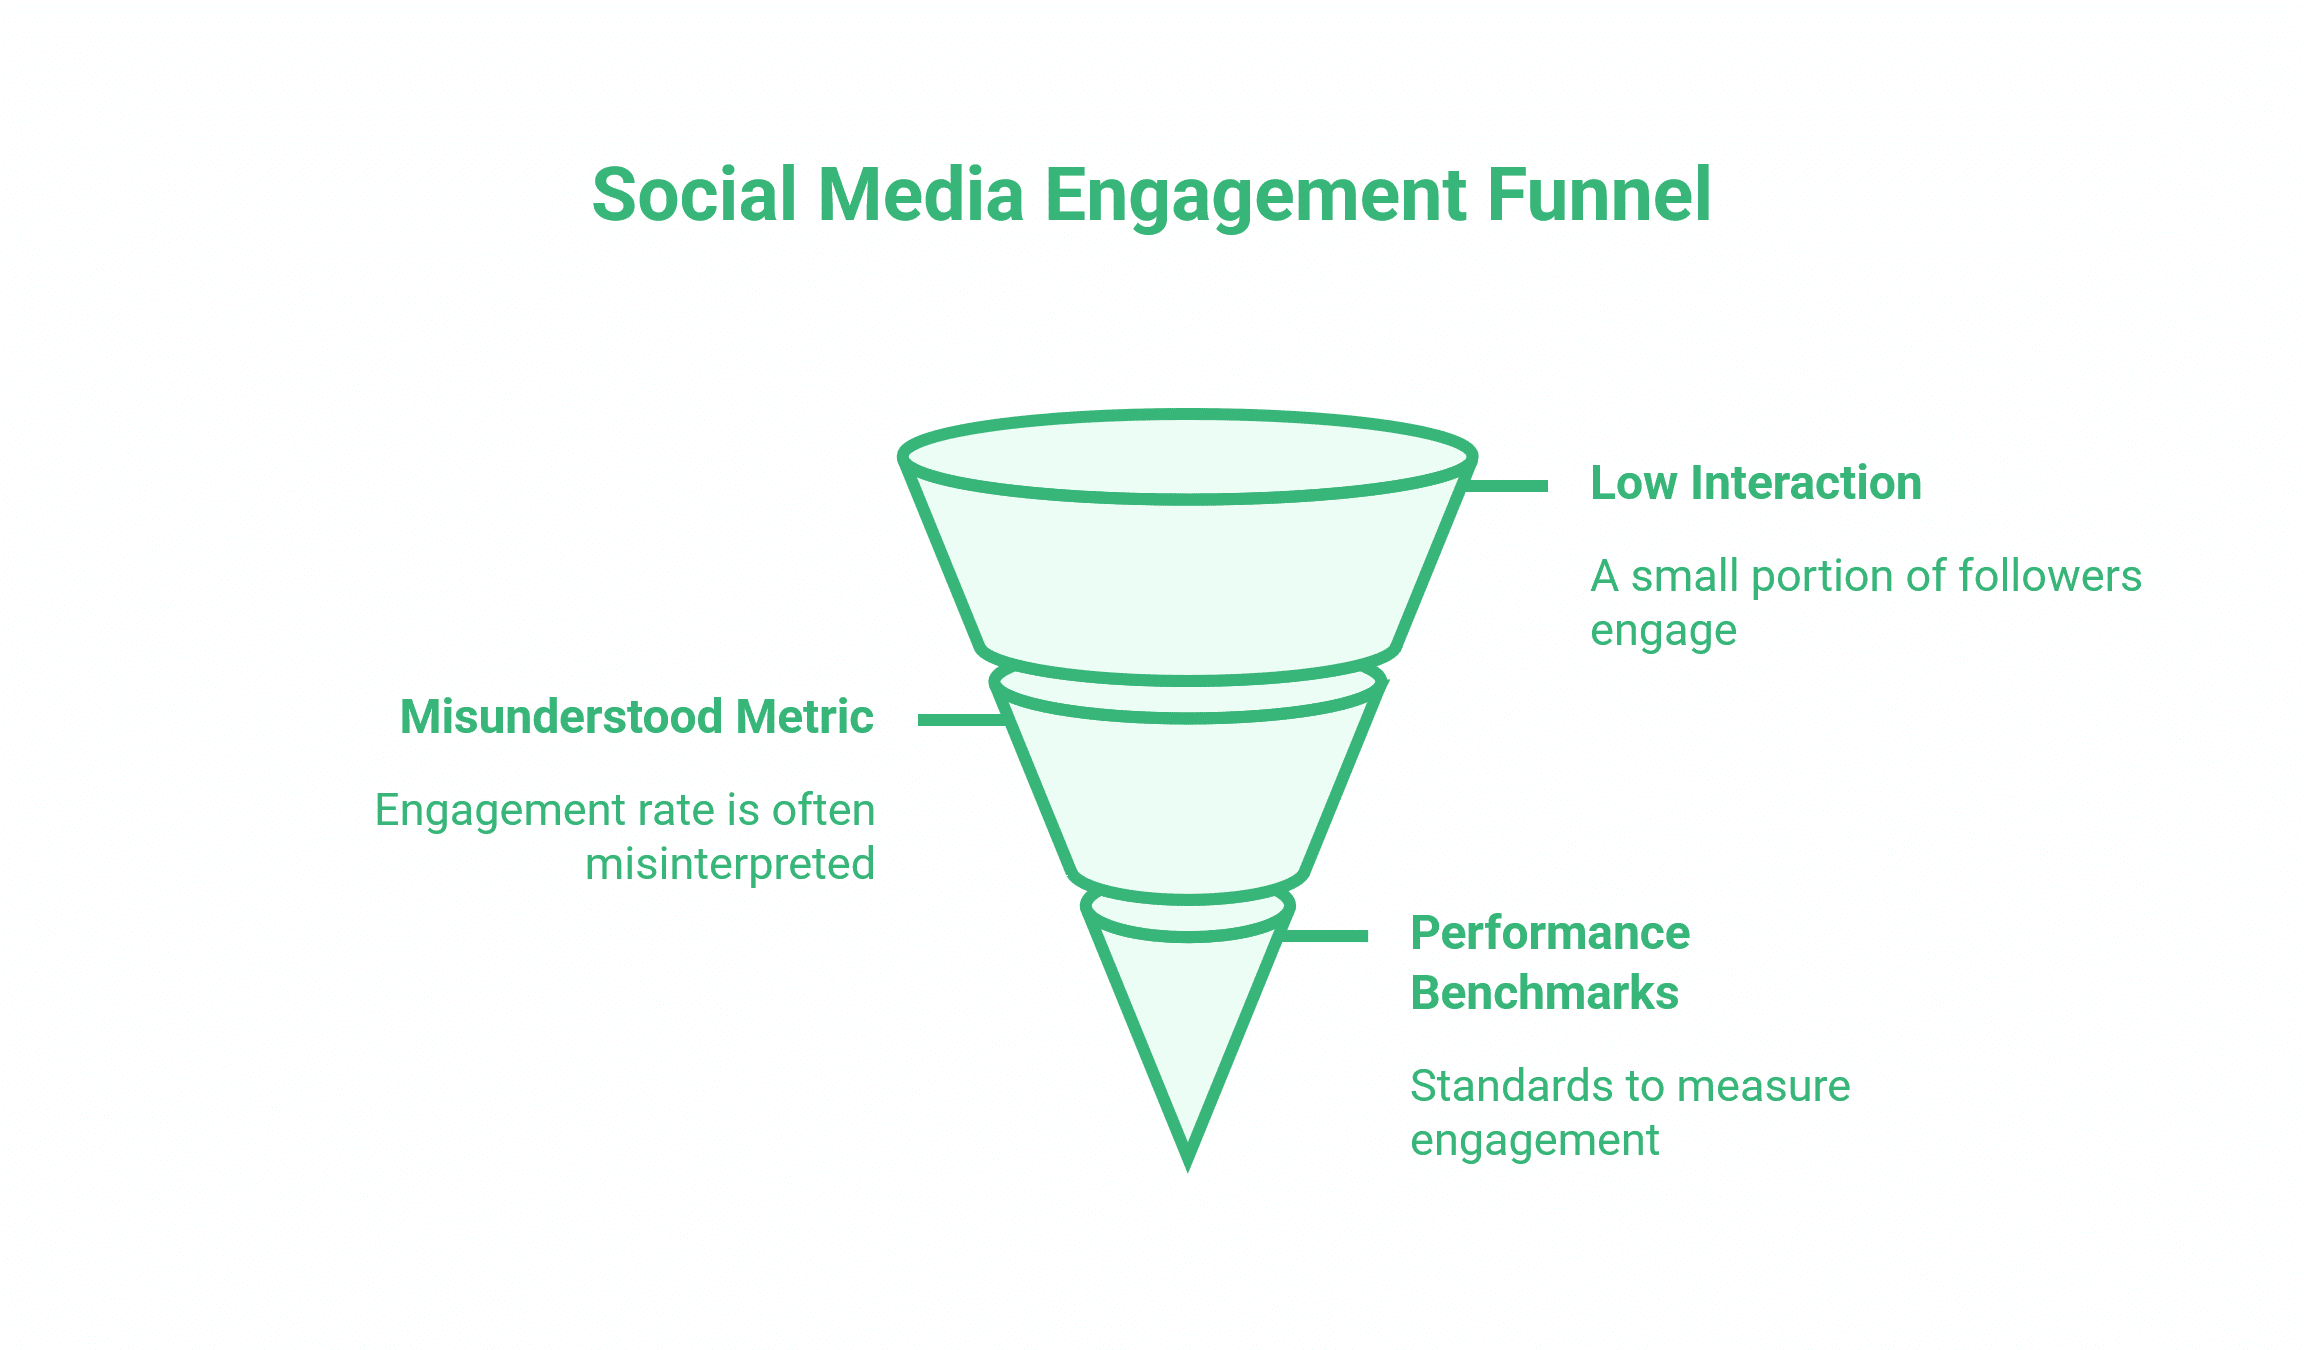
Engagement rate is one of the most commonly misunderstood metrics in social media. A high number of followers means nothing if a fraction of them interact with your content. These are the benchmarks against which to measure your performance.
| Platform | Average organic engagement rate | What counts as good |
|---|---|---|
| Facebook (page posts) | 0.07% | 0.1% or above |
| Instagram (posts) | 0.43% | 1% or above |
| Instagram (Reels) | 1.23% | 2% or above |
| TikTok | 2.65% | 4% or above |
| LinkedIn (company pages) | 0.35% | 1% or above |
| X (formerly Twitter) | 0.029% | 0.05% or above |
Source: Rival IQ Social Media Industry Benchmark Report 2025; RightMetric. Note for dev team: flag for verification against the most recent Rival IQ report.
These benchmarks vary significantly by industry. Retail and hospitality brands typically see higher Instagram engagement than professional services firms, while B2B companies often outperform their sector peers on LinkedIn.
Content types by engagement performance
Across platforms, video consistently outperforms static content. Within video, short-form (under 90 seconds) outperforms long-form for reach, while long-form retains viewers for longer and performs better for search visibility on YouTube. The practical implication for businesses: a content strategy that includes a mix of short-form Reels or TikToks for reach, and longer YouTube videos for search-driven discovery, tends to outperform single-platform approaches.
82% of marketers repurpose content across multiple social channels, which is one of the more practical statistics in this guide. A single video production session can generate a YouTube video, three to five short-form clips, an audio extract, and a series of still frames. ProfileTree’s video production team in Belfast regularly structures shoots this way for SME clients, producing content assets that span multiple platforms without requiring separate production budgets for each platform.
Social Media Advertising and ROI Statistics
Organic reach has declined across every major platform over the past five years. For most businesses, paid social media advertising now plays a necessary role in reaching audiences beyond an existing following.
| Metric | Figure |
|---|---|
| Average social media CPM (cost per 1,000 impressions) | $5.33 (Q4 2023 benchmark) |
| Average CTR for social media ads | 1.36% |
| Share of marketers using paid social distribution | 85% |
| Facebook local business page views (weekly) | 70%+ of Facebook users view at least one |
| B2B leads generated via LinkedIn vs other platforms | LinkedIn generates 80% of B2B social media leads |
Note for dev team: CPM and CTR figures are sourced from Q2 2023 benchmarks in the original article. These should be verified against current data from a source such as Statista or WordStream’s paid social benchmark report before publication.
Social media advertising: what works for UK SMEs
The most common error SMEs make with social media advertising is targeting too broadly and measuring too loosely. Facebook and Instagram’s ad platforms allow granular geographic and demographic targeting, which means a Belfast-based business can reach specifically Northern Irish audiences rather than paying for impressions across the UK or Ireland.
LinkedIn advertising carries a higher CPM than Facebook or Instagram, but for B2B businesses where a single converted lead can represent thousands of pounds in revenue, the cost per acquisition can still justify the spend. The key is matching the platform to the customer journey stage: LinkedIn for awareness and decision-maker targeting, Facebook and Instagram for retargeting and conversion.
ProfileTree’s digital marketing strategy service includes social media advertising planning as part of broader campaign management, covering platform selection, audience targeting, budget allocation and performance reporting.
Video Content Statistics
Video content now accounts for the majority of time spent on social media across every major platform. These are the figures that should inform any content strategy discussion in 2026.
- Short-form video (under 90 seconds) generates the highest reach-per-post of any content type on Instagram, TikTok and Facebook
- YouTube Shorts now generates over 70 billion daily views
- Videos on LinkedIn generate five times more engagement than text posts
- 87% of marketers report a positive ROI from Video Marketing (Wyzowl State of Video Marketing 2024)
- Adding a video to a landing page increases conversion rates by an average of 80% (Wyzowl; note for dev team: verify this figure)
- 50% of TikTok users have purchased a product after seeing it promoted in a LIVE event on the platform
The practical implication for businesses is that video is no longer a “nice to have” element of a content strategy; it is the primary format that platforms reward with organic reach. The barrier to entry, however, is lower than many SMEs assume. Professional-quality short-form content can be produced efficiently with the right planning, and a well-structured shoot can generate weeks of content from a single session.
Social Media Demographics and Shifting User Habits
Understanding which audiences use which platforms, and how their habits are changing, is more useful than raw user counts. Here are the patterns that matter most for businesses in 2026.
Gen Z and intentional screen time reduction
A notable trend of 2024 and 2025 has been the growing number of younger users actively managing their social media time. Gen Z users (born 1997 to 2012) are more likely than any other demographic to use screen time management tools, take deliberate breaks from platforms, and migrate toward smaller, more private communities such as Discord servers, WhatsApp groups and Reddit communities.
This does not mean Gen Z has left social media. It means their relationship with it has changed. They are less likely to passively scroll a feed and more likely to seek out specific content creators, communities and interests. For businesses trying to reach this demographic, broadcast-style content marketing is less effective than content that builds genuine community or responds to specific interests.
Millennial and Gen X platform preferences
Millennials (born 1981 to 1996) remain the most commercially significant demographic on social media for most B2C businesses. They are the largest active user group on Facebook, Instagram and LinkedIn, and they have the highest purchasing power of any social media age group. They are also the demographic most likely to use social media to research purchases before completing them, making consistent, informative content more valuable than purely promotional posts.
Gen X (born 1965 to 1980) is an underserved demographic in social media marketing. Their usage skews heavily toward Facebook and YouTube, and their willingness to engage with longer content makes them well-suited to video-led content strategies. Many SMEs ignore this demographic in their social media planning, creating a genuine competitive advantage for businesses willing to target them deliberately.
Social commerce and older demographics
Social commerce, the ability to purchase products directly within a social platform without leaving the app, is growing fastest among audiences over 45. This is a counterintuitive finding for many marketers who associate social commerce with younger users, but it reflects the convenience factor: older consumers who are comfortable with online purchasing find the reduced friction of in-app purchasing appealing.
For product-based businesses, this has practical implications for Facebook Shop and Instagram Shopping integration.
What These Statistics Mean for Your Business
Statistics are only useful if they inform decisions. Here is how the figures in this guide translate into practical priorities for SMEs in Northern Ireland, Ireland and the UK.
Choose platforms based on your audience, not the biggest numbers. Facebook’s 3 billion users do not mean it is the right platform for your business. A B2B professional services firm in Belfast will almost always see better returns from LinkedIn than from TikTok, regardless of TikTok’s growth figures. Map your target customer profile to the platforms where that demographic actually spends time.
Organic reach requires video. Across every platform, video content receives significantly higher algorithmic distribution than static posts. If your current social media strategy is primarily text and image-based, you are working against the grain of how every major platform now distributes content.
UK and Irish audiences behave differently from global averages. The benchmarks you see cited in US-focused marketing publications — engagement rates, ad costs, content performance — do not always translate directly to British and Irish markets. UK users spend less time on social media per day than the global average, which means content needs to earn attention faster. Platform preferences also vary: YouTube is more dominant in the UK than many social media guides suggest.
Paid social is not optional for reach, but it should be targeted. Broad social media awareness campaigns rarely deliver acceptable returns for SMEs with limited budgets. Tight geographic and demographic targeting, particularly on Facebook and LinkedIn, combined with retargeting audiences who have already visited your website, typically delivers a better cost per acquisition than untargeted reach campaigns.
Digital training closes the gap between knowing and doing. Many SMEs in Northern Ireland understand they need a better social media strategy but lack the internal capability to execute one consistently. ProfileTree Academy offers digital training for business owners and marketing teams, covering social media strategy, content creation, and analytics, equipping them to manage social media more effectively in-house rather than relying entirely on outsourced management.
Conclusion
Social media in 2026 is not a single channel; it is a collection of distinct platforms, each with its own audience, content format and commercial logic. The statistics in this guide point to a clear direction: video content drives organic reach, UK and Irish audiences behave differently from global averages, and organic-only strategies require genuine commitment to sustain results.
For SMEs in Northern Ireland, Ireland and the UK, the most useful thing these figures can do is inform prioritisation. Not every platform is worth your time, and not every trend applies to your audience. Understanding the benchmarks gives you a baseline; building the right strategy around them is where the real work begins.
ProfileTree works with businesses across Belfast, Northern Ireland and the wider UK on social media strategy, content creation, video production and digital training. If you want to move from tracking statistics to acting on them, our team can help.
FAQs
What is the most used social media platform in 2026?
Facebook remains the most-used platform globally with 3.07 billion monthly active users. In the UK, YouTube has the highest reach among adults, though Facebook is close behind. The dominant platform varies by age group: TikTok leads among under-25s, LinkedIn among professional audiences.
How much time does the average person spend on social media?
Globally, the average is 2 hours and 21 minutes per day. UK users spend slightly less, at around 1 hour 46 minutes, according to Ofcom. Figures vary significantly by age, with younger users spending considerably more time than older demographics.
What are the most popular social media platforms in the UK?
YouTube, Facebook, Instagram and TikTok are the four most widely used platforms among UK adults. LinkedIn has strong professional penetration with over 36 million UK registered users, and Snapchat retains a significant share among under-30s.
What is a good social media engagement rate?
It depends on the platform. For Instagram posts, 1% or above is solid; for Reels, aim for 2% or higher. LinkedIn company pages at 1% are performing well. Facebook page posts above 0.1% are reasonable given the limitations of organic reach. Industry sector also affects what counts as a strong result.