7 Digital Marketing KPIs Every UK Business Should Track
Table of Contents
Most UK businesses are tracking the wrong things. They’re watching follower counts and page impressions while their actual profitability numbers go unmeasured. Digital marketing KPIs — key performance indicators — exist to cut through that noise and connect your marketing activity to business outcomes.
This guide covers the seven KPIs that matter most for UK SMEs, with plain-English formulas, UK industry benchmarks, and a practical section on presenting these figures to a board that doesn’t want to hear about bounce rates.
Value vs Vanity: Know the Difference
| Vanity Metric | What It Looks Like | Real KPI | What It Proves |
|---|---|---|---|
| Social media followers | 10,000 Instagram followers | Customer Acquisition Cost | £42 to acquire each paying customer |
| Page impressions | 50,000 monthly views | Conversion Rate | 2.1% of visitors become leads |
| Email list size | 8,000 subscribers | Cost Per Lead | £18 per qualified enquiry |
| Likes and shares | 500 post engagements | Return on Ad Spend | £3.80 returned per £1 spent |
Vanity metrics look good in reports. Real KPIs inform decisions. The seven below are in the second category.
The 7 Digital Marketing KPIs
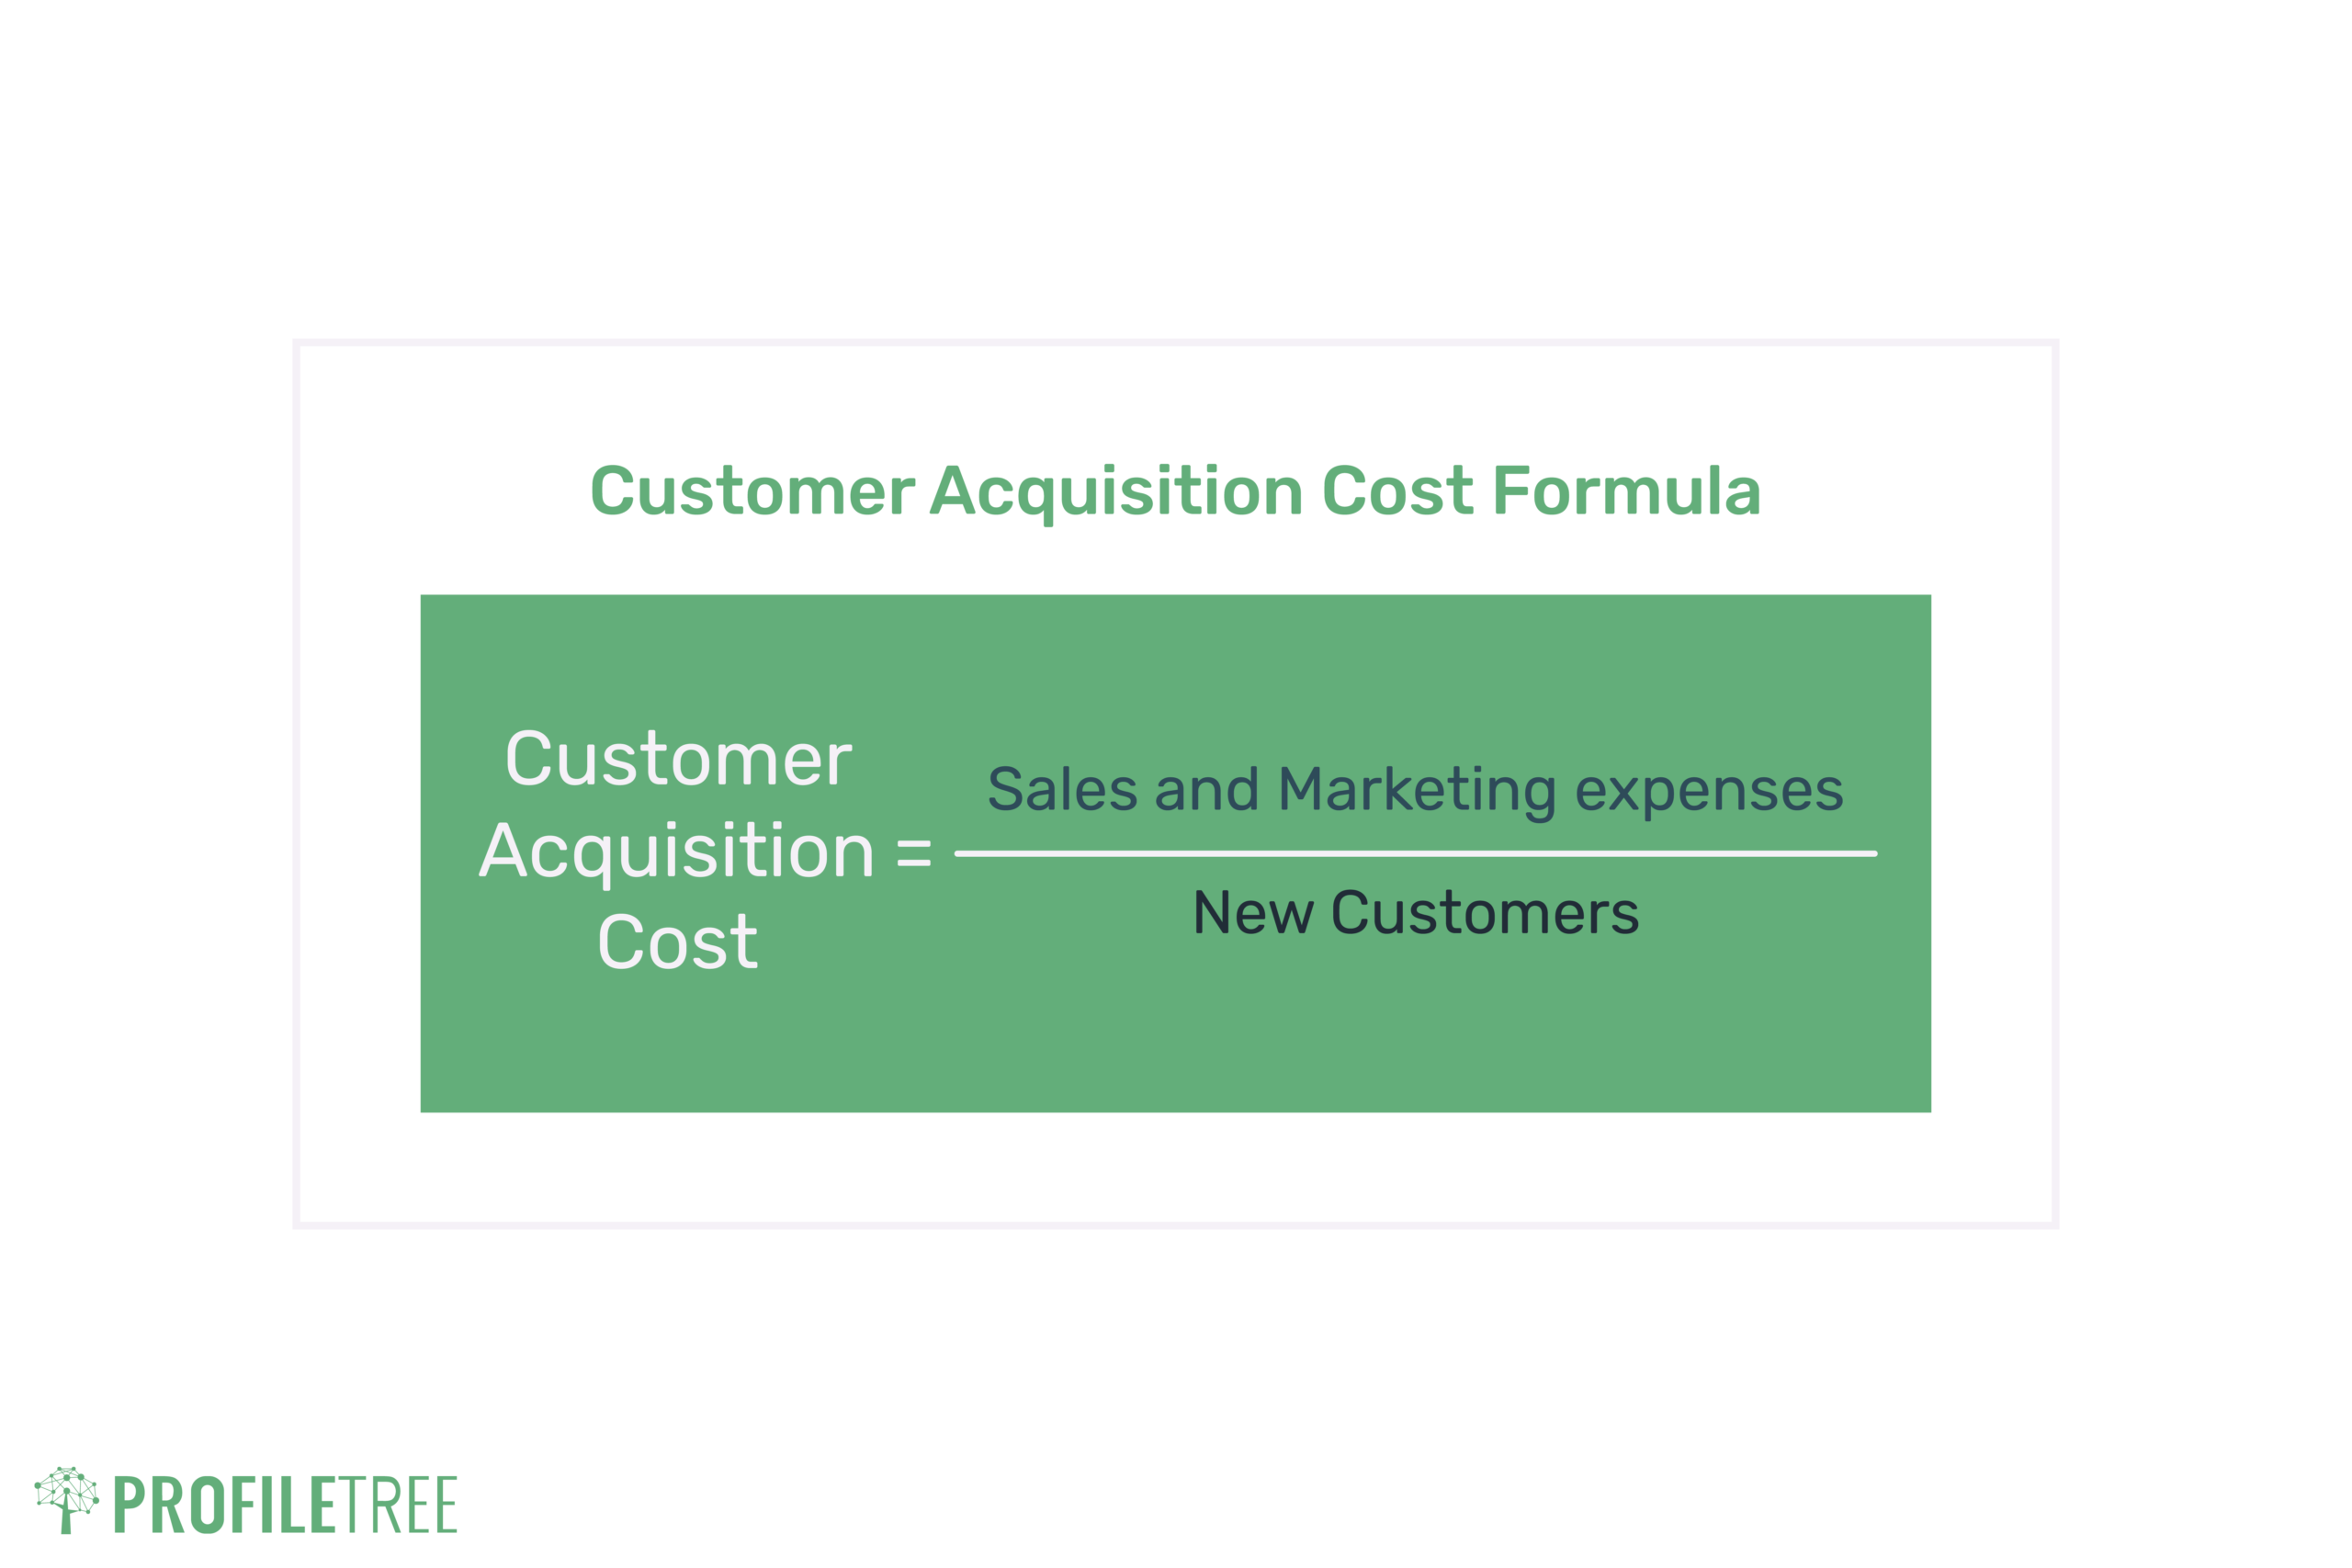
1. Customer Acquisition Cost (CAC)
CAC tells you exactly what it costs to bring in one paying customer. It’s one of the most directly useful figures in marketing because it can be compared immediately against average order value or customer lifetime value.
Formula: CAC = Total marketing spend ÷ Number of new customers acquired
Example: If you spend £12,000 on marketing in a quarter and acquire 85 new customers, your CAC is £141.
UK benchmarks vary significantly by sector. Professional services typically see CAC ranging from £80 to £300, depending on deal complexity. E-commerce can run from £15 to £60. If you’re launching a new service or entering a new market, expect CAC to be unrepresentative for the first two to three months — there’s simply no baseline to measure against yet.
For any business seeking investment, a low CAC relative to average revenue per customer is one of the clearest indicators of commercial efficiency you can present.
2. Return on Ad Spend (ROAS)
ROAS measures the direct revenue return from paid advertising. It’s the metric most board members instinctively understand because it frames marketing as an investment with a measurable return.
Formula: ROAS = Revenue attributed to ads ÷ Total ad spend
A ROAS of 4:1 means every £1 in paid media returned £4 in revenue. A ROAS of 1:1 means you broke even. Below 1:1, you lose money.
UK context: A reasonable baseline ROAS target for most UK SMEs is between 3:1 and 5:1, though this varies by margin. A retailer running on 15% margins needs a much higher ROAS than a professional services firm billing at 60% margins. One important caveat: AI-driven bidding strategies in Google Ads and Meta Ads now optimise toward a target ROAS automatically, but they require sufficient conversion data (typically 30 to 50 conversions per month) to function accurately. Below that threshold, manual bidding often outperforms automated strategies.
3. Conversion Rate
Conversion rate measures the percentage of visitors to a page or campaign who take a desired action — completing a purchase, submitting an enquiry form, or booking a call.
Formula: Conversion Rate = (Conversions ÷ Total visitors) × 100
UK benchmarks by sector (source: WordStream UK data):
| Sector | Average Conversion Rate |
|---|---|
| Professional Services | 3.0% – 5.0% |
| E-commerce (retail) | 1.5% – 3.5% |
| Finance | 5.0% – 10.0% |
| Construction & trades | 2.0% – 4.0% |
| Technology / SaaS | 1.0% – 3.0% |
A low conversion rate often points to a landing page problem rather than a traffic problem. If you’re paying to send visitors to a page and most of them leave immediately, the issue is usually page design, load speed, or a mismatch between the ad message and the page content.
4. Customer Lifetime Value (CLV)
CLV is the total revenue you can expect from a single customer over the course of their relationship with your business. It’s arguably the most strategically important KPI on this list because it determines how much you should be willing to spend on acquisition.
Formula: CLV = Average order value × Purchase frequency × Average customer lifespan
B2B example: A marketing agency client who pays £1,200 per month for 18 months has a CLV of £21,600. If your CAC for that client type is £800, that’s a strong return.
B2C example: A local gym member paying £45 per month who stays for 2 years has a CLV of £1,080. If you’re spending £90 to acquire each member, you’re spending 8.3% of CLV on acquisition — typically acceptable for a subscription business.
Understanding CLV shifts the CAC conversation. A business with a high CLV can afford a higher CAC because the long-term return justifies the upfront cost. This is a point worth making explicitly when presenting marketing budgets for approval.
5. Click-Through Rate (CTR)
CTR measures how often people who see your content or ad click on it. It applies to paid ads, organic search results, and email campaigns, though the benchmarks differ significantly across each.
Formula: CTR = (Clicks ÷ Impressions) × 100
UK benchmarks:
- Google Search Ads: 3% – 6% average CTR across most sectors
- Google organic results (position 1): 25% – 35%
- Email marketing: 2% – 4% average CTR for UK B2B; 1% – 2% for B2C
A low CTR on paid ads usually signals a relevance problem — the ad copy doesn’t match what the audience is searching for or expecting. A low CTR in organic search suggests your title tag or meta description isn’t compelling enough relative to the competing results on the page.
When presenting CTR to non-marketing audiences, frame it as “creative engagement” or “relevance score.” The underlying concept translates clearly; the acronym doesn’t.
6. Cost Per Lead (CPL)
CPL measures the average cost of generating a single qualified enquiry, regardless of whether that enquiry converts to a sale.
Formula: CPL = Total marketing spend ÷ Number of leads generated
CPL is more useful than raw lead volume. A campaign that generates 200 leads at £5 each looks impressive until you discover that 180 of them are completely unqualified. A campaign that generates 30 leads at £30 each but converts 20 of them to clients is far more valuable.
For this reason, track CPL alongside lead quality. If your sales team is reporting that enquiries are poorly matched to your actual service, the targeting in your campaigns needs adjustment — not the budget.
7. Attribution and Assisted Conversions
Attribution is where digital marketing measurement gets complicated in the UK, and where most reporting becomes unreliable.
The core problem: UK GDPR and the Privacy and Electronic Communications Regulations (PECR) require businesses to obtain active consent before placing marketing cookies. When visitors decline cookie consent — which a significant proportion do, particularly in financial services and healthcare sectors — their journey through your site becomes invisible to standard tracking tools like GA4.
Researchers estimate that between 20% and 40% of website sessions go untracked due to consent rejection, browser-level blocking, or ad blockers. This creates what practitioners call “dark traffic” — genuine commercial activity that doesn’t appear in your analytics.
What to do about it:
- Use GA4’s modelled conversions feature, which estimates conversions from consented and non-consented users together
- Consider server-side tracking as an alternative to client-side cookies
- Check your direct traffic volume — a sudden spike often indicates traffic that can no longer be attributed properly
On attribution modelling itself, most businesses still use last-click attribution, which gives all credit to the final touchpoint before conversion. This systematically undervalues awareness channels like display advertising and content marketing. GA4 defaults to data-driven attribution, which distributes credit across the full customer journey. For most SMEs, this is a more accurate reflection of how customers actually arrive.
Presenting KPIs to Your Board: A Translation Guide

The single biggest problem with marketing KPI reporting is language. Marketing teams speak in acronyms and percentages. Boards think in money and risk. The gap causes marketing budgets to get cut, not because performance is poor, but because the case wasn’t made in terms that the decision-maker could evaluate.
Use this translation table when preparing board reports:
| Instead of saying… | Say this… |
|---|---|
| “Our CTR improved to 4.2%” | “Our ads are now generating more clicks for the same spend — relevance is up” |
| “Bounce rate dropped to 58%” | “More visitors are staying on the site long enough to take an action” |
| “CAC is £120” | “We’re spending £120 to acquire a customer who spends £680 on average — a 5.7x return” |
| “We generated 340 organic sessions” | “340 potential customers found us through search without paid spend” |
| “Our ROAS is 3.8” | “Every £1 we put into paid advertising returned £3.80 in revenue” |
One senior marketing director working with ProfileTree put it plainly: the board doesn’t care about the dashboard. They care about one number — how much did we spend, and how much did we get back?
Common Measurement Mistakes UK Businesses Make

Comparing before and after a GA4 migration without accounting for data differences. GA4 counts sessions and users differently from Universal Analytics. A drop in reported traffic after migrating is often an artefact of the measurement change, not a real decline.
Setting KPI targets without knowing sector benchmarks. A 1.5% conversion rate looks weak in isolation. For a competitive UK finance product, it’s above average.
Tracking KPIs monthly but making strategy decisions weekly. Weekly fluctuations in most digital KPIs are noise, not signal. Look at four-week rolling averages before drawing conclusions.
Reporting channel metrics to the business rather than business metrics. The board doesn’t need to know how each channel performed. They need to know total leads, total cost per lead, and total marketing ROI.
Conclusion
Tracking digital marketing KPIs without a clear framework is guesswork with a spreadsheet attached. The seven metrics above — CAC, ROAS, conversion rate, CLV, CTR, CPL, and attribution — provide UK SMEs with a practical framework for linking marketing activity to commercial outcomes.
If you’re not sure which KPIs to prioritise for your business stage, or if your current reporting isn’t giving you confidence in the numbers, ProfileTree’s digital marketing team works with businesses across Northern Ireland, Ireland, and the UK to build measurement frameworks that actually inform decisions. Get in touch to discuss your analytics setup.
FAQs
What are the 7 KPIs for marketing?
The seven digital marketing KPIs most useful for UK SMEs are: Customer Acquisition Cost (CAC), Return on Ad Spend (ROAS), Conversion Rate, Customer Lifetime Value (CLV), Click-Through Rate (CTR), Cost Per Lead (CPL), and Attribution. Each measures a different stage of the customer journey from awareness through to revenue.
What is the most important KPI in digital marketing?
It depends on your business stage. Early-stage businesses should prioritise Cost Per Lead and Conversion Rate to understand whether their offer is landing. Growth-stage businesses need ROAS and CAC front and centre. Established businesses with repeat customers should be tracking CLV. There’s no single universal answer — any guide that gives you one is oversimplifying.
How do I track digital marketing KPIs if users decline cookies?
This is a real challenge in the UK under GDPR and PECR. Use GA4’s modelled conversions feature, which estimates untracked activity using consented data. Server-side tracking is a more robust solution for businesses with higher traffic volumes. Also, monitor your direct traffic closely — it often absorbs sessions that can no longer be attributed.
What is a good ROAS in the UK?
A ROAS of 3:1 to 5:1 is a reasonable starting benchmark for most UK sectors. However, the right target depends on your profit margins. A business with 20% margins needs a minimum ROAS of 5:1 to remain profitable after the cost of goods. A services business with 70% margins can sustain a ROAS of 2:1. Calculate your minimum viable ROAS before setting targets.
What is the difference between a KPI and a metric?
A metric is any measurable figure — page views, time on site, follower count. A KPI is a metric that is directly tied to a business objective. Page views become a KPI only if driving traffic is a defined goal. Conversion rate is nearly always a KPI because it connects directly to revenue. Not all metrics are KPIs; choose the ones that reflect whether the business is moving in the right direction.
How often should I report on marketing KPIs?
Weekly for tactical decisions — ad spend, immediate campaign performance. Monthly for strategic review — is the overall direction working? Quarterly for board-level reporting — have we hit our commercial targets? Annual reviews should look at year-on-year trends and inform the following year’s budget.
Which KPI is best for brand awareness?
Two metrics are most useful here: Share of Search (your brand’s search volume relative to competitors, tracked in Google Trends) and Assisted Conversions in GA4, which shows touchpoints that contributed to a conversion without being the final click. Organic traffic growth over time also reflects brand awareness, particularly for branded search terms.