
7 Digital Marketing KPIs Every UK Business Should Track
Table of Contents
Most UK businesses report on the wrong numbers. Follower counts and page impressions get pulled into monthly decks, while the figures that actually connect to revenue, cost per lead, and customer lifetime value sit unexamined. Digital marketing KPIs to track exist to close that gap, tying marketing activity directly to commercial outcomes rather than to how much content got produced. For most marketing KPIs for UK SMEs, that gap between activity and outcome is exactly where budgets get won or lost.
This guide sets out the seven digital marketing KPIs to track if you run marketing for a UK SME, along with plain formulas, UK benchmarks by sector, and a practical way to present these figures to a board that would rather talk about profit than percentages.
KPI vs Metric: Why the Difference Matters for UK SMEs
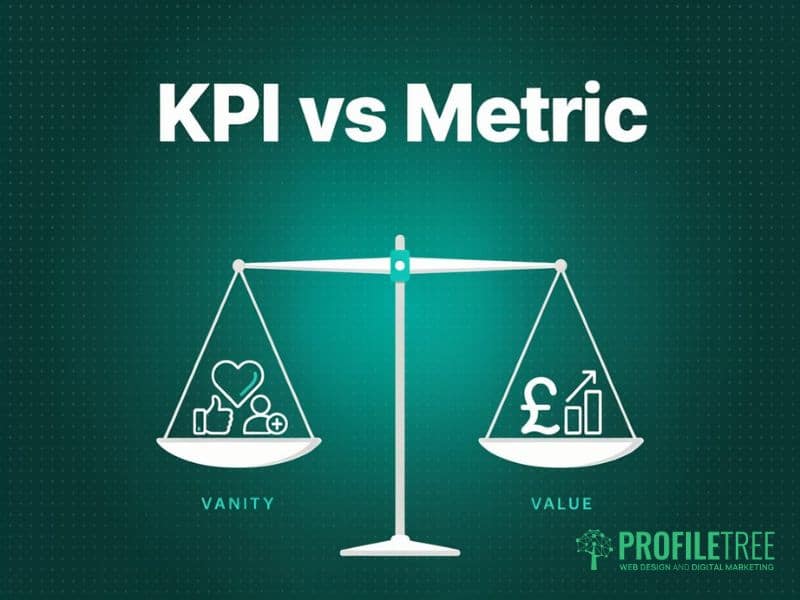
A metric is any number you can count. A KPI is a metric tied to a business objective. Confusing the two is how marketing budgets get cut, not because performance is poor, but because nobody in the room could explain what the number actually proves. These figures connect activity to outcome; a metric on its own doesn’t. This distinction matters more for marketing KPIs for UK SMEs than for large corporates, since a smaller budget has far less room to spend on numbers that look good but change nothing.
| Vanity Metric | What It Looks Like | Real KPI | What It Proves |
|---|---|---|---|
| Social media followers | 10,000 Instagram followers | Customer Acquisition Cost | £42 to acquire each paying customer |
| Page impressions | 50,000 monthly views | Conversion Rate | 2.1% of visitors become leads |
| Email list size | 8,000 subscribers | Cost Per Lead | £18 per qualified enquiry |
| Likes and shares | 500 post engagements | Return on Ad Spend | £3.80 returned per £1 spent |
Vanity metrics look tidy in a report. Real digital marketing KPIs to track inform a decision: raise the budget, cut a channel, or rebuild a landing page. Marketing agency KPIs work the same way whether a business manages campaigns in-house or through an external partner, and the same is true more broadly across paid and organic channels; the seven below sit firmly in the decision-making category, not the decoration one.
The 7 Digital Marketing KPIs to Track
Each of these key performance indicators for digital marketing measures a different stage of the customer journey, from the first click through to repeat revenue. Together, they form a marketing agency metrics framework that a UK finance director can actually interrogate, rather than a wall of dashboards nobody reads.
1. Customer Acquisition Cost (CAC)
CAC tells you what it costs to bring in one paying customer. It’s one of the more useful KPIs to track early, because you can weigh it straight against average order value or customer lifetime value.
Formula: CAC = Total marketing spend ÷ Number of new customers acquired
If a business spends £12,000 on marketing in a quarter and acquires 85 new customers, CAC works out at £141. Industry estimates put typical UK CAC ranges at £80 to £300 for professional services, depending on deal complexity, and £15 to £60 for e-commerce.
When a business launches a new service or enters a new market, CAC won’t be representative for the first two or three months; there’s no baseline to measure against yet. For a business seeking investment, a low CAC relative to average revenue per customer is one of the clearer signs of commercial efficiency, and it is a number most marketing agency KPIs reports lead with for exactly that reason.
2. Return on Ad Spend (ROAS)
ROAS measures the direct revenue return from paid advertising. Among the key performance indicators for digital marketing covered here, it’s the one most boards understand on sight, because it frames marketing as an investment with a measurable return rather than a cost centre.
Formula: ROAS = Revenue attributed to ads ÷ Total ad spend
A ROAS of 4:1 means every £1 spent on paid media returned £4 in revenue. A ROAS of 1:1 is break-even; below that, the campaign loses money. Industry estimates put a reasonable baseline target for most UK SMEs at between 3:1 and 5:1, though the right figure depends on margin: a retailer running 15% margins needs a much higher ROAS than a professional services firm billing at 60% margins.
One caveat worth flagging to any team relying on AI-driven bidding tools that need clean conversion data to work properly: automated bid strategies in Google Ads and Meta Ads typically need 30 to 50 conversions a month before they optimise reliably. Below that volume, manual bidding often performs better, and it’s worth reviewing this threshold monthly as campaign volume grows.
3. Conversion Rate
Conversion rate measures the percentage of visitors who take a desired action: completing a purchase, submitting an enquiry form, or booking a call. It’s one of the marketing agency metrics most directly shaped by page design rather than by media spend.
Formula: Conversion Rate = (Conversions ÷ Total visitors) × 100
| Sector | Average Conversion Rate |
|---|---|
| Professional Services | 3.0% – 5.0% |
| E-commerce (retail) | 1.5% – 3.5% |
| Finance | 5.0% – 10.0% |
| Construction & trades | 2.0% – 4.0% |
| Technology / SaaS | 1.0% – 3.0% |
A low conversion rate usually points to a landing page problem rather than a traffic problem. If a business pays to send visitors to a page and most of them leave straight away, the issue is normally page design, load speed, or a mismatch between the ad message and the page content. This is where landing page design built around a single conversion goal tends to move the number faster than adding more traffic ever will, and it is usually a cheaper fix than most teams expect.
4. Customer Lifetime Value (CLV)
CLV is the total revenue a business can expect from a single customer over the life of the relationship. It’s arguably the most strategically important of the seven digital marketing KPIs to track, because it sets a ceiling on how much a business should spend acquiring that customer in the first place.
Formula: CLV = Average order value × Purchase frequency × Average customer lifespan
A B2B example: a marketing agency client paying £1,200 a month for 18 months has a CLV of £21,600. If CAC for that client type sits at £800, that’s a strong return, and it is the kind of figure marketing agency KPIs reporting should surface every quarter.
A B2C example: a local gym member paying £45 a month who stays for two years has a CLV of £1,080; spending £90 to acquire that member means spending 8.3% of CLV on acquisition, which is typically fine for a subscription business. Understanding CLV changes the CAC conversation entirely. A business with high CLV can afford a higher CAC because the long-term return justifies the upfront cost, and that’s a point worth making explicitly when a marketing budget goes up for approval.
5. Click-Through Rate (CTR)
CTR measures how often people who see your content or ad go on to click it. It applies to paid ads, organic search results, and email campaigns, though the benchmarks differ a fair amount across each, and it’s one of the marketing agency metrics that clients ask about most often because it’s easy to picture.
Formula: CTR = (Clicks ÷ Impressions) × 100
Industry estimates put typical UK benchmarks at: Google Search Ads averaging 3% to 6% CTR across most sectors; Google organic results in position one seeing 25% to 35%; email marketing averaging 2% to 4% CTR for UK B2B and 1% to 2% for B2C. A low CTR on paid ads usually signals a relevance problem: the ad copy doesn’t match what people are searching for.
A low CTR in organic search suggests the title tag or meta description doesn’t stand out enough against the other results on the page. When presenting CTR to a non-marketing audience, frame it as “relevance” or “creative engagement” rather than the acronym; the concept translates far more easily than the letters do.
6. Cost Per Lead (CPL)
CPL measures the average cost of generating a single qualified enquiry, whether or not that enquiry ever converts to a sale.
Formula: CPL = Total marketing spend ÷ Number of leads generated
CPL matters more than raw lead volume. A campaign generating 200 leads at £5 each looks impressive until 180 of them turn out to be completely unqualified. A campaign generating 30 leads at £30 each that converts 20 of them to paying clients is worth far more, and this is one of the marketing agency metrics that most exposes weak targeting. This is why CPL should always sit alongside lead quality, not replace it; content that improves lead quality rather than just lead volume often does more for a sales pipeline than a cheaper CPL ever will. If a sales team reports that enquiries don’t match the service on offer, the fix is usually campaign targeting, not budget.
7. Attribution and Assisted Conversions
Attribution is where digital marketing measurement gets genuinely complicated in the UK, and where most reporting quietly becomes unreliable.
The core problem: UK GDPR and the Privacy and Electronic Communications Regulations (PECR) require businesses to obtain active consent before placing marketing cookies, a rule the ICO enforces directly. When visitors decline that consent, which a large share do, particularly in financial services and healthcare, their journey through the site becomes invisible to standard tracking tools such as GA4.
Industry estimates suggest that somewhere between 20% and 40% of website sessions go untracked because of consent rejection, browser-level blocking, or ad blockers. Practitioners call the result “dark traffic”: genuine commercial activity that never shows up in the analytics platform, and it’s one of the key performance indicators for digital marketing that gets distorted most by consent choices.
There are three practical responses. First, GA4’s modelled conversions feature estimates activity from consented and non-consented visitors together, filling in some of the gap statistically; Google’s Consent Mode framework feeds this modelling directly, softening the gap without a full server-side build.
Second, server-side tracking offers a more resilient alternative to client-side cookies for businesses with meaningful traffic volumes; ProfileTree’s AI training that covers GA4’s modelled conversions in detail walks marketing teams through setting this up properly. Third, watch direct traffic closely: a sudden spike often signals sessions that can no longer be attributed to their real source.
On the attribution model itself, most UK businesses still default to last-click attribution, which gives all the credit to the final touchpoint before conversion. That approach systematically undervalues awareness channels such as display advertising and content marketing, which rarely get the last click but often start the journey. GA4’s data-driven attribution spreads credit across the full customer journey instead, and for most SMEs, it’s a considerably more accurate reflection of how customers actually arrive.
Choosing Your KPIs by Business Stage
Not every business needs all seven digital marketing KPIs to track at once, and trying to report on all of them from day one usually produces noise rather than clarity. The right starting point depends on where a business sits, and this is exactly where marketing KPIs for UK SMEs tend to differ most from the generic advice aimed at larger, better-resourced marketing teams.
Early-stage businesses, those still working out whether an offer lands, should prioritise Cost Per Lead and Conversion Rate. These two numbers answer the most urgent question: is anyone interested, and does the message on the page match what they expected. Growth-stage businesses, scaling a proven offer, need CAC and ROAS front and centre, because the question shifts from “does this work” to “how far can we scale it profitably.” Established businesses with repeat customers should be watching CLV closely, since it governs how much acquisition spend the business can sustainably justify.
A short framework helps here: tactical metrics (likes, clicks, impressions) support strategic KPIs (CPL, CAC, ROAS), which in turn support the actual business goal (revenue, margin, retention). If a number doesn’t trace up that chain to something the board cares about, it’s a metric, not a KPI. This is exactly the sort of prioritisation exercise that benefits from a KPI framework built around your growth stage rather than a generic checklist copied from a blog post.
Reporting Digital Marketing KPIs to Your Board

The single biggest problem with marketing KPI reporting is language. Marketing teams speak in acronyms and percentages. Boards think in money and risk. That gap is why marketing budgets get cut more often than performance alone would justify; the case wasn’t made in terms a non-specialist could weigh up. Getting this translation right is arguably as important as picking the right digital marketing KPIs to track in the first place.
| Instead of saying… | Say this… |
|---|---|
| “Our CTR improved to 4.2%” | “Our ads are now generating more clicks for the same spend; relevance is up” |
| “Bounce rate dropped to 58%” | “More visitors are staying on the site long enough to take an action” |
| “CAC is £120” | “We’re spending £120 to acquire a customer who spends £680 on average, a 5.7x return” |
| “We generated 340 organic sessions” | “340 potential customers found us through search without paid spend” |
| “Our ROAS is 3.8” | “Every £1 we put into paid advertising returned £3.80 in revenue” |
Ciaran Connolly, founder of ProfileTree, the Belfast-based digital agency, puts it directly: the board conversation only works once marketing translates its numbers into the same currency the CFO already uses, cost, return, and risk, rather than asking them to learn a new vocabulary first. A marketing agency’s KPIs report that leads with £120 spent to acquire a customer worth £680 will get a fairer hearing than one that opens with a CTR improvement, even though both numbers might describe the same underlying result. The same principle applies to any of the key performance indicators for digital marketing covered here: translate before you present, not after someone asks a question you can’t answer plainly.
Common Measurement Mistakes UK Businesses Make
A handful of errors show up again and again in how UK businesses track digital marketing KPIs, and most of them are easy to fix once named. They crop up just as often in marketing KPIs for UK SMEs as they do in larger corporate reporting, usually because the same templates get copied without checking whether they fit the business.
Comparing traffic before and after a GA4 migration without accounting for how the platform counts sessions and users differently from Universal Analytics produces a false alarm; a reported drop is often a measurement artefact, not a real decline. Setting KPI targets without checking sector benchmarks first leads to the wrong conclusion in both directions: a 1.5% conversion rate looks weak on its own, but for a competitive UK finance product, it’s above average.
Reviewing marketing KPIs weekly and making strategy calls off that data is another common trap; weekly fluctuation in most marketing agency metrics is noise, and a four-week rolling average tells a truer story before anyone changes course. Ignoring seasonality is a related error: a construction firm comparing December leads against September leads is comparing two different markets, not two different performance periods.
Finally, reporting channel-level detail to the board rather than business-level totals wastes their attention; a board doesn’t need to know how each channel performed individually, only the total leads, blended cost per lead, and total marketing return.
Turning KPIs Into Decisions Your Board Will Back
Tracking digital marketing KPIs without a clear framework produces a spreadsheet full of numbers and very few decisions. The seven covered here, CAC, ROAS, conversion rate, CLV, CTR, CPL, and attribution, give a UK SME a practical way to link marketing activity to commercial outcomes rather than campaign activity for its own sake.
The next step is usually smaller than it sounds: pick two or three KPIs that match the current business stage, agree on the benchmark with whoever holds the budget, and review them on a rolling basis rather than a fixed monthly snapshot. Whether that reporting sits with an in-house team or a set of marketing agency KPIs delivered by an external partner, the discipline of reviewing the same numbers on the same schedule matters more than who produces the report.
For marketing KPIs for UK SMEs specifically, that discipline tends to matter more than adding new tools, since most measurement problems come from reporting the wrong numbers rather than not having enough of them. A full digital marketing programme measured against these KPIs from the outset tends to earn more budget over time than one bolted onto reporting after the fact, simply because every pound spent has a number attached to it that the board already trusts.
FAQs
1. What are the most important digital marketing KPIs for UK businesses?
There’s no single universal answer. Early-stage businesses should prioritise Cost Per Lead and Conversion Rate to check whether the offer is landing, while growth-stage businesses need CAC and ROAS front and centre, and established businesses with repeat custom should watch CLV most closely.
2. What is a good ROAS in the UK?
A ROAS of 3:1 to 5:1 is a reasonable starting benchmark for most UK sectors, though the right target depends on profit margin. A business running 20% margins typically needs a minimum ROAS of 5:1 to stay profitable after the cost of goods, while a services business on 70% margins can sustain a ROAS closer to 2:1.
3. How do I track marketing KPIs if visitors decline cookies?
This is a genuine challenge under UK GDPR and PECR. GA4’s modelled conversions feature estimates untracked activity using consented data, and server-side tracking is a more resilient option for businesses with higher traffic volumes. It also helps to monitor direct traffic closely, since it often absorbs sessions that can no longer be attributed to their real source.
4. What is the difference between a KPI and a metric?
A metric is any measurable figure, such as page views or follower count. A KPI is a metric tied directly to a business objective, so page views only become a KPI if driving traffic is genuinely one of the goals. Conversion rate is almost always a KPI because it connects directly to revenue.
5. Which KPI matters most for brand awareness?
Share of Search, a brand’s search volume relative to competitors tracked in Google Trends, and Assisted Conversions in GA4 are the two most useful measures here. Organic traffic growth over time, particularly for branded search terms, also reflects brand awareness building.