Google Sheets: Complete Guide to Spreadsheet Mastery for Business
Table of Contents
Google Sheets has transformed how businesses manage, analyse, and share data. As Google’s cloud-based alternative to Microsoft Excel, it offers powerful spreadsheet capabilities accessible from anywhere, on any device, and completely free. For business owners and marketing professionals, understanding how to use Google Sheets effectively can streamline operations, improve collaboration, and turn raw data into actionable insights.
This guide explores everything you need to know about Google Sheets—from basic functionality to advanced features—and demonstrates how spreadsheets fit into modern digital marketing strategies. Whether tracking campaign performance, managing client data, or creating reports for stakeholders, mastering this tool delivers tangible business benefits.
What Google Sheets Offers Business Users
Google Sheets is a web-based spreadsheet application that forms part of Google Workspace (formerly G Suite). It provides familiar spreadsheet functionality—rows, columns, formulas, and charts—but with cloud-based advantages that traditional desktop software cannot match.
The application runs directly in your web browser, eliminating the need for software installation or manual file management. Your spreadsheets live in the cloud, automatically saving every change and making them accessible across devices. This cloud-native approach fundamentally changes how teams work with data.
How Google Sheets Differs from Traditional Spreadsheets
Unlike desktop spreadsheet applications, Google Sheets prioritises collaboration and accessibility. Multiple team members can edit the same document simultaneously, with changes appearing in real-time. This makes it particularly valuable for distributed teams or agencies working with clients across different locations.
The platform integrates directly with other Google services—Drive for storage, Forms for data collection, Analytics for performance metrics, and Data Studio for visualisation. This ecosystem approach means your spreadsheets can automatically pull data from various sources, reducing manual data entry and improving accuracy.
Google Sheets also differs in its approach to sharing. Instead of emailing files back and forth, you share a link with configurable permissions. Recipients always see the most current version, eliminating version control issues that plague email-based collaboration.
Google Sheets Versus Google Docs
Business users sometimes confuse Google Sheets with Google Docs, but they serve distinct purposes. Google Docs is a word processor designed for text-heavy documents—reports, proposals, articles, and correspondence. It excels at formatting text, managing long-form content, and collaborative writing.
Google Sheets, conversely, is built for data. It organises information in tables, performs calculations, analyses trends, and visualises data through charts. While Docs handles narrative content, Sheets manages structured information—numbers, dates, categories, and metrics.
Both tools share Google Workspace’s collaboration features, but their core functions address different business needs. Marketing professionals might use Docs to write campaign briefs while using Sheets to track campaign performance metrics.
Core Capabilities That Drive Business Value
Understanding what Google Sheets can do helps businesses identify opportunities to streamline operations and improve decision-making. The platform offers several capabilities directly supporting business objectives, from data organisation to automated reporting.
Data Collection and Forms Integration
Google Forms provides a powerful method for gathering structured data directly into spreadsheets. You can create surveys, registration forms, feedback questionnaires, or lead capture forms, then automatically populate responses in a Google Sheet.
This integration eliminates manual data entry and reduces errors. When someone submits a form, their response immediately appears as a new row in your linked spreadsheet, complete with timestamps. This real-time data collection supports everything from event registrations to customer feedback analysis.
This capability streamlines client onboarding, project briefings, and performance reporting for marketing agencies. Instead of compiling information from emails or documents, you create a form that feeds directly into your project management spreadsheet.
Creating Charts and Visual Representations
Data becomes more actionable when visualised effectively. Google Sheets includes comprehensive charting tools that transform raw numbers into clear, persuasive visuals.
Creating a chart is straightforward: select your data range, click Insert > Chart, then choose from various chart types—line graphs for trends, bar charts for comparisons, pie charts for composition, or scatter plots for correlation. The chart editor provides extensive customisation options for colours, labels, axes, and styling.
These charts can be embedded directly in Google Docs or Slides, maintaining a live link to the source data. When you update the spreadsheet, the chart automatically refreshes in your presentation or report. This dynamic linking saves time and maintains consistency across documents.
“Data visualisation transforms numbers into narratives,” notes Ciaran Connolly, Director of ProfileTree. “When presenting campaign results to clients, clear charts differentiate between confusion and confidence. Sheets makes this accessible to everyone, not just data analysts.”
Formulas and Functions for Business Analysis
The true power of Google Sheets lies in its formulas—pre-built calculations that process data automatically. Understanding even basic formulas dramatically increases what you can achieve with spreadsheets.
Essential Business Formulas:
SUM adds numbers together, perfect for calculating totals: =SUM(A1:A10) Adds all values in cells A1 through A10.
AVERAGE calculates mean values, valid for performance metrics: =AVERAGE(B1:B10) Finds the average of your data range.
COUNT and COUNTA count cells containing numbers or any data, helping track completed tasks or responses.
IF creates conditional logic: =IF(C2>100,"High","Low") Categorises values based on criteria you define.
VLOOKUP searches for data in tables, enabling you to pull information from large datasets: =VLOOKUP("Search Term", A:B, 2, FALSE) Finds a match in column A and returns the corresponding value from column B.
Formulas can calculate conversion rates, ROI, cost per acquisition, or year-over-year growth automatically for digital marketing applications. When new data arrives, the calculations update instantly.
Collaboration Features for Team Productivity
Google Sheets excels at facilitating teamwork. Multiple people can work in the same spreadsheet simultaneously, with each person’s cursor identified by a unique colour. You can see exactly what colleagues do in real-time, reducing duplication and miscommunication.
The commenting system allows team members to discuss specific cells without changing the data. You can tag colleagues with @ mentions, assign action items, and resolve discussions once addressed. This creates an audit trail of decisions and changes.
Version history automatically tracks every change made to the spreadsheet, including who made it and when. Review previous versions, restore earlier states, or compare changes over time. This protects against accidental deletions and provides accountability.
Sharing settings offer granular control over who can view, comment on, or edit your spreadsheets. You can share with specific people or your entire organisation or make documents publicly accessible. This flexibility suits various collaboration scenarios, from confidential client data to public resources.
Business Applications and Use Cases
Google Sheets serves diverse business functions, from financial tracking to project management. Understanding practical applications helps identify opportunities to improve your workflows.
Financial Management and Accounting
Small businesses and agencies frequently use Google Sheets for financial management. Pre-made templates support various accounting needs: income statements, balance sheets, cash flow projections, invoice tracking, expense management, and budget forecasting.
The platform’s calculation capabilities handle financial formulas like NPV (net present value), FV (future value), PMT (payment calculations), and standard accounting ratios. For businesses not requiring complex accounting software, Sheets provides sufficient functionality for day-to-day financial management.
Add-ons extend these capabilities further. QuickBooks Online integration syncs financial data directly into spreadsheets, whilst expense tracking add-ons simplify receipt management and reimbursement workflows.
Data Analytics for Marketing Performance
Marketing professionals use spreadsheets to track campaign performance, analyse customer behaviour, and demonstrate ROI. Google Sheets handles large datasets—far exceeding Excel’s one million row limitation—making it suitable for substantial analytics tasks.
Integration with Google Analytics allows automatic data imports, eliminating manual exports. You can create custom dashboards that pull website traffic, conversion data, and audience metrics directly into spreadsheets, then apply formulas to calculate KPIs relevant to your business.
For SEO tracking, spreadsheets consolidate data from Search Console, ranking tools, and backlink analysers. Within a shared document that keeps stakeholders informed, you can monitor keyword positions over time, identify ranking opportunities, and track organic traffic growth.
CRM and Client Management
Dedicated CRM platforms offer advanced features, but many small businesses and agencies use Google Sheets as a simple, effective customer relationship management tool. Spreadsheets can track client contacts, project status, communication history, and sales pipeline stages.
The flexibility of spreadsheets means you can design the exact structure your business needs rather than adapting to pre-built software. Conditional formatting can automatically highlight overdue follow-ups, upcoming deadlines, or high-value opportunities.
A well-organised spreadsheet for agencies managing multiple client projects simultaneously provides a centralised view of all active work, resource allocation, and deliverable timelines. The real-time collaboration features mean account managers, creatives, and strategists always see current information.
Project Management and Task Tracking
Teams use Google Sheets for project planning, task allocation, and progress monitoring. A simple spreadsheet can function as a Gantt chart alternative, tracking project phases, responsible parties, deadlines, and completion status.
Colour coding and conditional formatting make the status immediately apparent. For example, you might automatically highlight overdue tasks in red, completed items in green, and in-progress work in amber. This visual feedback helps teams prioritise without reading through lists.
For content marketing campaigns, spreadsheets track editorial calendars, content production status, publication dates, and performance metrics. Marketing managers can see at a glance what content is planned, drafted, approved, or published across all channels.
How ProfileTree Uses Spreadsheets for Digital Services
At ProfileTree, spreadsheets underpin many aspects of our service delivery. When developing websites for clients, we use Sheets to track technical requirements, content needs, design revisions, and launch checklists. This keeps our development, design, and content teams aligned throughout the project lifecycle.
We create custom tracking spreadsheets for SEO campaigns that monitor keyword rankings, organic traffic trends, technical issues, and backlink profiles. Clients receive access to these living documents, which provide transparency and demonstrate progress throughout our engagement.
Our video production projects rely on spreadsheets for shot lists, script revisions, production schedules, and post-production tasks. The collaborative nature means that directors, videographers, and editors coordinate seamlessly, even remotely.
Digital training sessions we deliver to SMEs often include spreadsheet training components. We teach business owners to track marketing performance, manage customer data, and create simple dashboards that inform decision-making. This practical skill-building empowers clients to maintain their digital presence effectively.
Advanced Techniques for Power Users
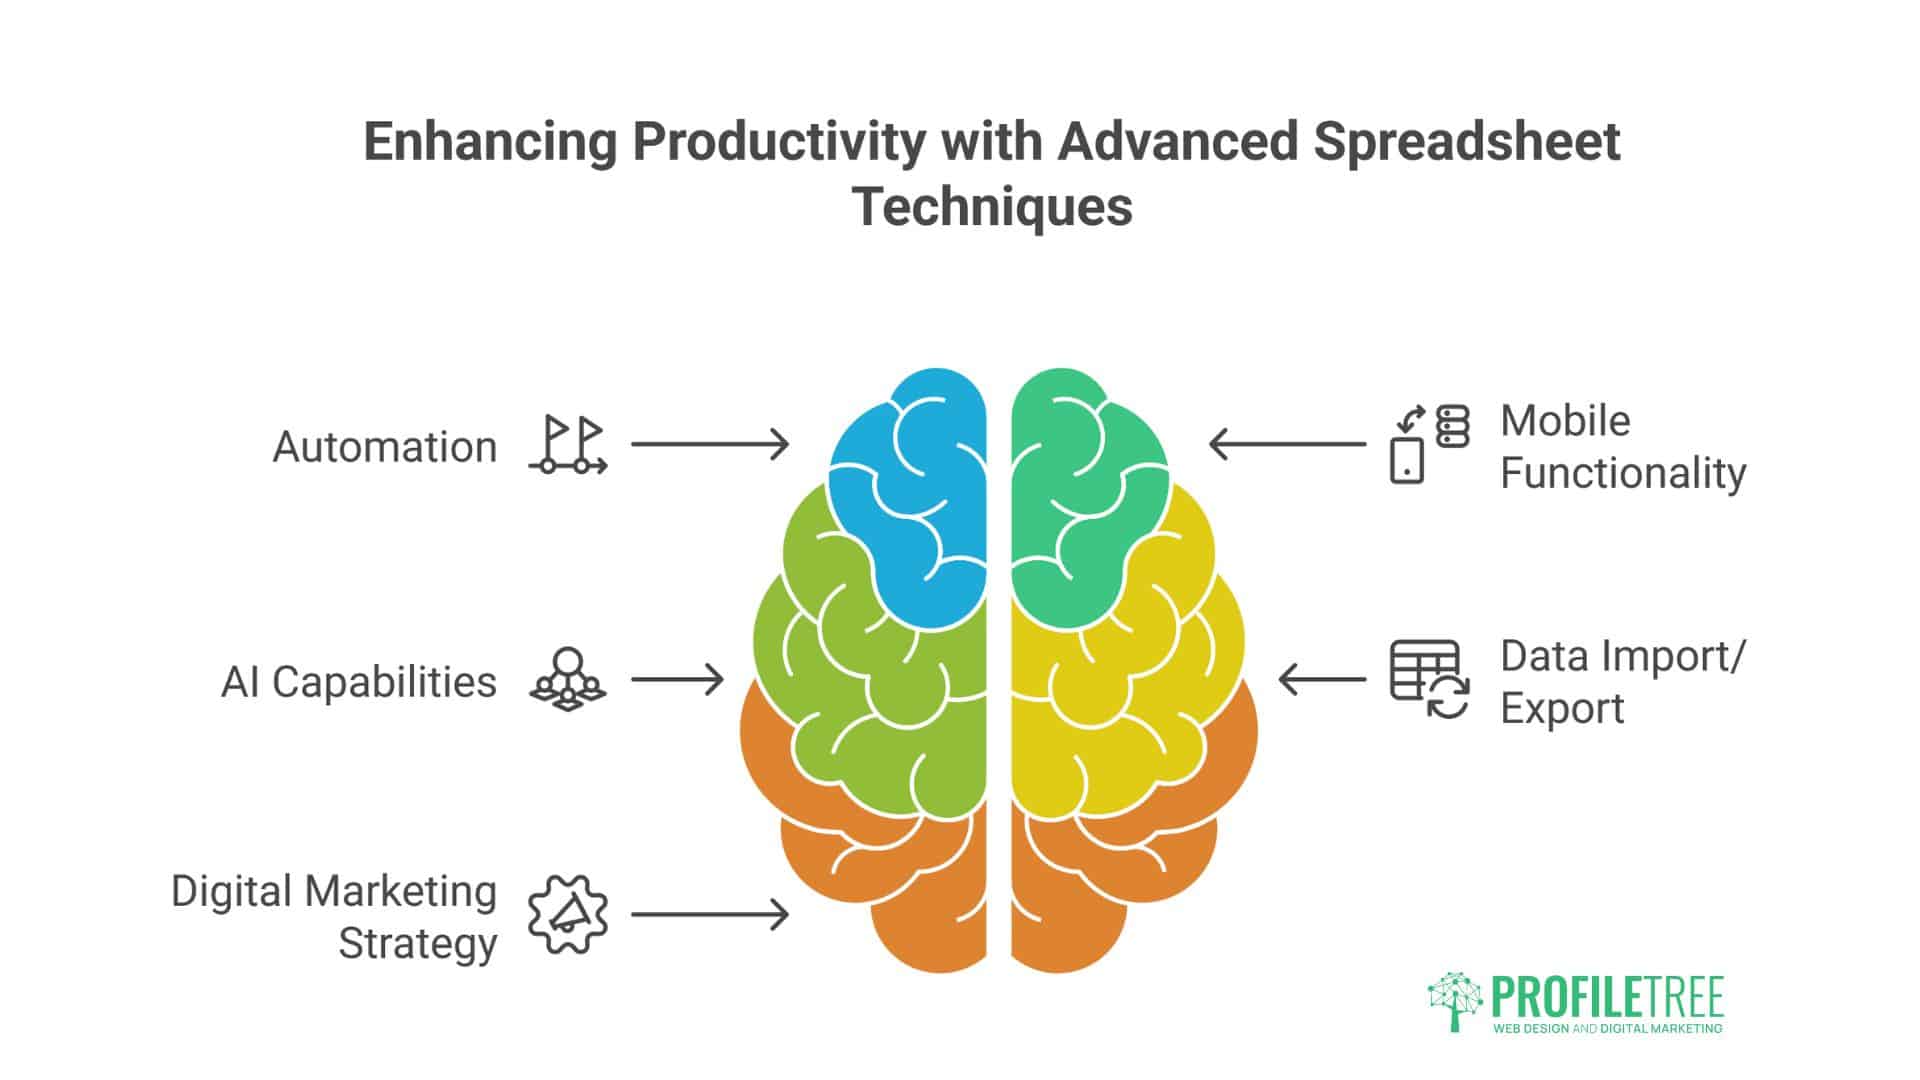
Moving beyond basic spreadsheet use unlocks significant productivity gains and analytical capabilities. These advanced techniques help businesses extract maximum value from their data.
Automation Through Add-ons and Apps Script
Google Sheets supports automation in two primary ways: pre-built add-ons and custom Apps Script code. Add-ons extend functionality without programming knowledge. Popular options include the Google Analytics add-on for automated reporting, form notifications that alert you to new submissions, and mail merge tools that personalise bulk emails from spreadsheet data.
App Script provides deeper customisation for those comfortable with JavaScript. You can write custom functions, automate repetitive tasks, trigger actions based on spreadsheet changes, or integrate with external APIs. This programming capability transforms spreadsheets from static documents into dynamic business tools.
Even simple automations deliver substantial time savings. Scheduling a script to pull fresh data daily, send weekly summary emails, or back up essential sheets eliminates manual work and reduces errors.
Mobile Functionality for Business on the Move
The Google Sheets mobile app for iOS and Android provides full editing capabilities on smartphones and tablets. You can create spreadsheets, enter data, apply formulas, generate charts, and collaborate with colleagues—all from your mobile device.
Offline mode allows work without internet connectivity. Changes sync automatically when you reconnect, preventing data loss. This offline capability makes Sheets practical for field work, client meetings in areas with poor connectivity, or travel scenarios.
Gesture navigation optimises the mobile experience. Swipe to navigate between cells, tap to edit, pinch to zoom, and use touch-friendly menus designed for smaller screens. The mobile interface maintains most desktop functionality whilst adapting to touch-based interaction.
AI Capabilities and Smart Features
Recent Google Sheets updates incorporate artificial intelligence to accelerate everyday tasks. Formula autocomplete suggests functions as you type, learning from your patterns and reducing syntax errors. Smart Fill detects patterns in your data and suggests automatic completion—for example, extending a date sequence or applying consistent formatting.
The Explore feature analyses your data and suggests insights, trends, and relevant charts without manual analysis. Click the Explore button, and Sheets will identify correlations, calculate statistics, and recommend visualisations based on your data structure.
Data validation assists accurate data entry by restricting cell inputs to specific formats, ranges, or lists. This prevents errors before they occur, maintaining data quality as multiple people contribute information.
Importing and Exporting Data
Google Sheets supports various data formats for importing and exporting, facilitating integration with other tools. You can import Excel files (.xlsx, .xls), CSV files, TSV files, and data from other Google Sheets while maintaining formatting, formulas, and structure.
Native export options include Excel format, PDF for distribution, CSV for database imports, HTML for web publishing, and OpenDocument format for compatibility with LibreOffice and similar applications.
For automated data imports, built-in functions like IMPORTHTML, IMPORTXML, and IMPORTDATA pull information directly from websites into your spreadsheet. This enables live data feeds—stock prices, weather information, or published datasets—that update automatically.
Connected data sources take integration further, establishing direct pipelines from BigQuery, SQL databases, or other Google services. These connections refresh on schedule, maintaining current information without manual intervention.
Spreadsheets in Digital Marketing Strategy
Effective digital marketing relies on data-driven decision-making. Spreadsheets provide the analytical foundation that transforms raw metrics into strategic insights.
Marketing attribution models, which determine how conversion credit is distributed across touchpoints, are frequently built in spreadsheets. You can create custom attribution logic that reflects your customer journey, then visualise which channels and campaigns deliver the most substantial return.
Competitive analysis benefits from structured spreadsheet tracking. In a centralised sheet, monitor competitors’ content output, keyword rankings, social media engagement, and advertising activity. Over time, patterns emerge that inform your competitive positioning and identify market opportunities.
Budget management for marketing campaigns requires tracking spend across multiple channels against performance outcomes. A well-designed spreadsheet shows budget allocation, actual spend, variance, and ROI for each channel, enabling informed reallocation decisions throughout the campaign.
Understanding the Difference: Sheets Versus Excel
Business users often debate whether Google Sheets or Microsoft Excel better suits their needs. The answer depends on specific use cases and priorities.
Pricing and Accessibility
Google Sheets is free with a Google account, while Excel requires a Microsoft 365 subscription (starting from £5.99 per user monthly for business plans) or a one-time purchase of Office software. Sheets’ zero-cost entry point is compelling for budget-conscious businesses or those just starting.
Sheets’ cloud-based nature means access from any device with a web browser—computers, tablets, or smartphones—without software installation. Excel requires desktop software or the Microsoft 365 online version, which offers reduced functionality compared to the desktop application.
Collaboration Capabilities
Real-time co-editing represents Sheets’ most substantial advantage. Multiple users work simultaneously in the same document, instantly seeing each other’s changes. Excel online offers similar capabilities, but desktop Excel requires file sharing through OneDrive, introducing friction in collaborative workflows.
Sheets’ commenting and suggestion systems feel more integrated and designed around collaborative workflows from inception. Excel’s collaboration features, while improving, still reflect its desktop-first heritage.
Processing Power and Complexity
Excel handles huge datasets and complex calculations better than Sheets. Excel’s processing power advantages become apparent for financial modelling with intricate dependencies, advanced statistical analysis, or datasets exceeding several hundred thousand rows.
Excel also offers more advanced functions and tools for specialist applications—financial analysts, scientists, and engineers often require capabilities that Excel provides but Sheets does not. The desktop version processes calculations faster and handles more sophisticated macro programming.
Integration and Add-ons
Google Sheets seamlessly integrates with Google’s ecosystem, including Analytics, Search Console, Drive, Forms, and Data Studio. This native integration is particularly valuable for marketing professionals already using Google’s tools.
Excel connects deeply with Microsoft products—Power BI for advanced visualisation, Teams for collaboration, and various Microsoft cloud services. For organisations committed to the Microsoft ecosystem, these integrations provide substantial value.
Practical Implementation for Business Users

Moving from understanding to execution requires structured implementation. These practical steps help businesses adopt Google Sheets effectively.
Creating and Structuring New Spreadsheets
Start by opening Google Sheets and clicking the “+” icon to create a new blank spreadsheet. Name it immediately by clicking “Untitled spreadsheet” at the top—descriptive names like “Q4_Marketing_Budget” or “Client_Project_Tracker” maintain organisation as file counts grow.
Structure your spreadsheet logically from the outset. Use the first row for column headers that clearly describe each data field. Keep related information together in contiguous columns. Consider creating multiple sheets within a single file for different data types—one for raw data, another for analysis, and a third for dashboard summaries.
Freeze the header row (View > Freeze > 1 row) so column labels remain visible when scrolling through large datasets. This simple step dramatically improves usability.
Formatting for Clarity and Professionalism
Effective formatting makes spreadsheets easier to read and understand. Select the header row and apply bold formatting with a subtle background colour to distinguish it from data rows. This visual separation guides the eye.
Use number formatting to present data appropriately. Currency values should show pound signs (£), percentages display the % symbol, and dates follow consistent formatting. These adjustments prevent confusion and reduce errors.
Conditional formatting automatically changes cell appearance based on values. For example, you might format all values above the target in green and below the in red. This creates instant visual feedback without reading every number.
Alignment matters too. Numbers typically align right, text aligns left, and headers might centre. Consistent alignment creates a polished, professional appearance that builds confidence in your data.
Sharing and Permission Management
Click the “Share” button at the top right to control who can access your spreadsheet. You can share with specific people by email address or generate a shareable link with different permission levels.
Permission options include:
- Viewer: Can see the spreadsheet but cannot make changes
- Commenter: Can add comments and suggestions, but cannot edit directly
- Editor: Full editing permissions
Viewer permissions allow stakeholders to see current data for client-facing reports without accidentally changing calculations. For collaborative projects, editor permissions enable team contributions.
Link sharing offers additional options. You can restrict it to specific people, anyone in your organisation, or anyone with the link. Public links suit resources you want widely accessible, whilst restricted sharing protects confidential business information.
Maintaining Data Quality and Accuracy
Spreadsheets are only valuable if the data they contain is accurate and current. Establish data entry standards for your team, including date formats, naming conventions, required fields, and validation rules.
Use data validation (Data > Data validation) to restrict what can be entered in specific cells. You might limit a column to dates, numbers within a range, or selections from a predefined list. This prevents common errors before they occur.
Regular audits identify and correct issues before they compound. Review formulas periodically to confirm they reference the proper ranges. Check for duplicate entries, missing data, or suspicious outliers that might indicate errors.
Document your spreadsheet’s structure and logic in a dedicated “Notes” sheet or within cell comments. Future users—including yourself months later—will appreciate explanations of what formulas calculate or where data originates.
Making Data Work for Your Business
Google Sheets provides businesses with accessible, collaborative, and robust data management capabilities. The platform supports diverse business functions without software costs or technical barriers, from tracking marketing campaigns to managing client projects.
The shift from desktop to cloud-based spreadsheets reflects broader changes in business operations. Distributed teams need tools that facilitate collaboration regardless of location. Mobile workers require access to information from any device. Growing businesses need solutions that scale without escalating costs. Google Sheets addresses these modern requirements whilst maintaining the familiar spreadsheet functionality that business users understand.
For marketing professionals and agency teams, spreadsheets remain fundamental tools for tracking performance, demonstrating value to clients, and making data-driven decisions. Integrating Sheets and other Google services creates a cohesive ecosystem for digital marketing operations—from data collection through Forms to visualisation in Data Studio.
Mastering spreadsheet skills delivers immediate productivity gains and long-term career value. The ability to organise data, perform analysis, create visualisations, and automate reporting distinguishes capable professionals from those who merely follow instructions.
FAQs
Is Google Sheets fully compatible with Microsoft Excel files?
Yes, Google Sheets can import and export Excel documents (.xlsx and older .xls formats) while preserving formatting, formulas, and most functions. Some advanced Excel features may not transfer perfectly, but standard business spreadsheets typically convert easily. You can work in Sheets and then export to Excel for stakeholders who prefer that format.
Can multiple people collaborate on the same Sheets file simultaneously?
Absolutely. Real-time co-editing is one of Google Sheets’ defining features. Multiple users can make changes concurrently, with each person’s cursor identified by a unique colour. Changes appear instantly for all collaborators, making it ideal for team projects, client collaboration, and distributed workforces.
Does Google Sheets work offline?
Yes, through the Google Sheets mobile app on iOS and Android. Enable offline mode in settings to view and edit spreadsheets without internet connectivity. Changes sync automatically once you reconnect. The browser version has more limited offline functionality, primarily for viewing.
Is Google Sheets HIPAA compliant for health data?
Yes, Google Workspace, including Sheets, meets HIPAA compliance requirements when HIPAA settings are configured correctly in your Google Workspace admin console. Organisations handling protected health information must enable these settings and sign a Business Associate Agreement with Google. Standard consumer Google accounts are not HIPAA-compliant by default.