Core Web Vitals: What They Mean for Your Website
Table of Contents
Core Web Vitals are the metrics Google uses to judge whether your website gives visitors a good experience. They sit directly alongside content quality as ranking signals. A site that loads slowly, shifts as it loads, or feels sluggish to interact with will rank lower than a comparable site that doesn’t, regardless of how good its content is.
Core web vitals optimisation isn’t a technical spruce-up: it’s part of what determines whether your SEO investment produces organic traffic or stalls on page four. This guide explains what the three metrics are, what causes them to fail on typical SME sites, and why web design and website development decisions are the biggest factor in whether your scores are healthy before launch.
What Core Web Vitals Are
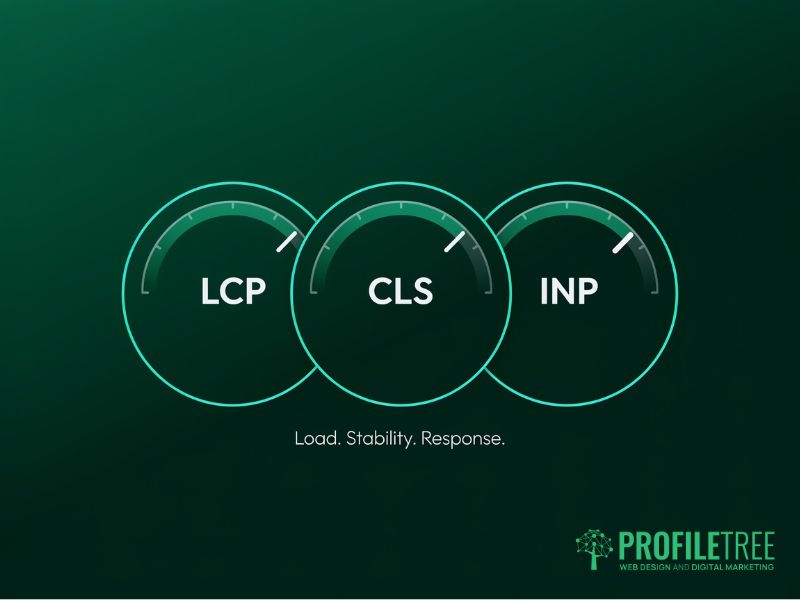
Core Web Vitals are three page experience metrics that Google treats as ranking signals: Largest Contentful Paint (LCP), Cumulative Layout Shift (CLS), and Interaction to Next Paint (INP). Each one measures a different aspect of how a real visitor experiences your site. They aren’t scores you can game; they reflect actual load behaviour captured from real Chrome users via the Chrome User Experience Report.
Largest Contentful Paint
LCP measures how long it takes for the largest visible element on your page to render in the viewport. This is usually a hero image, a large product photograph, or a prominent heading block. Google’s threshold for a good score is under 2.5 seconds. Above 4 seconds is classified as poor.
The reason LCP matters commercially is straightforward: if the biggest thing on your page takes four seconds to appear, visitors see a partially blank screen for four seconds. Most visitors leave. UK mobile data show that 4G users on mid-range Android handsets (a large share of typical SME traffic) experience LCP scores that are 1.5 to 2 seconds slower than desktop users on the same page. A score that passes on desktop can fail badly on mobile.
Cumulative Layout Shift
CLS measures how much the visible content on your page shifts unexpectedly as it loads. A button that moves just before a visitor taps it, a heading that jumps down when an image loads above it, a form that shifts when a font swaps: all of these contribute to your CLS score. Good is under 0.1. Above 0.25 is poor.
For e-commerce and lead generation sites, CLS has a direct conversion cost. A layout shift at the moment a visitor tries to submit a form or tap a call-to-action causes accidental interactions, abandonment, and lost enquiries. These problems show up in your bounce rate before they show up in your Search Console report.
Interaction with Next Paint
INP replaced First Input Delay as the official interactivity metric in March 2024. Where its predecessor only measured the browser’s response to the first user interaction, INP measures the delay for every interaction throughout a session: every click, every tap, every keystroke in a form. Good is under 200 milliseconds. Poor is above 500 milliseconds.
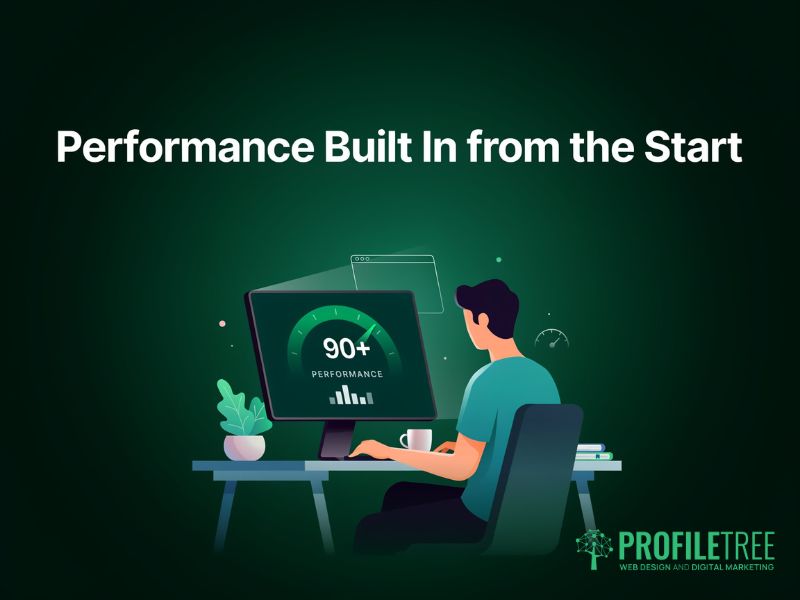
INP is the hardest of the three to fix after a site is built because the causes sit deep in JavaScript architecture. It is the metric most directly tied to website development decisions: sites with heavy page builders or multiple third-party scripts consistently struggle here. Performance has to be built in from the start.
| Metric | What It Measures | Good | Poor | What Fails It |
|---|---|---|---|---|
| LCP | Load time of the largest visible element | Under 2.5 s | Over 4.0 s | Uncompressed images, slow server, render-blocking CSS |
| CLS | How much visible content shifts unexpectedly | Under 0.1 | Over 0.25 | Missing image dimensions, late-loading fonts, and injected ads |
| INP | Delay between any user interaction and page response | Under 200 ms | Over 500 ms | Heavy JavaScript, page builders, too many third-party scripts |
What UK SMEs Actually Lose When Core Web Vitals Fail
Google describes Core Web Vitals as one of several page experience signals that feed into ranking. In practice, for competitive queries where multiple pages have similar content quality and backlink profiles, web performance is often what separates position 4 from position 14. For queries like ‘core web vitals optimisation uk’, that gap translates directly into whether the right traffic reaches you at all.
Organic visibility
Google has continued to weigh page experience signals since the 2021 Page Experience update. Sites that fail all three metrics on mobile sit at a structural disadvantage for any keyword where competing pages perform better.
For UK and Irish SMEs, the practical effect shows up in Search Console: impressions from commercially relevant queries like ‘core web vitals optimisation uk’, but positions in the 30s and 40s rather than the top ten. The content is being indexed and associated with the right queries; website speed and web performance are suppressing it from positions where it would receive clicks.
Conversion rate
Google’s own research links a 0.1-second LCP improvement to an 8% increase in retail conversions. For a Northern Irish or Irish SME generating £300,000 through its website, that represents £24,000 in additional revenue.
CLS failures show clearly in session recordings: users tapping the wrong element because a layout shift moved it, users abandoning forms when content reflows, users leaving because the add-to-cart button jumped position. These are recoverable visitors being lost to a fixable technical problem.
Mobile-specific risk for UK and Irish markets
UK CrUX field data consistently shows mobile failing where desktop passes on the same page. Server latency for UK visitors adds 80 to 120 milliseconds compared to US-hosted servers. That’s often the difference between a passing and failing LCP score. A CDN with UK or Dublin nodes resolves that LCP penalty. 5G penetration across Northern Ireland and rural Ireland is uneven; assuming visitors arrive on fast connections is a mistake.
The consequence is a split performance profile: desktop passes, mobile fails. Google uses mobile data as the primary signal for mobile-first indexing, which applies to all sites. Passing on desktop while failing on mobile provides no ranking benefit.
How ProfileTree Builds for Core Web Vitals
Most Core Web Vitals problems aren’t random. They’re predictable consequences of specific web design and development decisions: the wrong hosting tier, a theme with too much JavaScript, images uploaded without compression, and fonts that block rendering. When these decisions are made correctly at the start of a project, website speed and web performance are healthy before the first visitor arrives. When they aren’t, fixing them later requires substantial rework.
Hosting and server configuration
LCP begins at the server. A US-hosted site adds 100 to 150 milliseconds of latency for UK and Irish visitors before the browser has received a single byte of the page. ProfileTree specifies UK or Dublin-based hosting for all client projects targeting these markets, and recommends a CDN with UK edge nodes for sites with meaningful traffic.
Server response time (Time to First Byte) should be under 600 milliseconds. Above that, LCP won’t reach the ‘good’ threshold regardless of what happens downstream. Sorting hosting at the start of a project is cheaper and more effective than trying to compensate for it with application-level optimisation later.
Image handling as a design discipline
Uncompressed images are the single most common cause of poor LCP and slow website speed across UK SME sites. A hero image uploaded at 2 MB in JPEG format will consistently push LCP above 4 seconds on a 4G connection. ProfileTree converts images to WebP format, sets explicit width and height attributes on every image element, and implements responsive image syntax so that mobile devices receive appropriately sized files rather than scaled-down desktop images.
Explicit width and height attributes serve a dual purpose: they let the browser pre-allocate space before the image loads, which eliminates that element’s CLS contribution. This is why image handling is a design decision as much as a technical one. A brief that doesn’t specify dimensions, formats, and loading behaviour will produce a site that fails both LCP and CLS regardless of development quality.
ProfileTree’s web design service treats image performance as part of the design specification rather than a post-launch task. Every project brief includes image format, compression, and responsive image requirements before a single file is uploaded to the CMS.
Theme and code architecture
The largest INP source on WordPress sites is JavaScript from the theme and page builder. A full-featured page builder can generate 400 to 600 kilobytes of JavaScript, parsed on the main thread before the page responds to any interaction. ProfileTree uses lightweight base themes (GeneratePress and Astra) and avoids page builders on performance-critical projects.
For WooCommerce sites, product pages are the highest-risk template: galleries, review widgets, and add-to-cart handlers all compete for main thread time. ProfileTree audits third-party script load order on every project, defers non-critical scripts, and removes any that load site-wide but are only needed on specific templates.
The website development principles that determine INP performance are covered in detail in ProfileTree’s website development service. When performance is built into the architecture decisions (hosting tier, theme choice, plugin selection, image handling), the site launches clean rather than requiring a remediation project six months later.
Platform performance by default
Not all platforms produce the same Core Web Vitals starting point. A correctly configured WordPress site on quality UK hosting, with a lightweight theme, caching plugin, and CDN, will achieve good scores without advanced optimisation. The same site on cheap shared hosting with a heavy page builder will fail all three metrics regardless of post-launch effort.
Shopify’s Online Store 2.0 themes are meaningfully faster than legacy themes. INP performance depends almost entirely on app management: each app that injects JavaScript into the storefront adds to the main thread load. Auditing installed apps against actively used functionality typically reveals several scripts that can be removed without any loss of functionality.
| Platform | Default LCP | Default CLS Risk | Default INP Risk | Key Lever |
|---|---|---|---|---|
| WordPress (optimised) | Good with the right theme and caching | Low if image dims set | Medium: depends on plugins | Theme, caching plugin, CDN |
| WordPress (unoptimised) | Often poor | Medium to high | High with page builders | Audit and strip scripts |
| Shopify (OS 2.0) | Good out of the box | Low | Medium: app injection | App audit; theme selection |
| Bespoke/headless | Excellent if built correctly | Very low | Low | Architecture decisions at build |
When an existing site is failing
For sites already live with poor scores, core web vitals optimisation UK practitioners consistently find the same root causes. The remediation sequence is: hosting first, then images (compress, WebP, explicit dimensions), then JavaScript (audit, defer, remove). Address render-blocking CSS last. Fixing CSS while LCP is still being dragged down by a slow server produces no visible improvement.
Lighthouse in Chrome DevTools breaks LCP into its constituent phases: Time to First Byte, resource load delay, resource load duration, and element render delay. Each phase has a different fix, which is why the sequence matters.
If your Search Console report is showing failing URLs, the most practical form of core web vitals optimisation UK sites can take is a structured template-by-template audit. ProfileTree’s SEO services include technical Core Web Vitals audits that identify the specific causes on your site and prioritise fixes by impact. The page-speed-focused version of that audit will also be available through profiletree.com/website-page-speed.
“The businesses we work with across Northern Ireland are often surprised by how much of their Core Web Vitals problem traces back to decisions that were made when the site was built. Server location, theme choice, how images are handled: get those three things right at the start and the site launches with clean scores. Get them wrong and no amount of post-launch optimisation fully compensates.”
Ciaran Connolly, Founder, ProfileTree
Measuring and Monitoring Your Scores
Before fixing Core Web Vitals, you need to know which pages are failing and why. The tools available for measuring web performance are split into two categories: lab tools that simulate page loads under controlled conditions, and field tools that report real user data. Both are useful; they answer different questions and should not be used interchangeably.
Lab tools vs field data
Lab tools (Lighthouse, PageSpeed Insights) give you a diagnostic score based on a single simulated load. They’re useful for finding causes because they break down every phase of load and flag specific issues with actionable suggestions. They don’t represent what real visitors on real devices in real network conditions experience.
Field data comes from the Chrome User Experience Report (CrUX), which aggregates real session data from Chrome users who have not opted out of reporting. PageSpeed Insights shows CrUX data alongside its lab score when sufficient traffic exists. Google Search Console’s Core Web Vitals report uses CrUX data exclusively. This is what Google uses as a ranking signal, not the lab score.
The common confusion is a high PageSpeed lab score alongside a failing Search Console assessment. Lab scores test ideal conditions; a site serving 4G visitors in Belfast or rural Donegal will produce field data considerably worse than a simulated test on a London server. Trust the field data for rankings; use the lab score to find causes.
Setting up Search Console monitoring
Google Search Console groups pages by URL pattern and shows whether each group is passing, needs improvement, or is poor. Verify your site in Search Console, go to Experience, then Core Web Vitals, and review the mobile and desktop reports. Pages grouped as ‘Poor’ should be prioritised first.
A common misreading of the report is treating all pages in a failing group as having the same problem. Grouping is by URL template, not by cause; each template needs its own Lighthouse diagnostic run.
| Tool | Data Type | Best For | Limitation |
|---|---|---|---|
| PageSpeed Insights | Lab and field | Diagnosing a single page | Lab score can mislead on real user data |
| Google Search Console | Field (CrUX) | Site-wide status by URL group | Needs a minimum traffic per page to populate |
| Chrome UX Report | Field (CrUX) | Benchmarking against competitors | Requires BigQuery for deep queries |
| Lighthouse (DevTools) | Lab only | Finding causes during development | Simulated conditions, not real users |
Ongoing monitoring
Core Web Vitals scores don’t stay static. A plugin update, an uncompressed image upload, or a new third-party widget can push a passing website speed score into failure. A monthly Search Console check and a Lighthouse run after any template change is the minimum habit for an SME that’s managing its own site.
For businesses that want consistent monitoring without the overhead, ProfileTree’s website hosting and management service includes regular performance audits as part of the ongoing retainer. Problems are flagged before they affect rankings rather than after a Search Console alert.
Core Web Vitals as a Web Design Standard
Core Web Vitals measure what it costs a real visitor to use your website. Loading speed, layout stability, and interaction responsiveness aren’t arbitrary technical benchmarks: they’re the aspects of web experience users notice and react to, even if they’d never describe them in those terms. A visitor who sees a blank screen for four seconds, or whose tap hits the wrong button because the layout shifted, doesn’t think ‘poor LCP’. They leave.
For SMEs across the UK and Ireland, the gap between sites with good Core Web Vitals and sites that fail is almost always a gap in how the site was specified and built, not in post-launch SEO effort. Hosting, theme, image handling, and plugin discipline: these are foundational. They’re the web design and website development decisions that determine website speed and web performance before the first visitor arrives.
ProfileTree works with businesses across Northern Ireland, Ireland, and the UK on website development and web design projects where Core Web Vitals performance is built into the specification from the start. If your current site is failing its assessment, our technical SEO audit identifies the causes and produces a prioritised remediation plan.
FAQs
1. What is a good Core Web Vitals score?
Google defines ‘good’ web performance as LCP under 2.5 seconds, CLS under 0.1, and INP under 200 milliseconds. All three thresholds are assessed at the 75th percentile of real user data: 75 per cent of your visitors must hit the good range. Failing any one of the three puts the page into ‘needs improvement’ or ‘poor’ in Search Console.
2. How long after fixing Core Web Vitals does Google update the scores?
Search Console uses a 28-day rolling window of CrUX field data. After making improvements, allow at least four weeks before checking whether scores have changed. Pages with low traffic take longer because CrUX requires a minimum volume of real sessions.
3. Can a site rank well in the UK without passing Core Web Vitals?
Yes. Google treats Core Web Vitals as a tiebreaker, not a primary ranking determinant. Strong content and good backlinks will outrank a technically fast but thin page. For UK SMEs, core web vitals optimisation UK strategy is most valuable where competing pages have comparable content: performance can be what separates position 3 from position 13.
4. Why does my site score well on PageSpeed Insights but fail in Search Console?
PageSpeed Insights produces a lab score based on a single simulated load, while Search Console shows field data from real user sessions. Real devices on real connections don’t perform as well as a simulated test, and that gap is especially pronounced in the UK and Irish markets, where 4G accounts for a large share of traffic. Field data is what determines your ranking signal.
5. How much does it cost to fix Core Web Vitals on a WordPress site?
The cost of core web vitals optimisation UK businesses face depends on what’s causing the issue. Compression, a CDN, and a caching plugin can be sorted in a day to improve website speed noticeably. INP failures may require a partial rebuild; ProfileTree provides standalone audits to scope the work accurately before any commitment