Social Media Usage: Key Statistics, Trends and Business Impact
Table of Contents
Social media usage has passed the point of being a trend worth monitoring. With nearly five billion active users globally and the average person spending close to two and a half hours per day on social platforms, it is now a primary channel through which businesses reach, influence, and retain customers.
This article looks at the real numbers behind social media usage, how the major platforms compare, what the shift in user behaviour means for marketers, and how businesses can make better decisions based on what the data actually shows.
How Social Media Usage Has Changed
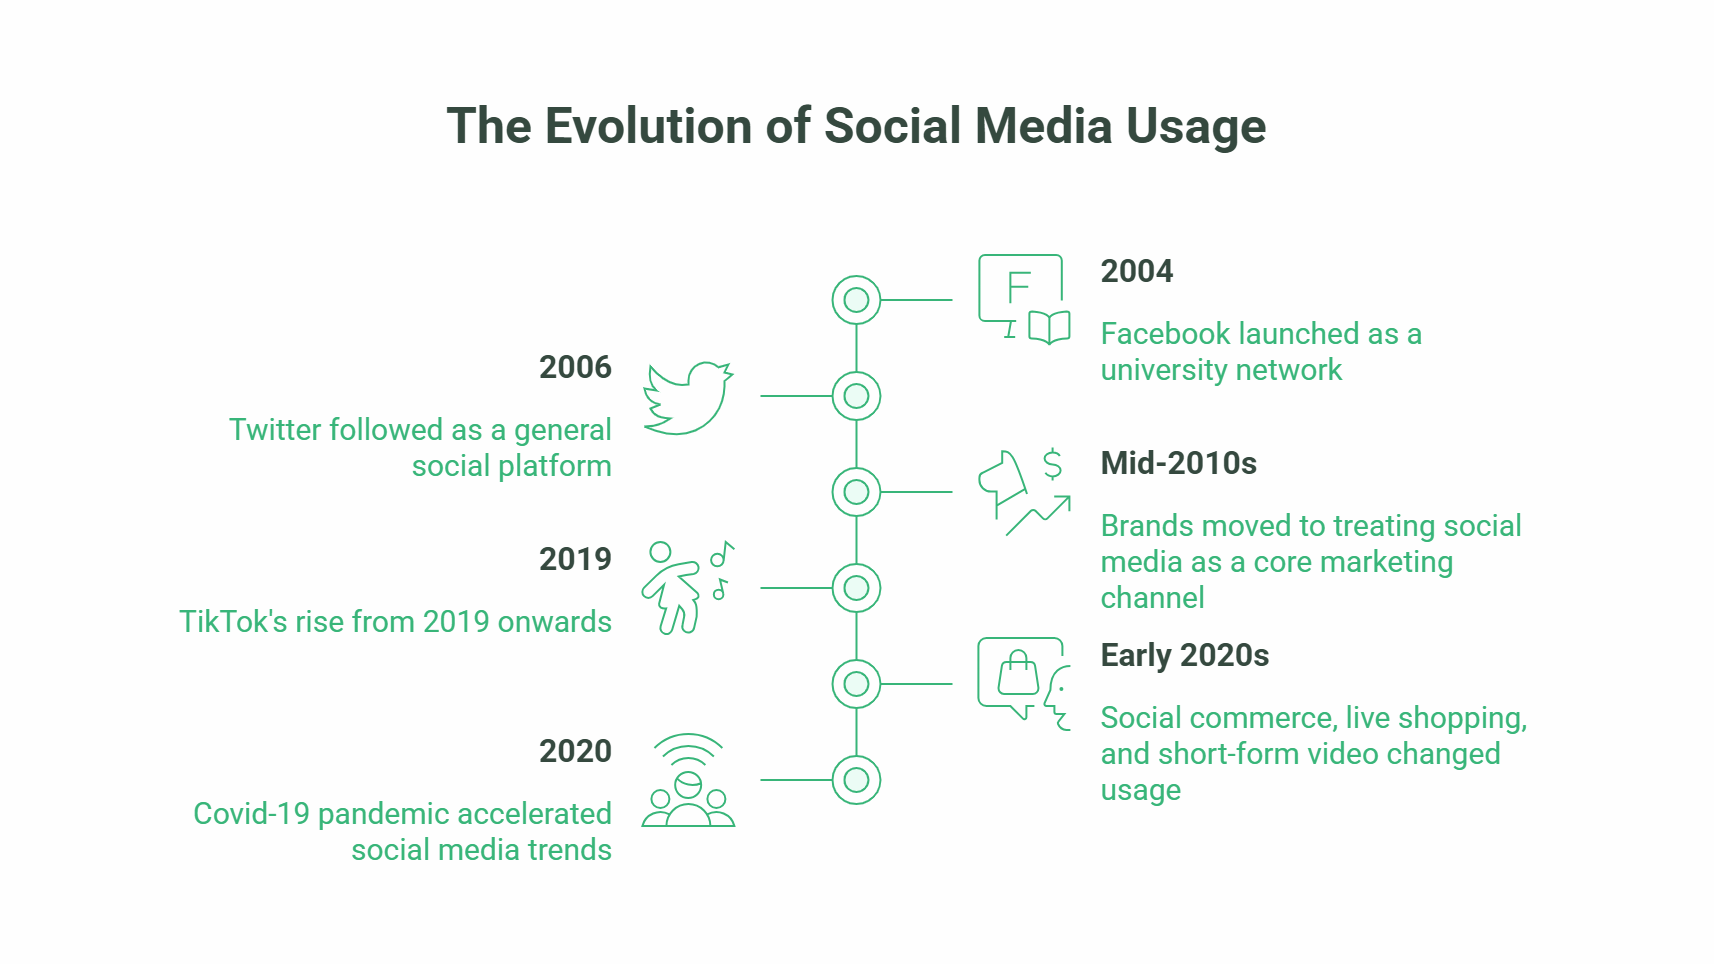
Social media started as a tool for personal connection. Facebook launched in 2004 as a university network. MySpace preceded it as a general social platform. Twitter followed in 2006. None of these platforms was designed with commercial activity in mind.
What followed was a rapid evolution driven by mobile adoption, algorithm-driven feeds, and the shift from text to visual and video content. By the mid-2010s, brands had moved from experimenting with social media to treating it as a core marketing channel. By the early 2020s, social commerce, live shopping, and short-form video had further changed how users and businesses used these platforms.
The COVID-19 pandemic accelerated existing trends significantly. With physical retail and in-person interaction restricted, both users and businesses increased their social media activity. Time spent on platforms jumped sharply in 2020 and has largely remained elevated since.
From personal to professional to commercial
The evolution of social media usage follows a clear arc. First, platforms captured personal communication. Then, professional networking (LinkedIn being the clearest example). Then, commercial activity: advertising, influencer marketing, social commerce, and customer service.
Today, a business’s social media presence is often the first point of contact a potential customer has with the brand, before the website, before a sales conversation, and sometimes before any Google search. That shift in the purchase journey has significant implications for how businesses allocate marketing resources.
The role of video in changing usage patterns
Short-form video has restructured how people consume content on social platforms. TikTok’s rise from 2019 onwards forced every other major platform to respond. Instagram introduced Reels. YouTube introduced Shorts. Facebook introduced Reels on its platform. LinkedIn has even introduced short video features.
The data confirms the shift: video content generates higher engagement rates than static images or text across every major platform. For businesses, this means that a social media strategy built primarily around static graphics and text posts is increasingly at a structural disadvantage, regardless of content quality.
Social Media Usage Statistics: The Numbers That Matter
Understanding social media usage statistics helps businesses make informed decisions about where to invest time and budget. The headline numbers are useful for context; the platform-level breakdowns are where actionable decisions come from.
Global usage figures
As of 2024, there are approximately 5.07 billion social media users worldwide, accounting for roughly 62% of the global population. This figure has grown consistently year on year since reliable tracking began, though the rate of growth has slowed as penetration in developed markets approaches saturation.
Daily active users, a more commercially relevant metric than monthly active users, remain high across the major platforms. Facebook reports approximately 2 billion daily active users. Instagram and TikTok both report over 500 million daily active users. WhatsApp, often overlooked in marketing discussions, has over 2 billion daily active users and is increasingly relevant for business messaging in certain markets.
Time spent per day
The average global user spends approximately 2 hours and 23 minutes per day on social media. This figure varies considerably by age group: users aged 16 to 24 typically spend closer to 3 hours per day, while users over 45 spend less but are increasing their usage. In the UK, average daily social media usage sits at around 1 hour 49 minutes.
For businesses, the time-spent figure matters because it indicates the size of the available attention pool. Social platforms compete for a finite amount of daily attention. The businesses and content creators who understand how to earn attention within that window perform better than those who simply post and hope.
Engagement rate benchmarks
Organic engagement rates have declined steadily across most major platforms over the past decade, as feeds have become more competitive and algorithmic. Average organic engagement rates on Facebook are now typically below 2% for business pages. Instagram averages around 1.5 to 3% for business accounts, with Reels performing higher. LinkedIn sits between 2 and 5% for well-optimised company pages.
These benchmarks matter when setting expectations for organic social media activity. Businesses expecting double-digit engagement from organic posts without a meaningful existing audience or paid support are likely to be disappointed.
The Major Platforms: How Usage Differs
Social media usage is not uniform across platforms. Each has a distinct user base, content format, and commercial context. Treating them as interchangeable leads to wasted effort.
Facebook remains the largest social media platform by total users, with over 3 billion monthly active users as of 2024. Its user base has aged: the fastest-growing demographic on Facebook is now users over 35, and engagement among younger users (under 25) has declined significantly over the past five years.
For businesses, Facebook’s strengths lie in its advertising infrastructure and in community-building through Groups. Organic reach for business pages has compressed sharply; paid campaigns remain one of the more cost-effective ways to reach specific demographic and interest-based audiences at scale.
Instagram has over 2 billion monthly active users and remains strong across the 18 to 34 age range. It is a visual platform where the quality of imagery and video directly affects performance. Reels consistently outperform static posts in reach. Stories provide a lower-commitment format for regular updates.
For businesses selling products or services with a strong visual component (food, interiors, fashion, hospitality, professional services with tangible outputs), Instagram remains a high-priority channel. For B2B businesses with less visual output, the return on investment is often lower.
TikTok
TikTok has over 1 billion monthly active users and is particularly strong among users aged 18 to 34, though its audience is broadening. Its algorithm prioritises content performance over follower count, which means a new account can reach a large audience with a single strong video. This makes it genuinely different from other platforms, where reach is largely a function of existing audience size.
For businesses, TikTok rewards authenticity and consistency over polished production. Brands that have performed well on the platform tend to commit to regular posting, engage with trends quickly, and create content that fits the platform’s native style rather than repurposing material from elsewhere.
LinkedIn has over 1 billion members, with approximately 300 million monthly active users. It is the dominant platform for B2B marketing and professional content. Engagement on LinkedIn is growing, particularly for video content, newsletters, and thought leadership posts from individuals rather than company pages.
For B2B businesses, LinkedIn is often the highest-value social channel in terms of lead quality, even if volume is lower than on consumer-facing platforms. Decision-makers at target companies are reachable here in a way they are not on most other social platforms.
Pinterest and Snapchat
Pinterest retains a dedicated audience of approximately 500 million monthly active users, skewed toward women aged 25 to 54. It functions more as a visual search engine than a social network, with users actively searching for ideas in categories like home, food, fashion, and lifestyle. For businesses in those categories, Pinterest traffic can be high-intent and commercially valuable.
Snapchat has around 400 million daily active users, predominantly aged under 30. Its ephemeral content format and augmented reality features have kept it relevant among younger audiences, though it has a smaller commercial ecosystem than the major platforms.
Social Media Marketing: What the Data Tells Businesses
The shift from personal to commercial social media usage has created a complex marketing environment. The opportunity is real; so is the noise.
Organic versus paid reach
The decline of organic reach across major platforms is one of the most consistent themes in social media marketing over the past decade. In 2012, an average Facebook post from a brand page reached around 16% of its followers. By 2024, that figure is typically below 2%.
This does not mean organic social media is worthless. It means organic content now serves a different function: building credibility, demonstrating expertise, and maintaining a presence for people who are already aware of the brand. Paid social media is the primary tool for reaching new audiences at scale.
Ciaran Connolly, founder of ProfileTree, frames it plainly: “Most businesses that are frustrated with social media are treating it as a free advertising channel and expecting broadcast results. It works differently. Organic content builds trust with people who already know you. Paid content puts you in front of people who do not.”
Influencer marketing and user-generated content
Influencer marketing has grown into a substantial industry, with global spend estimated at over $21 billion in 2023. The shift in recent years has been away from high-follower celebrity partnerships toward micro-influencers (typically 10,000 to 100,000 followers) and nano-influencers (under 10,000 followers). Smaller influencers typically have higher engagement rates and more trusted relationships with their audiences, which translates to better conversion performance for brands.
User-generated content (UGC) sits alongside influencer marketing as an authenticity signal. Reviews, customer photos, unboxing videos, and testimonials shared on social platforms carry more credibility with potential buyers than brand-produced content. Building systems that encourage and surface UGC is a more scalable long-term approach than relying solely on paid influencer activity.
Social media analytics and measurement
Measuring social media performance accurately is harder than most businesses realise. Vanity metrics like follower count, likes, and impressions are easy to track but often poorly correlated with commercial outcomes. The metrics that matter are those connected to business objectives: click-through rate to your website, lead form completions, direct messages from potential customers, and, where trackable, conversions and revenue attributable to social traffic.
Most major platforms provide native analytics dashboards. Third-party tools offer more sophisticated cross-platform reporting and competitive benchmarking. Any social media strategy should define what success looks like in commercial terms before settling on which metrics to track.
Social Media Usage and Mental Health: What the Evidence Shows
The relationship between social media usage and mental health is one of the most studied and debated topics in contemporary psychology. The evidence is more nuanced than both the alarmist headlines and the platform-produced reassurances suggest.
What the research actually shows
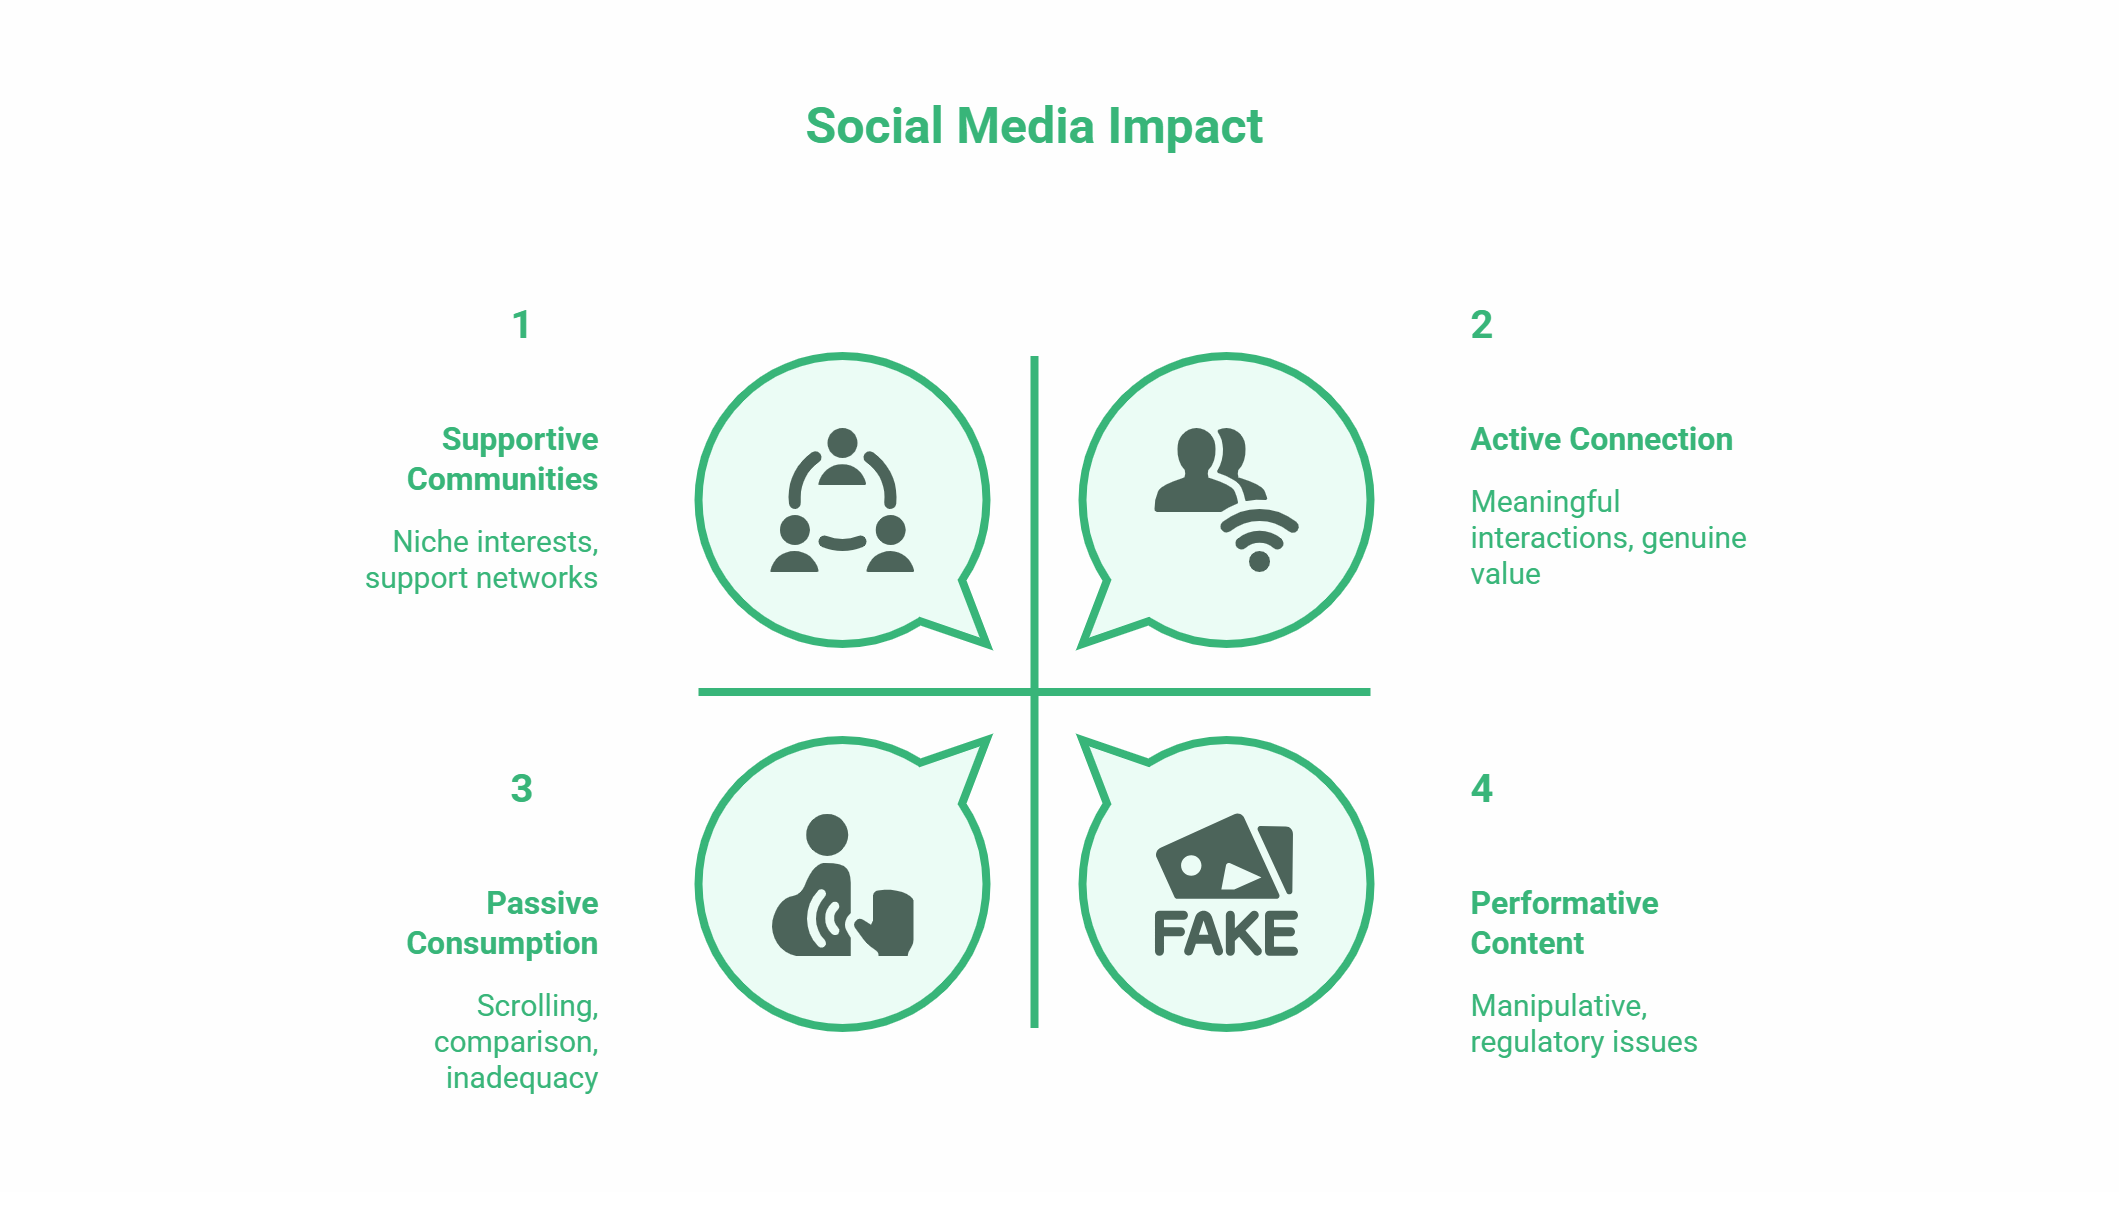
Studies consistently find that passive social media consumption (scrolling without interacting) is more negatively associated with well-being than active participation (posting, commenting, messaging). The comparison dynamic is also well-evidenced: exposure to curated, aspirational content is associated with increased feelings of inadequacy, particularly among adolescents and young adults.
However, social media also provides genuine benefits: connection for isolated individuals, community for people with niche interests, access to support networks, and a platform for self-expression. The net effect on any individual depends heavily on how they use it, who they follow, and what they compare themselves to.
Implications for businesses
For businesses operating in the social space, the mental health conversation has practical implications. Advertising regulations around body image, weight loss, and cosmetic procedures have tightened. Influencer disclosure requirements have increased. Audiences are more alert to performative or manipulative content than they were five years ago.
Building social media presence on authenticity and genuine value, rather than manufactured aspiration, is both an ethical choice and, increasingly, a commercially sensible one.
What This Means for SMEs
For small and medium-sized businesses in the UK and Ireland, the social media landscape requires realistic expectations and clear priorities.
Not every platform is worth the investment for every business. A Belfast-based accountancy firm and a Dublin restaurant need entirely different social media strategies, both in terms of platform choice and content approach. Spreading effort thinly across every platform is a common mistake that produces mediocre results everywhere rather than good results somewhere.
ProfileTree’s social media and digital marketing services help SMEs across Northern Ireland and the UK develop focused strategies based on where their specific audience actually spends time and what content formats genuinely drive enquiries. Our social media and content marketing services cover strategy, content creation, and performance tracking for businesses that want a clearer return from their social investment.
Frequently Asked Questions
How many people use social media globally in 2024?
As of 2024, approximately 5.07 billion people use social media globally, representing around 62% of the world’s population. This figure has grown consistently year on year, though growth is slowing in markets where penetration is already high.
Which social media platform has the most users?
Facebook has the most users of any single platform, with over 3 billion monthly active users. YouTube is second in monthly users. WhatsApp has over 2 billion daily active users. Instagram and TikTok both exceed 1 billion monthly active users.
How much time do people spend on social media each day?
The global average is approximately 2 hours and 23 minutes per day, though this varies significantly by age group and country. Younger users (16 to 24) typically spend closer to 3 hours per day. The UK average daily social media time is around 1 hour and 49 minutes.
Is organic social media still worth investing in for businesses?
Yes, but with realistic expectations. Organic social media builds credibility and maintains visibility with existing audiences. It no longer reliably reaches new audiences at scale on most platforms. A balanced approach uses organic content for brand-building and paid social media for audience growth and lead generation.
What is the best social media platform for B2B businesses?
LinkedIn is consistently the strongest platform for B2B marketing in terms of audience quality, though volume is lower than consumer-facing platforms. For most B2B businesses, a well-maintained LinkedIn presence combined with targeted LinkedIn advertising outperforms an equivalent investment spread across multiple platforms.
How does social media usage affect mental health?
The evidence shows that passive scrolling and social comparison are associated with lower wellbeing, particularly among young people. Active participation and connection-driven usage are associated with more positive outcomes. The net effect depends heavily on individual usage patterns, content consumed, and the platforms involved.