25 Social Media Marketing Statistics That Actually Change Decisions
Table of Contents
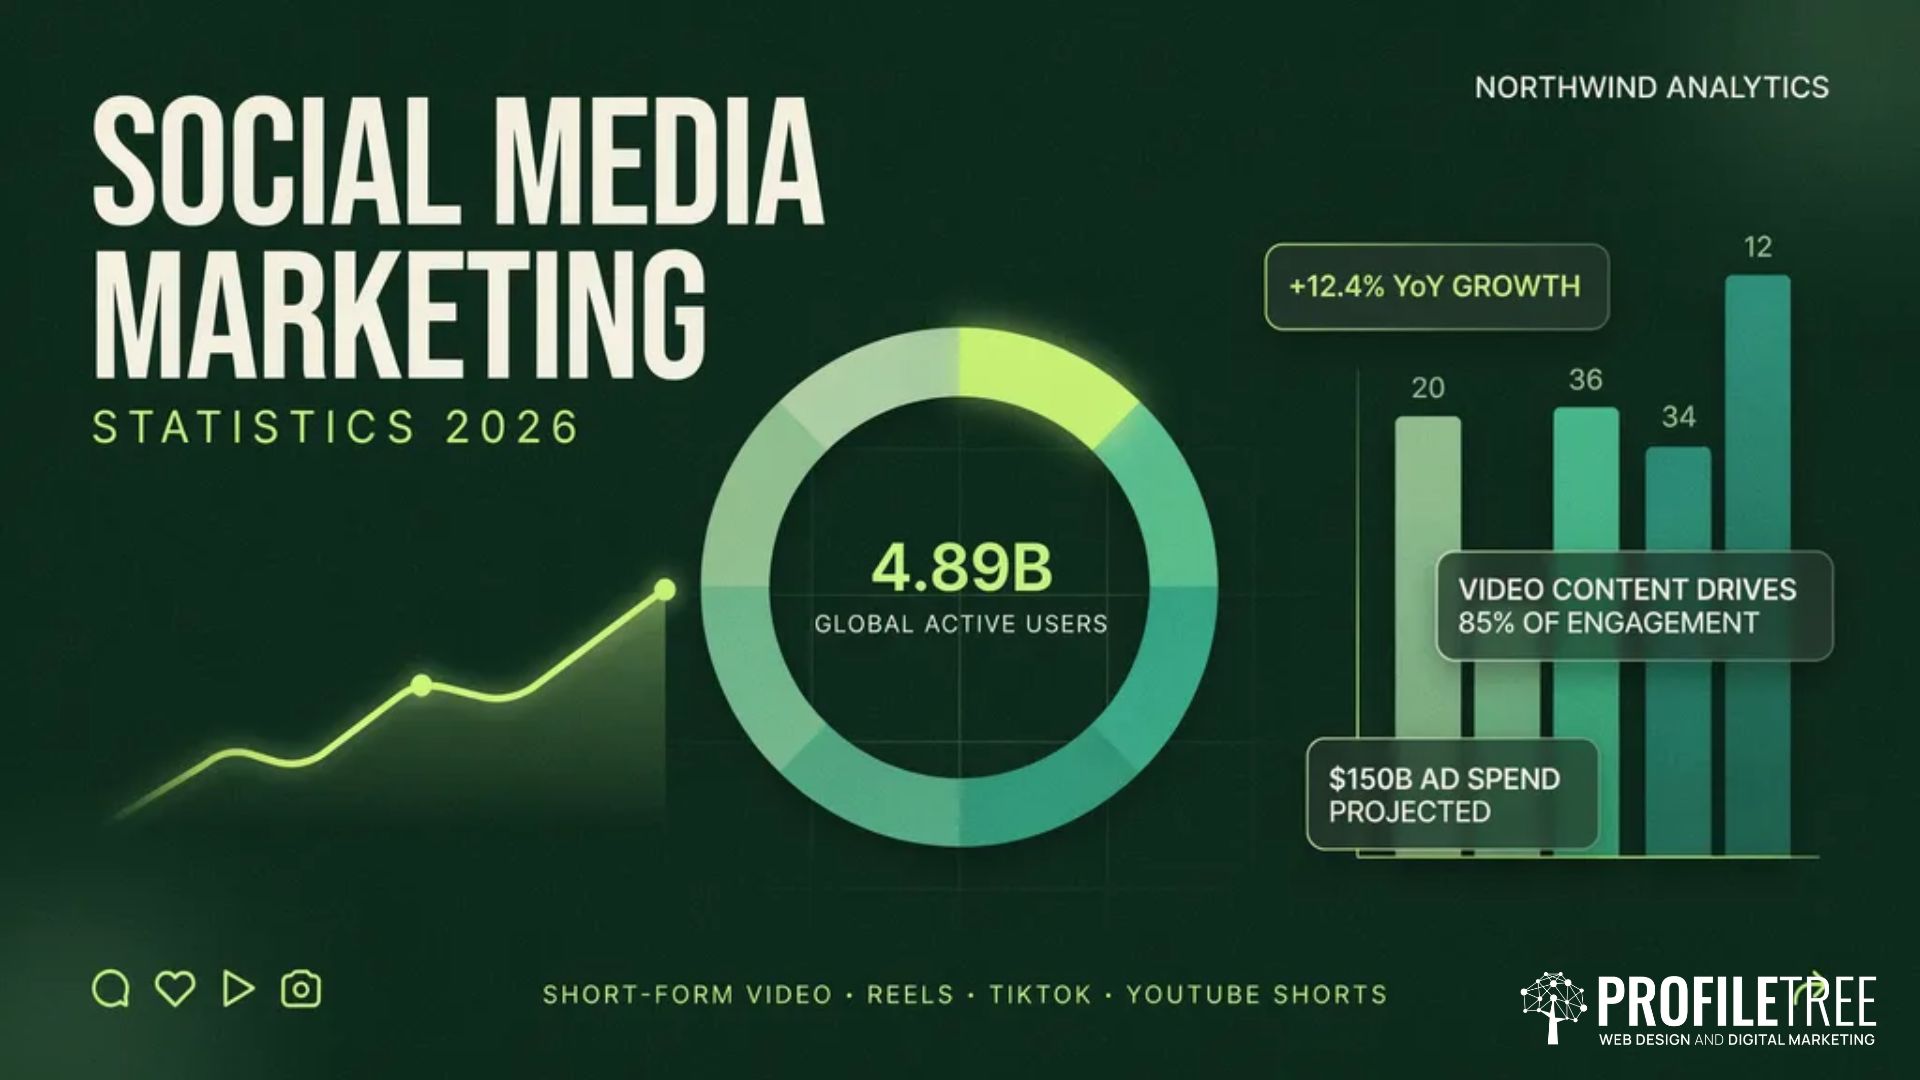
Social media reached 5.79 billion user identities by April 2026, nearly 70% of the world’s population, and the typical person now uses 6.5 platforms each month. The statistics that matter tell you where to post, what format to make and how much to spend. ProfileTree, a Belfast digital agency, turns this data into social campaigns for SMEs across the UK and Ireland.
Most businesses collect social media marketing statistics and then do nothing with them. The numbers land in a quarterly slide that nobody acts on. The point of platform data isn’t to fill a report, it’s to settle the arguments you keep having: which platform deserves the budget, whether video earns its production cost, and why your posts get seen but not clicked. This guide treats each figure as an input to a decision rather than a fact to admire, and every number here is tied to a dated 2026 source you can check.
If you’d rather hand the planning to a team that does this daily, ProfileTree builds social media marketing for SMEs and wires it into a wider digital strategy so social isn’t running on its own.
How To Read Social Media Marketing Statistics Without Fooling Yourself
Start here: a benchmark is a starting line, not a target. Engagement rates swing widely by industry, audience size and the formula a tool uses, so a “good” rate for a university on TikTok looks nothing like a “good” rate for a financial services firm on LinkedIn. Read every figure below as a range, then check it against your own analytics before you act.
Match The Statistic To The Decision
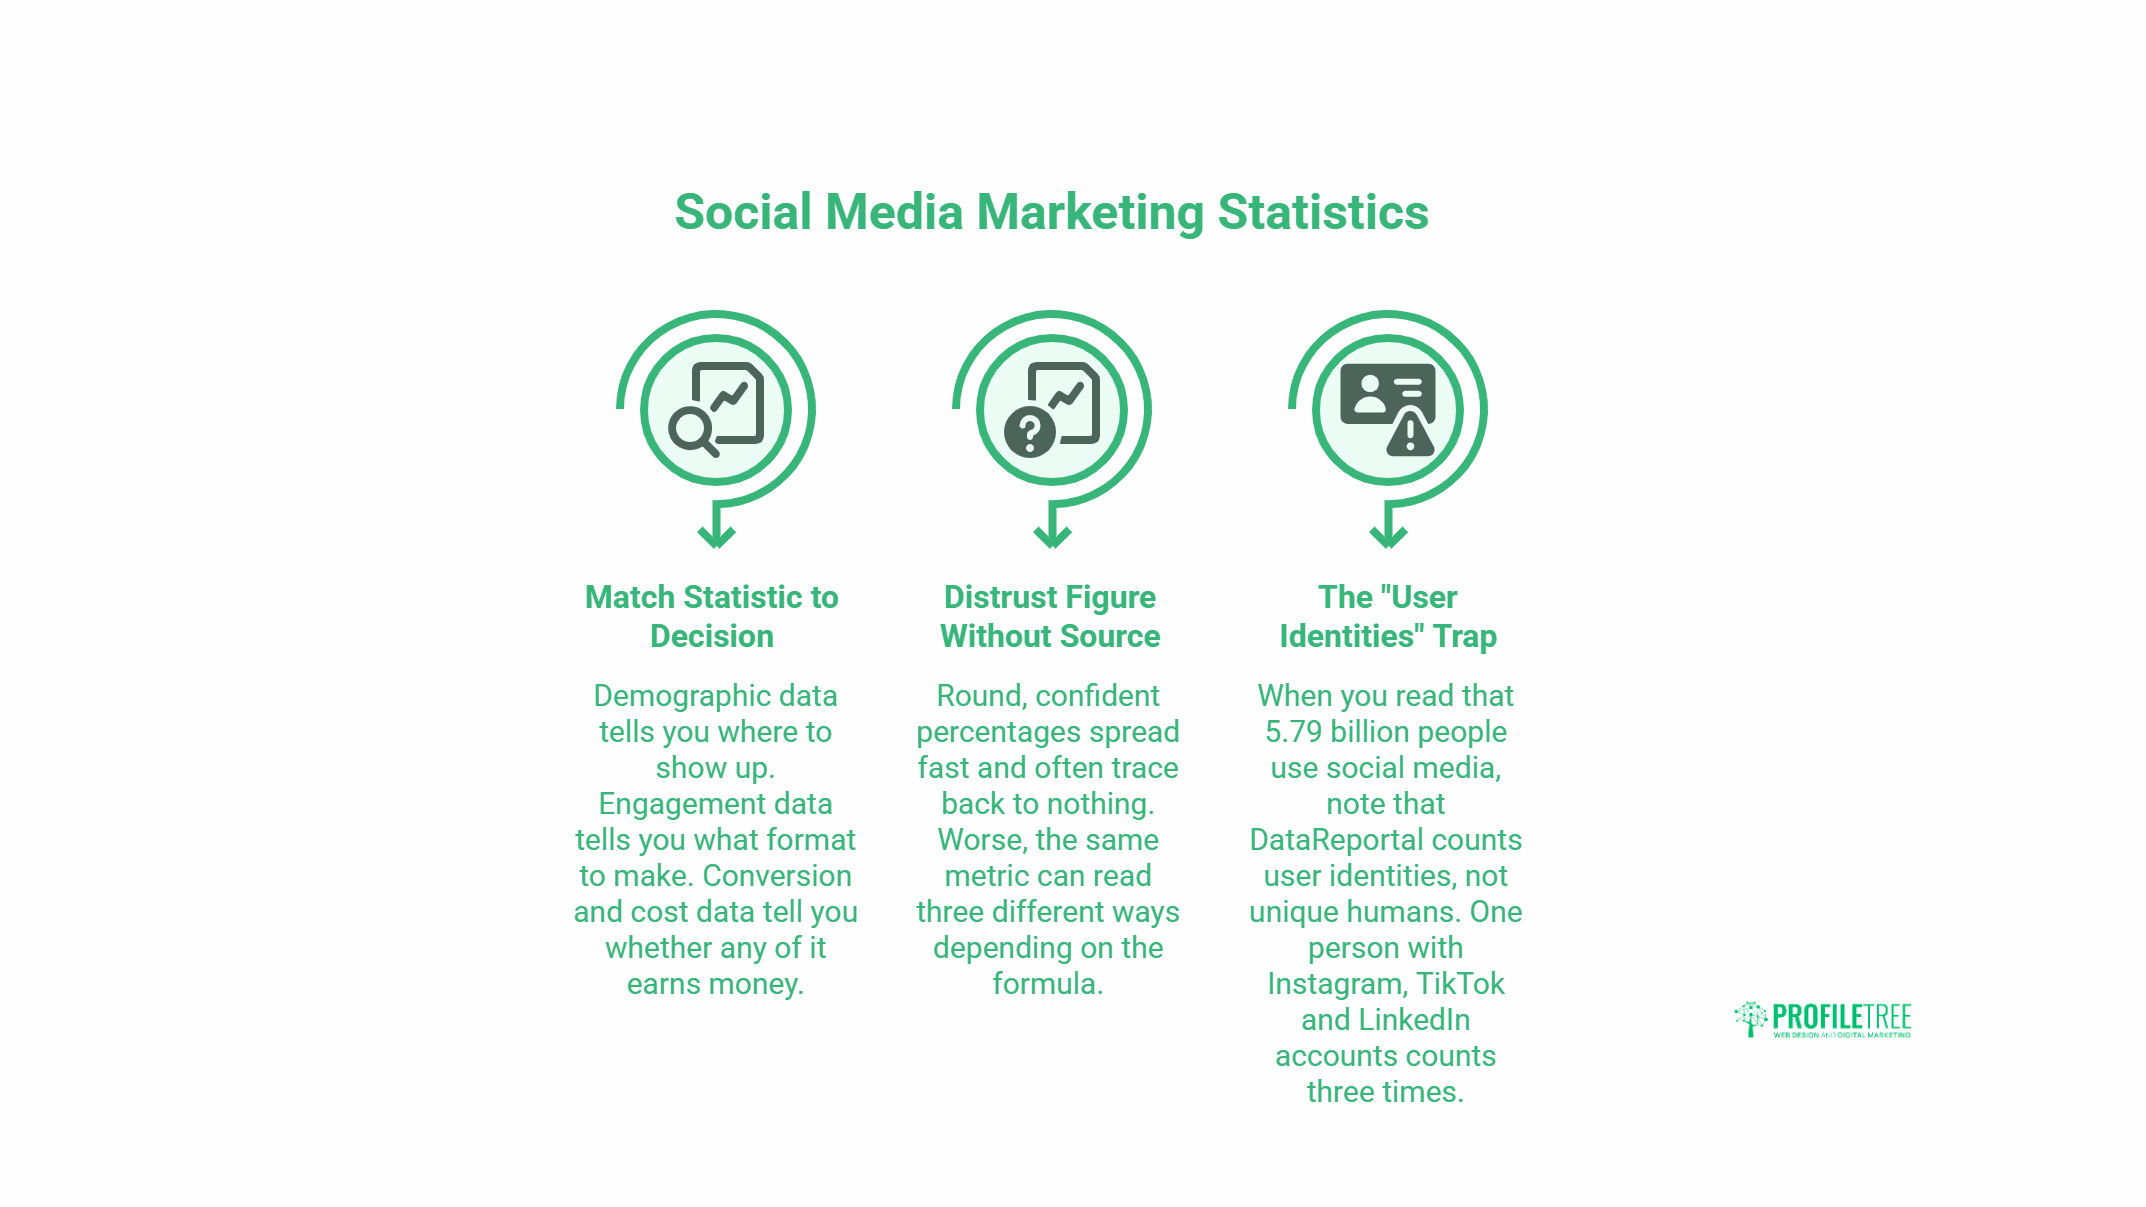
Demographic data tells you where to show up. Engagement data tells you what format to make. Conversion and cost data tell you whether any of it earns money. Keep those three jobs separate, and the numbers get far easier to use. A platform’s user count is irrelevant if your customers aren’t among them.
Distrust Any Figure Without A Source
Round, confident percentages spread fast and often trace back to nothing. Worse, the same metric can read three different ways depending on the formula: engagement divided by followers, by reach, or by impressions, all of which produce different numbers, and all are technically correct. Before you build a budget on a figure, find the study behind it, check the date, and check the denominator.
The “User Identities” Trap
When you read that 5.79 billion people use social media, note that DataReportal counts user identities, not unique humans. One person with Instagram, TikTok and LinkedIn accounts counts three times. The headline reach is real, but it overstates the number of individuals you can actually reach.
Where Your Audience Actually Is In 2026
Bottom line: pick platforms by where your customers spend time, not by the platform with the biggest headline number. Below is the current picture, and what it means for a small business that can’t be everywhere.
The Numbers Worth Knowing
Social media reached 5.79 billion user identities by April 2026, about 69.9% of the global population, and that figure grew by 294 million in a year (a 5.4% annual rate). The typical user now actively uses 6.5 platforms each month and spends roughly 18 hours and 36 minutes a week on social media. Around 83% of that use happens on mobile, which settles the question of whether your content needs to work on a phone first.
Platform Reach: What Changed This Year
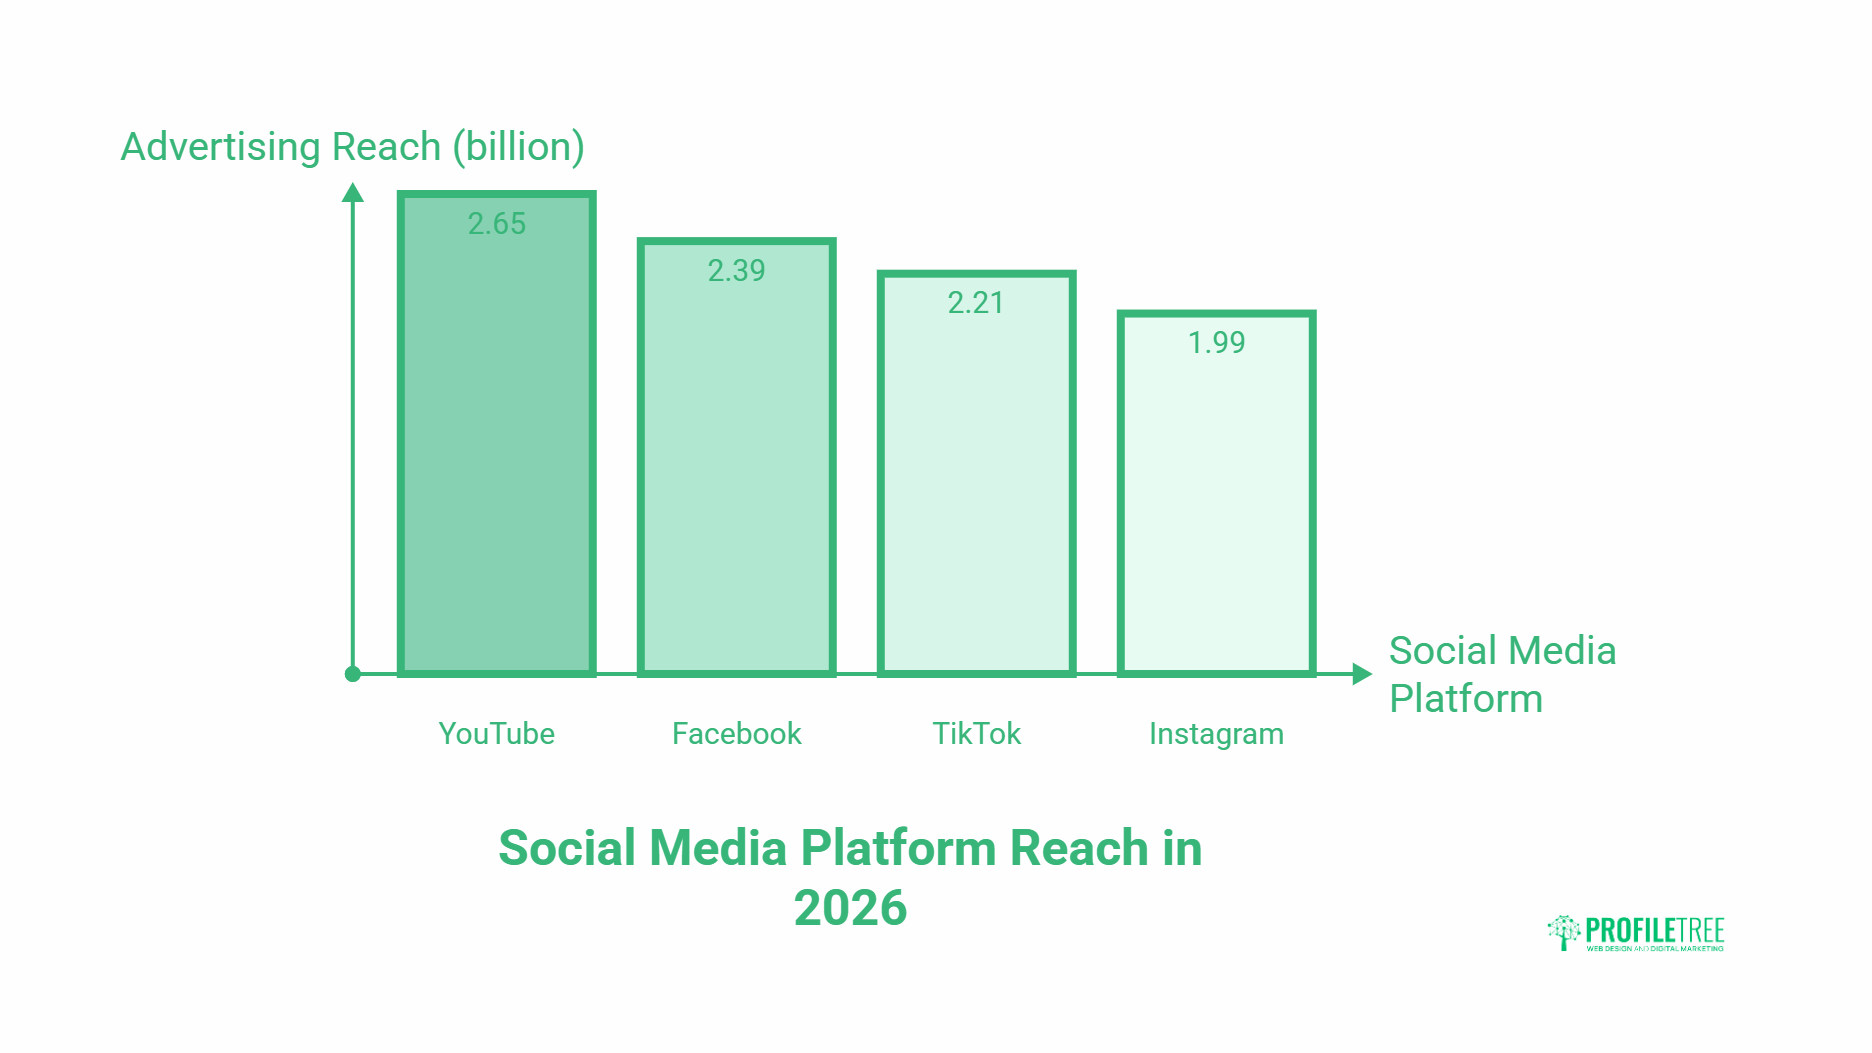
On self-reported monthly use among internet users aged 16 and over, Facebook still leads at 73.4%, with Instagram (71.4%), YouTube (70.6%) and WhatsApp (69.8%) close behind, and TikTok at 47.5%. On a different measure, advertising reach, the leaderboard reordered in 2026: YouTube now tops it at 2.65 billion, ahead of Facebook (2.39 billion), TikTok (2.21 billion) and Instagram (1.99 billion). The two measures answer different questions, which is exactly why you check the methodology before quoting a number.
What This Means For An SME
You almost certainly don’t need all of them. The “be everywhere” approach is over. A B2B services business in Belfast gets more from LinkedIn and YouTube than from chasing TikTok trends. A local retailer or hospitality brand usually does better on Instagram and Facebook. Picking two platforms and doing them properly beats spreading thin across seven. This is the first decision ProfileTree settles when planning digital marketing services for a client.
ProfileTree’s team walks through choosing and managing platforms in this short guide, useful if you’re deciding where to commit your effort.
Engagement Benchmarks By Platform
Bottom line: engagement rate is the clearest early signal that your content fits the platform. The table below uses follower-based rates from 2026 benchmark reports. Confirm against your own data, and against your industry, before setting any target.
| Platform | Typical Engagement (2026, Follower-Based) | Format That Tends To Win |
|---|---|---|
| TikTok | ~3.4% to 3.7% (highest of any platform) | Native short video, trending audio |
| ~2% to 5% (company pages) | Document/carousel posts | |
| ~0.5% (down ~17% year on year) | Carousels, then Reels | |
| ~0.15% (organic, historically low) | Video and Reels | |
| X (Twitter) | Below 0.15% for most brands | Threads and replies |
The Single Most Useful Engagement Statistic
LinkedIn document and carousel posts hit a 21.77% median engagement rate in Buffer’s 2026 analysis of 52 million posts, roughly three times the platform’s video and image formats. If you sell to other businesses and you’re posting single images to LinkedIn, you’re leaving most of your reach unused. That one format change is among the cheapest performance wins available this year.
Why Format Beats Frequency
Posting more often rarely fixes weak engagement. The pattern across platforms is consistent: native video and carousels pull more interaction than static images or link drops. Replying to comments lifts engagement too, by around 42% on Threads, 30% on LinkedIn and 21% on Instagram in Buffer’s data. If you’re posting five times a week and getting nothing back, change the format and start replying before you change the schedule.
What Content Strategy This Points To
The data keeps landing on the same instruction: make a video and make it native to each platform. That’s usually where in-house effort stalls. ProfileTree runs video marketing for this reason, and pairs it with content marketing services so the videos serve a planned calendar rather than appearing at random. AI tools are now part of that production line, which is where AI-enhanced marketing earns its place.
Advertising: What It Costs And Where It Goes
Bottom line: organic reach keeps shrinking, so most serious social strategies now include paid spend, and the cost varies enormously by platform. Global social media ad spend passed $230 billion in 2025.
The Cost Picture
The average CPM (cost per thousand impressions) across social platforms sits around $8.50, but the spread is wide. LinkedIn runs near $33 CPM, the highest of the major platforms, reflecting its professional audience, while TikTok is among the cheapest at roughly $6.50. That gap is the whole argument for matching platform to goal: LinkedIn is expensive per impression but cheap per qualified B2B lead, and the reverse holds for broad consumer reach.
Why Organic Alone Rarely Works Now
Organic Facebook reach now lands around 2% to 5% of your existing followers. That’s not a content problem you can fully fix with better posts. For most SMEs, the realistic model is organic content to hold the audience you have, plus targeted paid spend to reach new people. Deciding the split is a budgeting question ProfileTree handles inside a digital strategy plan rather than per-platform guesswork.
“The teams that get value from social media data are the ones who walk in with a question. They’re not asking what the engagement rate is, they’re asking whether the carousel format is worth the design time this quarter. The number only earns its keep once there’s a decision waiting on it.” Ciaran Connolly, founder of ProfileTree
B2B Social Media: A Different Game
Bottom line: B2B social is about authority and lead nurture across a long buying cycle, not quick conversions. The platform that carries it is LinkedIn, and the format that works there is clearer than ever.
Why LinkedIn Carries B2B
LinkedIn’s strength in B2B isn’t really about user count, it’s about audience mindset: decision-makers and practitioners arrive in a professional context. B2B SaaS pages lead LinkedIn engagement at around 2.8% median in 2026 benchmarks, above the platform average, because the content (thought leadership, product launches) matches what the audience came for. Manufacturing, construction and professional services also outperform expectations there.
Content That Earns Attention In B2B
The pattern is consistent enough to plan around: case studies, original data and educational video outperform product-led posts. Carousels are the standout format, given that 21.77% median engagement rate. If you sell to other businesses, your strongest social asset is usually a real client outcome told plainly in a format the platform rewards.
Turning B2B Attention Into Pipeline
Social rarely closes a B2B deal on its own. It works as one touchpoint in a sequence that includes search, email and the website. ProfileTree connects social activity to search engine optimisation and email marketing so a prospect who finds you on LinkedIn lands somewhere that moves them forward. A growing share of that nurture now runs through AI chatbots handling first-touch enquiries.
Social Media Versus Email: Which Earns More
Bottom line: email still tends to return more per pound than social, but they do different jobs, so the sensible answer for most SMEs is both. Social builds and reaches the audience; email converts the people who already raised a hand.
How To Split The Effort
Use social for reach and recall, especially through video, where attention already sits. Use email for offers and follow-up to a known list. Treating either as a replacement for the other leaves money on the table. The connective tissue is your website: both channels should point to a page with a clear next step, which is why social, email and the site get planned together rather than in isolation.
How ProfileTree Turns These Statistics Into A Plan
Bottom line: data is the input, not the work. The work is deciding which two platforms to commit to, what formats to make, how much to put behind paid, and how to measure whether it paid off.
What The Process Looks Like
ProfileTree starts by reading your own analytics against current benchmarks, so any target is grounded in your audience rather than a borrowed average. From there, the plan covers platform selection, content formats, a realistic cadence, paid budget split, and the conversion path back to your site. For teams building the skill in-house, ProfileTree also runs digital training so the strategy keeps running after handover.
Where It Connects To Everything Else
Social performs best wired into the rest of your marketing: the website design it points to, the development and hosting that keep it fast, and the search visibility that supports it. For businesses going further, ProfileTree also handles AI transformation across the wider marketing stack.
Frequently Asked Questions
Which Social Media Platform Has The Highest ROI For Businesses?
It depends entirely on your audience and what you sell, so any single answer misleads. LinkedIn tends to give B2B companies the strongest return because the buying audience is already there in a professional mindset, even though its cost per impression is the highest of the major platforms at roughly $33 CPM. Consumer brands more often see better returns on Instagram and TikTok, where cheaper reach and visual content do the heavy lifting. The reliable approach is to match the platform to where your specific customers spend time and to the stage of the funnel you’re trying to influence, then measure against your own baseline rather than a published industry average. ROI is decided by fit, not by the platform’s headline numbers.
How Often Should Social Media Statistics And Strategy Be Reviewed?
Review performance monthly and run a fuller strategic review each quarter. Platform algorithms and audience habits shift often enough that a plan left untouched for a year will drift out of date, and 2026 has already seen Instagram engagement fall around 17% year on year while TikTok held steady. Monthly checks catch tactical problems, such as a format that’s stopped working or a posting time that’s lost reach. Quarterly reviews are for bigger calls: dropping a platform, reallocating paid budget, or changing the content mix. Major pivots usually make sense every six to twelve months, with smaller adjustments happening continuously as the data comes in.
Do Social Media Statistics Differ Between Small Businesses And Large Companies?
Yes, and the difference is mostly about scale versus rate. Smaller accounts often post higher engagement rates because a smaller, more connected audience interacts more readily, and on TikTok especially, micro-accounts can see well over double the engagement of mega-brands. Larger companies benefit from brand recognition, which can lower their cost per click and lift total conversions even when the percentage rates look less impressive. Neither position is better in the abstract. A small business should lean into the engagement advantage with personal, responsive content and replies, while a larger one can afford broader paid-reach campaigns to compensate for diluted organic rates.
Are These Social Media Statistics Still Accurate?
Treat every benchmark in this guide as a range tied to a dated source, and check that date before you build a budget around it. The headline figures here come from DataReportal’s April 2026 mid-year update and 2026 benchmark reports from Socialinsider and Buffer, but engagement rates and platform demographics move year to year as algorithms change and audiences migrate. The safest practice is to use published statistics to frame a sensible starting expectation, then confirm against your own account data within the first month of any campaign. If a number can’t be traced to a credible, dated source, leave it out of your planning entirely.
How Much Should A Small Business Spend On Social Media Advertising?
There’s no fixed percentage that fits every business, but the platform you choose changes the maths more than the budget size does. With average CPMs around $8.50 and a spread from roughly $6.50 on TikTok to $33 on LinkedIn, the same spend buys very different volumes of attention depending on where it goes. The sensible approach is to start small on one platform that matches your audience, measure cost per lead rather than cost per impression, and scale only what converts. Because organic Facebook reach now sits around 2% to 5% of followers, some paid spend is usually necessary just to stay visible, but it should follow a tested organic foundation rather than replace it.