Production Possibilities Curve: Strategic Business Decision Guide
Table of Contents
Supported by government agencies, corporate sponsors, universities, and media partners, GEW creates vibrant ecosystems that nurture new ventures. For businesses, it offers an invaluable opportunity to engage with the community, gain exposure, and contribute to the entrepreneurial spirit. This guide will illustrate how your company can leverage Global Entrepreneurship Week through strategic event planning, promotion, and impact measurement.
Ready to start? Let’s hop into it.
What is a Production Possibilities Curve (PPC)?
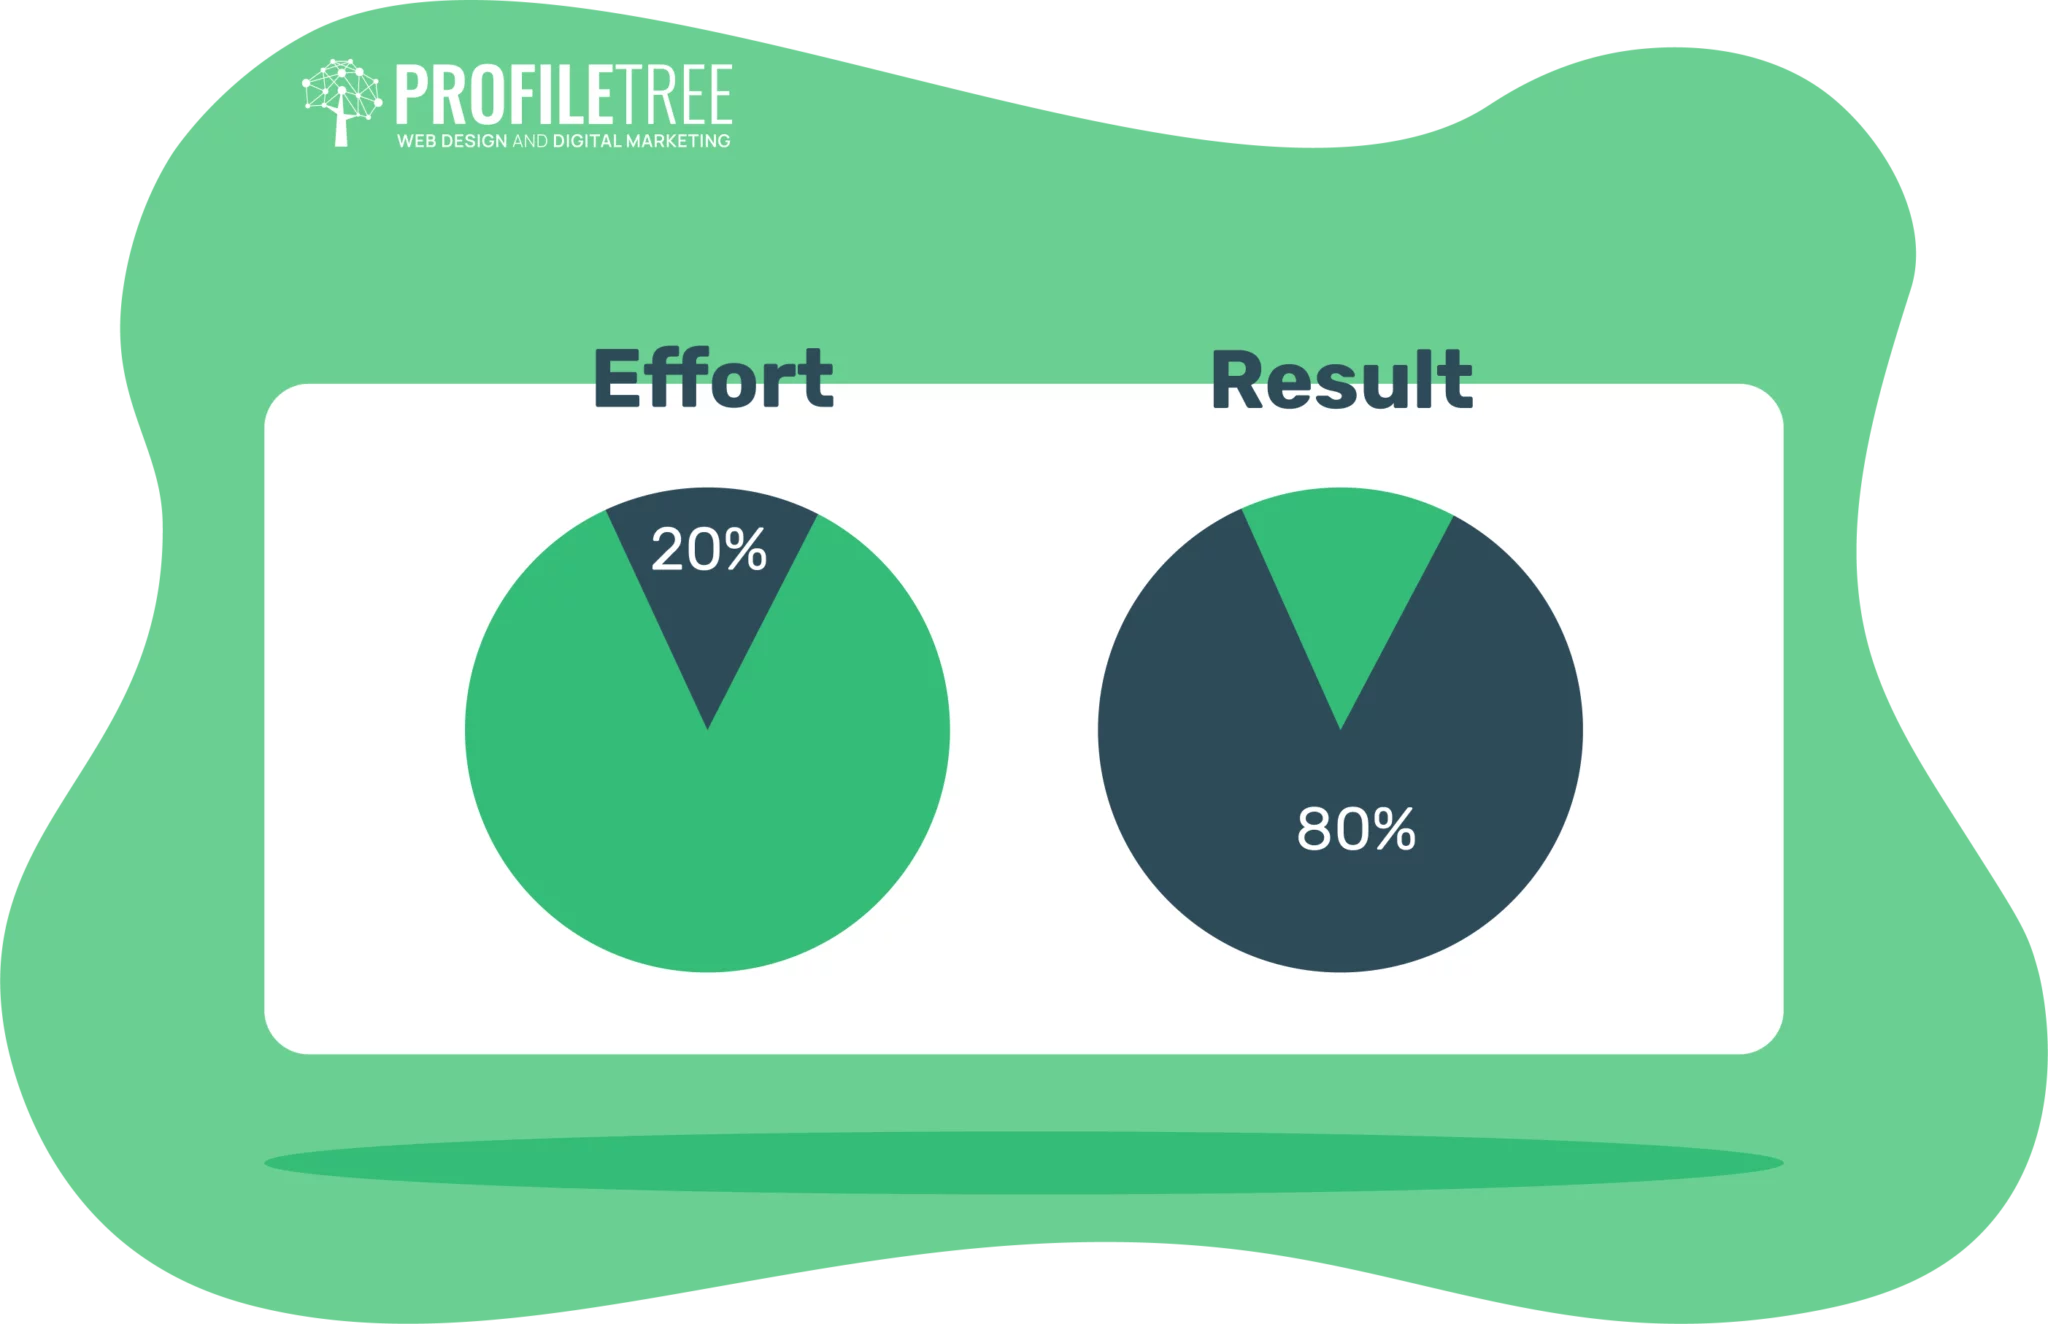
A Production Possibilities Curve (PPC) is a graphical representation that illustrates the maximum output possible of two products that share common resources in your operation. It allows your business to visualise the trade-offs between the production of different goods and identify efficiencies or inefficiencies in your operations.
The PPC highlights the maximum amount of output possible for both products, which you can then compare to your actual output to ensure that no inefficiencies are occurring. To fully understand the production possibilities curve, you must consider the opportunity cost.
Given the concept of scarcity, your business operates with limited resources that must be allocated wisely to create your outputs. When resources are dedicated to the production of one product, they must be diverted from another, demonstrating the inherent trade-offs involved in production decisions.
For instance, purchasing excessive materials while failing to convert them into sellable products leads to wasted money, which could have been better allocated elsewhere. This inefficiency can represent a significant loss for a growing company. It is important to know which of your products to prioritise over another one.
Now, let us identify how to construct a production possibilities curve:
- Each axis of the graph represents the quantity of one of the products being produced.
- A table detailing the supposed quantities that your operation can produce is sketched on the graph.
What are Production Resources?
Production resources encompass everything needed to create your products. This includes tangible resources such as raw materials, packaging, and any physical goods necessary for product creation.
However, the concept of resources also extends to intangible resources, which can be more complex to define. Intangible resources are those essential elements for product creation that cannot be physically held. These include:
- Time: The duration needed for production
- Money: Financial capital used for investment and operations
- Labour: The human workforce involved in production
- Production Capacity: The maximum output a facility can achieve
- Technology: Equipment and tools used in production
- Infrastructure: Logistics, transportation, and other support systems to bring your products to market.
For example, you might have all of the raw materials in the world but not enough machinery to combine them into a final product. Similarly, some products, like mobile apps or web development projects, don’t require raw materials; instead, they rely entirely on intangible resources.
What are Production Possibility Outputs?
Production possibility outputs refer to the quantity of products your business can create. This concept is straightforward when dealing with simple physical products.
However, for service-based businesses or digital products, defining outputs becomes more nuanced. In such cases, outputs may be measured by the number of clients or customers served or the total hours of labour available for a project. Outputs can also include research and development time or internal investments.
To illustrate the construction of the production possibilities curve, consider the following example: let’s assume that your business’s only resource is labour, with a maximum of six workers. The first step is to assign values to each of your resources and outputs. The maximum output possibilities for two products (A and B) might be as follows:
| Labour Allocated to Product A | Labour Allocated to Product B | Output of Product A | Output of Product B | |
| A | 6 | 0 | 12 | 0 |
| B | 5 | 1 | 10 | 2 |
| C | 4 | 2 | 8 | 4 |
| D | 3 | 3 | 6 | 6 |
| E | 2 | 4 | 4 | 8 |
| F | 1 | 5 | 2 | 10 |
| G | 0 | 6 | 0 | 12 |
For simplicity, if you allocate all your resources to one product, you will achieve maximum output for that product while generating no output for your other products.
Constructing a Production Possibilities Curve
To create a production possibilities curve, follow these steps:
Gathering Data
- Identify Goods: Choose two products or services that share common resources to compare—e.g. furniture and electronics production.
- Gather Data: Collect data on:
- Total available resources: capital, labour, technology, etc.
- Maximum production levels: Determine the current maximum output for each good based on the full utilisation of resources.
Plotting Points
- Plot the production quantity of one good on the X-axis
- Plot the production quantity of the other good on the Y-axis
- Mark the current production levels on the axes
- Draw a curve connecting the points to show the maximum output combinations and form a downward-sloping curve.
Explaining the Shape
- The curve’s downward slope shows the trade-off between the output of the two goods. To produce more of one, you must produce less of the other.
- The convex shape reflects the law of increasing opportunity cost. As you produce more of one good, the opportunity cost of producing additional units increases due to resource constraints.
- Points inside the curve indicate idle resources/inefficiency.
- Points on the curve represent the full utilisation of resources.
The production possibilities curve visually demonstrates the production possibilities frontier given current constraints. SMEs can use it to identify opportunities for growth, resource optimisation, and improved efficiency.
Using Graphing Calculators for PPC Analysis
Graphing calculators have become essential tools for constructing and analysing production possibilities curves in both academic and business settings. These powerful devices allow for quick visualisation of complex economic relationships without requiring advanced software knowledge.
Benefits for Business Analysis:
- Immediate Visualisation: Modern graphing calculators can instantly transform tabular data into visual PPC representations, allowing business managers to see efficiency gaps at a glance.
- Scenario Testing: Users can quickly modify variables to see how changes in resource availability or production efficiency might shift the curve, facilitating strategic planning.
- Slope Calculation: Graphing calculators can precisely calculate the slope at any point along the curve, providing exact opportunity cost figures for incremental production changes.
- Data Integration: Many business-oriented graphing calculators allow direct importing of production data from spreadsheets or business intelligence systems, streamlining the analysis process.
Recommended Models for Business Use:
Business analysts often favour the Texas Instruments TI-84 Plus CE for its intuitive interface, while the Casio fx-CG50 offers enhanced graphing capabilities particularly suited to economic modelling. For companies requiring advanced features, the HP Prime provides programming capabilities that allow for customised PPC analysis applications.
When selecting a graphing calculator for business applications, prioritise models with data import capabilities, sufficient memory for complex datasets, and the ability to export visualisations for inclusion in reports.
With these tools, even small businesses can implement sophistic
Implementing PPC Analysis in Your Business: A Practical Guide
Follow these steps to apply production possibilities curve analysis to your own business operations:
- Identify Critical Resources: Determine which resources are most constrained in your business (labour hours, equipment time, capital, etc.).
- Select Two Key Outputs: Choose two important products or services that compete for the same resources.
- Measure Current Allocation: Document how your resources are currently divided between these outputs.
- Calculate Maximum Potential: Using graphing calculators or spreadsheet software, determine the maximum possible production of each output if all resources were dedicated to it alone.
- Plot Your Curve: Create a visual representation of all possible efficient combinations.
- Locate Your Current Position: Plot your actual production levels to see if you’re operating efficiently (on the curve) or inefficiently (inside the curve).
- Analyse Opportunity Costs: Calculate what you’re giving up of one output to produce more of the other.
- Identify Improvement Strategies: Determine if you need to:
- Reallocate existing resources (move along the curve)
- Increase resource efficiency (move from inside to on the curve)
- Expand capacity through investment (shift the curve outward)
- Implement and Monitor: Make resource allocation adjustments and track results over time.
This methodical approach transforms PPC from an abstract economic concept into a practical business intelligence tool.
The Pareto Efficiency Principle
The Pareto Efficiency Principle, named after the Italian economist Vilfredo Pareto, states that any point below the production possibilities curve is inefficient, as it signifies that you are not utilising your resources to their full potential.
Conversely, points above the curve are impossible to achieve, as they represent a resource usage that exceeds what your business actually has. If your data shows points above the curve, there may be an error in your reporting, such as miscalculated resources or overlooked product loss.
Points below the curve indicate inefficiency, which requires immediate attention. Inefficiency results in a direct loss of profits and hampers business growth.
So, how can this be addressed? The solution is often to shift the curve to the left or right.
Shift to the Right
A shift to the right signifies an increase in your business’s output capacity. This could be due to the introduction of new technology, additional machinery, or improved processes that allow for greater production.
A shift to the right is always positive, as it indicates that your company’s production line is growing. In simple terms, it results from increased output.
Shift to the Left
A shift to the left indicates a decrease in your business’s output capacity. This could be the result of losing resources, such as equipment or labour. It is generally seen as a decline in production capability.
In some cases, a shift to the left could be intentional, such as when a company limits its product availability ahead of a new product launch.
PPC and Economics

The production possibility curve is not only important for managing internal business operations but also provides valuable insights into the broader economy of a market.
For example, if you’re responsible for sales for a car brand in a specific country, you can use the PPC to assess the market’s economic health. By plotting the quantity of a basic product (such as economy cars) on the X-axis and the quantity of a luxury product (such as high-end cars) on the Y-axis, the point where they intersect on the graph represents the current state of the market.
This information is essential for your business, as it helps determine which products to prioritise based on consumer demand. If the point is closer to the X-axis, it suggests a shift towards luxury products, indicating that the market is flourishing, with consumers willing to spend more. In contrast, if the point is nearer to the Y-axis, it signals higher demand for basic products, suggesting that the economy is struggling, and consumers are focused on essentials due to reduced buying power.
Understanding these shifts allows businesses to adjust their production strategies to align with market conditions, optimising for both short-term survival and long-term growth.
Production Possibilities Curves in Digital Business
The PPC model is particularly valuable for digital businesses where resources often consist primarily of developer time, server capacity, and creative talent rather than physical materials:
Software Development: Digital product teams must constantly balance developer hours between:
- New feature development vs bug fixes and maintenance
- Mobile app improvements vs web platform enhancements
- Customer-facing features vs back-end infrastructure
Digital Marketing Agencies: Marketing firms apply PPC concepts when allocating creative and technical resources between:
- Content creation vs distribution activities
- Client acquisition vs servicing existing accounts
- Different client projects competing for the same specialist talent
E-commerce Operations: Online retailers use PPCs to visualise trade-offs between:
- Website performance optimisation vs new functionality
- Customer service capacity vs warehouse operations
- Product range expansion vs inventory depth
For digital businesses, the PPC provides a framework for visualising opportunity costs
Applications of the PPC for Business Decision-Making
The production possibilities curve offers valuable insights for businesses in various areas:
Analysing Expansion Potential
- The PPC illustrates maximum production levels based on current resource constraints.
- An outward shift of the curve signals the potential for expanding the output through additional resources.
- Businesses can weigh the costs of acquiring more capital, labour, or technology against the potential benefits of increased production.
Assessing Technology Improvements
- The adoption of new technologies can boost productivity and shift the curve outward.
- Evaluating the return on investment (ROI) from technology upgrades helps determine whether increased output capacity is worth the investment.
Planning Production Mix
- The PPC visually represents the trade-offs between producing different goods, helping businesses plan optimal production combinations.
- It supports aligning production output with customer demand, ensuring a balanced and efficient approach.
By using the PPC, SMEs can gain a clearer understanding of their current production capabilities, identify opportunities for growth, and make informed decisions about resource allocation and product mix.
Real-World Applications of Production Possibilities Curves
To better understand how the PPC model works in practice, let’s examine how several UK businesses have leveraged this economic concept:
Brewdog Brewery: The Scottish craft beer company regularly uses production possibilities analysis to balance resources between their core beer lines and seasonal speciality brews. During peak summer months, they shift production capacity toward seasonal offerings while maintaining minimum viable output of their flagship products.
Dyson: When transitioning from traditional vacuum cleaners to their revolutionary bagless technology, Dyson used PPC analysis to determine how to allocate factory resources during the transition period. This allowed them to maintain revenue from existing products while scaling up production of new technology.
Marks & Spencer: During their sustainability transformation, M&S applied PPC principles to balance conventional product manufacturing against their “Plan A” eco-friendly alternatives, gradually shifting their curve as consumer demand and production efficiency for sustainable products improved.
Limitations of Using The PPC Model

While the production possibilities curve is a valuable tool, it has certain limitations:
Static Model
- The standard PPC is a static model, providing only a snapshot of production possibilities at a specific point in time.
- It does not account for dynamic changes or developments over time, such as evolving market conditions or technological advancements.
- The model fails to capture fluctuations in resource availability or shifts in productivity.
Assumption of Fixed Resources
- The production possibilities curve assumes that land, labour, and capital remain fixed in the short run, which may not be realistic in practice.
- Resource constraints can change, affecting a business’s actual production possibilities.
Efficiency Assumption
- The production possibilities curve assumes full efficiency, meaning all resources are optimally utilised. This may not always be achieved in the real world.
- In reality, inefficiencies reduce actual output, making it difficult to reach the maximum potential indicated by the curve.
Quantitative Insights
- While the model provides a theoretical visualisation of production trade-offs, it does not quantify key factors such as costs, revenues, or profits.
- As a result, business leaders should complement the production possibilities curve with quantitative financial modelling to make informed decisions.
While the PPC is a valuable tool for understanding production possibilities and trade-offs, it is essential to be aware of its limitations and use it in conjunction with other analytical tools to make informed business decisions.
Real-world Examples of the PPC
The production possibilities curve can be applied across various industries to guide decision-making regarding resource allocation, production optimisation, and strategic planning. Below are a few real-world examples of how businesses use the PPC:
Manufacturing Industry: Balancing Product Lines
A car manufacturing company might use the PPC to determine the trade-off between producing economy cars and luxury vehicles. By plotting economy cars on the X-axis and luxury cars on the Y-axis, the company can see how shifting resources impacts the production of each.
If consumer demand increases for luxury vehicles, the company might allocate more resources to their production, pushing the PPC outward as new technology (like automation) is introduced. Conversely, economic downturns may require scaling back luxury car production and focusing on economic models.
Agriculture: Crop Production Decisions
Farmers often use the PPC to balance the production of two crops, such as corn and wheat. Given limited land, water, and other resources, the PPC helps illustrate how increasing the production of one crop reduces the amount of the other that can be produced.
For example, if there is a drought, the PPC will shift left, showing a reduction in overall output. If new irrigation technology is implemented, the curve shifts right, indicating higher potential yields.
Healthcare: Resource Allocation in Hospitals
Hospitals face constant trade-offs between different services, such as emergency care and elective surgeries. A hospital’s PPC might plot emergency care services on one axis and elective surgeries on the other.
The curve helps administrators decide where to allocate resources like staff, equipment, and funding, especially during times of crisis, such as a pandemic. When new medical technologies or staff are acquired, the PPC shifts outward, indicating an expanded capacity for both services.
Tech Startups: Product Development
For a tech startup developing mobile apps and software tools, the PPC can be used to allocate engineering and design resources. Suppose the startup is deciding how many mobile apps (plotted on the X-axis) and enterprise software solutions (plotted on the Y-axis) it can produce.
The PPC helps the business determine the optimal combination based on available resources such as labour, capital, and time. If the company hires more developers, the curve shifts outward, allowing for more balanced or increased production.
Retail: Inventory Management
Retail businesses can use the PPC to decide how to allocate resources between high-margin products (like luxury goods) and lower-margin, high-turnover products (like essentials).
For example, a clothing retailer might plot high-end designer wear on one axis and budget-friendly basics on the other. By doing so, they can assess which product line should receive more attention depending on market demand. If demand for basics rises due to economic conditions, the business might prioritise the production of lower-cost items to maximise profit.
Government Policy: Economic Planning and Resource Allocation
Governments can apply the PPC to analyse trade-offs between different national priorities, such as balancing economic growth with environmental protection. For example, by plotting industrial development on one axis and environmental sustainability on the other, policymakers can visualise the opportunity costs of prioritising one goal over the other.
Similarly, the PPC helps governments make efficient decisions about resource allocation to meet citizens’ needs, such as deciding how to allocate budgets between education and healthcare. By understanding these trade-offs, governments can develop more balanced and informed policies that address both immediate and long-term societal goals.
These are just a few examples of how the PPC can be applied in various industries. By understanding the trade-offs involved in production and resource allocation, businesses can make more informed decisions and improve their overall efficiency.
Applying PPC Analysis to Contemporary Business Challenges
Today’s businesses face unique economic pressures that the PPC model can help navigate:
Supply Chain Resilience Recent global disruptions have highlighted supply chain vulnerabilities. Modern PPC analysis often incorporates secondary curves showing production possibilities under different supply scenarios, helping businesses visualise contingency options.
Hybrid Workforce Management With workforces split between remote and on-site operations, companies are using PPCs to optimise resource allocation across distributed teams. This may involve plotting separate curves for on-site and remote production capabilities.
Sustainability vs Profitability Businesses increasingly use modified PPC models that incorporate carbon footprint or sustainability metrics as a third dimension, allowing them to visualise the environmental trade-offs of different production choices.
Economic Uncertainty In volatile markets, companies develop multiple PPCs representing different economic scenarios, allowing them to quickly pivot production priorities as conditions change.
The enduring value of the PPC model lies in its adaptability to new business challenges, providing a framework for visualising trade-offs regardless of the specific constraints faced.
Production Possibility Curves in Short
The production possibilities curve is a powerful graphical tool that illustrates the theoretical maximum output of two competing products. It helps your business determine the ideal balance between these products, optimising resource allocation.
By plotting your actual output as a point on the curve, you can assess your business’s current efficiency. Additionally, the PPC provides insight into market conditions; for example, comparing luxury and essential goods can reveal how well the market is performing.
While the PPC is just one of many analytical tools available, it is particularly useful when combined with effective budgeting strategies and project management techniques to maximise productivity and efficiency.
Industry-Specific Applications of the PPC Model
The production possibilities curve has unique applications across different sectors:
Manufacturing In manufacturing, PPCs typically model the trade-off between different product lines sharing the same equipment and labour. Changeover time becomes a critical factor, with setup costs creating more pronounced curves.
Service Industries Service businesses apply PPC concepts to staff allocation. A consultancy might balance billable client work against business development, with consultant hours as the primary constraint.
Retail Retailers use PPCs to optimise floor space allocation between different product categories, with shelf space and prime positioning representing the finite resources.
Healthcare NHS facilities often use PPC-based analysis to balance resources between preventative care and acute treatment services, with specialist time and facility space as key constraints.
Each industry must identify its unique constraints and outputs to effectively apply the PPC model to operational decision-making.
Conclusion
Despite its inherent simplifications, the production possibilities curve (PPC) remains a valuable economic model for SMEs. It helps visualise trade-offs, identify growth opportunities, and optimise resource allocation.
By using the PPC as a complement to strategic decision-making—while being mindful of its limitations—small businesses can better maximise their resources. Its ability to visualise current constraints and potential for expansion makes the PPC an essential addition to any SME’s planning toolkit.
FAQs
Do you have questions about the PPC and its applications? This section provides answers to common inquiries to help you better understand and utilise this valuable economic tool.
1. What are the main limitations of the production possibilities curve?
Key limitations include its static nature, fixed resource assumptions, and lack of quantitative insights regarding costs and revenues.
2. What data do I need to construct a basic PPC?
You need to identify two goods or services to compare, determine the current maximum production levels for each, and understand your resource constraints.
3. How does technology shift the PPC outward?
Improved technology increases output with the same resources. Investments in technology can shift the curve outward, creating opportunities for expansion.
4. Can the PPC help plan which goods a business should produce?
Yes, the PPC shows trade-offs between producing different goods, helping businesses plan an optimal production mix based on market demand.
What are the main limitations of the production possibilities curve?
Key limitations include its static snapshot view, fixed resource assumptions, and lack of quantitative insights on costs and revenues. The model also simplifies complex production relationships and assumes perfect efficiency.
What data do I need to construct a basic PPC?
You need to identify two goods/services to compare, determine current maximum production levels for each, and understand your resource constraints. Spreadsheets or graphing calculators can help plot the data points.
How does technology shift the PPC outward?
Improved technology allows increased output with the same resources. Investments in automation, AI, or process improvements can shift the curve outward and provide expansion opportunities without additional resource inputs.
Can the PPC help plan which goods a business should produce?
Yes, the curve shows trade-offs between outputs to help plan an optimal production mix matched to demand. By incorporating profit margins for each product, you can identify the most profitable point on the curve.
How often should a business reassess its PPC position?
Reassessment frequency depends on your industry’s volatility. Quarterly analysis works for most businesses, while companies in rapidly changing markets might benefit from monthly reviews. Significant changes in resources, technology, or market conditions should trigger immediate reassessment.
What tools can help businesses calculate and visualise their PPC?
Beyond basic spreadsheet software, specialised business intelligence tools with scenario modeling capabilities are ideal. For educational purposes, graphing calculators provide a simple way to illustrate PPC concepts with actual data.
How does outsourcing affect a company’s PPC?
Outsourcing effectively shifts the PPC outward for the specific outputs being outsourced, as it removes internal resource constraints. However, it introduces new considerations like quality control, communication costs, and dependency risks that should be factored into the model.
How can small businesses with limited data implement PPC analysis?
Small businesses can start with simplified PPCs using estimated production capacity for their two most important products or services. Even rough estimates provide valuable insights into resource allocation efficiency.