Marketing Statistical Analysis: Revealing Key Insights for Success
Table of Contents
Marketing statistical analysis is the process of applying mathematical and statistical methods to marketing data to understand what is happening in your business, why it is happening, and what is likely to happen next. For business owners and marketing managers, it is the difference between making decisions based on evidence and on assumptions.
This guide explains the core statistical techniques used in marketing, how each one applies to real business decisions, and how to choose the right approach for the question you are trying to answer.
What is Marketing Statistical Analysis and Why Does It Matter for SMEs?
Most business owners are familiar with marketing data — website traffic, conversion rates, campaign costs. What statistical analysis adds is a tested framework for determining whether the patterns in that data are real and reliable enough to act on. For SMEs in particular, where budgets are finite, and the cost of a wrong decision is felt directly, this distinction matters.
The basic definition
Marketing statistical analysis is the systematic use of statistical methods to analyse marketing data and extract reliable insights. Rather than looking at raw numbers and drawing intuitive conclusions, statistical analysis applies tested mathematical frameworks to determine whether patterns are real, whether relationships between variables are meaningful, and whether results are significant enough to act on.
The keyword is reliable. Any business can look at last month’s sales figures and notice that revenue was up. Statistical analysis tells you whether that increase was driven by a specific campaign, a seasonal pattern, or random variation — and whether it is likely to repeat.
Why this matters for smaller businesses
Larger organisations have had access to data teams and statistical modelling for decades. That gap has narrowed considerably. Tools like Google Analytics 4, Meta Ads Manager, and standard spreadsheet software now surface statistical patterns that previously required a specialist resource to find.
The challenge for most SMEs is not a lack of data — it is knowing which questions to ask of it and which methods give trustworthy answers. A business running Google Ads, managing a website, and sending email campaigns is generating enough data to run meaningful statistical analysis. The question is whether that data is being used properly or just reported as headline figures.
ProfileTree’s digital marketing work for clients across Northern Ireland, Ireland, and the UK consistently starts from this point: not “what do your numbers look like?” but “what do your numbers actually mean?
The Role of Statistics in Managerial Decision-Making
Understanding the role of statistical techniques in management decision-making is not an academic exercise. Every time a marketing manager decides to scale a campaign, change a price, or redesign a page based on what the data appears to show, they are making a statistical judgement — whether they frame it that way or not. The question is whether that judgment is supported by a reliable method or by an impression.
Moving beyond gut feeling
Statistics in managerial decision-making serve one primary function: they replace subjective judgment with tested evidence wherever possible. This does not mean removing human insight from decisions — it means anchoring those decisions in data that can be examined, challenged, and improved.
Consider a straightforward example. A retail business in Belfast notices that enquiries from its website increased in October. The manager’s instinct is that a new product page launched that month drove the change. Statistical analysis can test whether the increase in enquiries correlates with that specific page’s traffic, whether the timing matches, and whether the relationship holds when other variables are controlled for. Without that analysis, the business risks investing more in something that may not have been the actual cause.
The role of statistical techniques in management decision-making
Statistical methods support three broad types of managerial decisions.
Diagnostic decisions — understanding what has already happened and why. Descriptive statistics, regression analysis, and cluster analysis fall here. They answer questions like: which customer segments are most valuable, what drove last quarter’s drop in conversion rate, and where the budget is being wasted.
Predictive decisions — forecasting what is likely to happen and planning accordingly. Time series analysis and regression modelling support this. They help businesses anticipate demand, plan stock levels, and schedule campaigns around periods of highest buyer intent.
Experimental decisions — testing whether a proposed change will actually work before fully committing. A/B testing and hypothesis testing serve this function. They answer whether a new landing page, email subject line, or pricing structure genuinely performs better or whether any apparent difference is within normal statistical noise.
How statistics help in managerial decision-making: the practical application
The application of statistics in managerial decision-making does not require a data science degree. What it requires is clarity about the business question being asked, a large enough data set to draw reliable conclusions, and the right method for the question at hand.
For most SMEs, the entry point is more modest than full statistical modelling. Reviewing whether a campaign’s conversion rate is genuinely different from the previous month’s, segmenting customers by purchase frequency, or identifying which traffic sources produce the highest-value visitors are all forms of applied statistical thinking. The method scales with the complexity of the question.
Four Core Statistical Techniques and What They Tell You
The techniques used in marketing statistical analysis range from straightforward descriptive summaries to more complex predictive models. What they share is a common purpose: turning raw data into a basis for decisions that can be defended and repeated. The table below maps the most commonly used methods to their marketing applications, which are then explained in more detail.
| Technique | What it does | Marketing application | Typical tools |
|---|---|---|---|
| Regression analysis | Measures the relationship between variables | Predicting sales, evaluating campaign impact | Excel, Google Sheets, R |
| Cluster analysis | Groups data points by similarity | Customer segmentation, audience profiling | CRM platforms, Python |
| Time series analysis | Identifies patterns across time | Demand forecasting, seasonality planning | GA4, Excel |
| Hypothesis testing (A/B) | Tests whether a difference is statistically significant | Landing page testing, email subject lines | VWO, Google Optimize alternatives |
Regression analysis
Regression analysis examines how changes in one variable are associated with changes in another. In marketing, the most common use is identifying which factors most strongly predict a commercial outcome — sales, enquiries, or sign-ups.
A practical application: an e-commerce business wants to understand which combination of ad spend, email frequency, and website traffic predicts monthly revenue most accurately. Regression modelling builds an equation from historical data that weights each factor by its actual influence. The output tells the marketing manager where to concentrate resources to increase the revenue.
Regression does not establish that one variable causes another to change — correlation and causation remain distinct. What it does provide is a statistically grounded basis for prioritising effort, rather than allocating budget based on assumptions.
Cluster analysis
Cluster analysis sorts customers or data points into groups based on shared characteristics, without specifying in advance what those groups should look like. The algorithm identifies natural groupings in the data.
The value for marketing is audience segmentation that goes beyond simple demographic categories. A business might find that its customers cluster not by age or location but by purchasing frequency combined with average order value — producing groups like “high-value occasional buyers” and “low-value frequent buyers” that require entirely different retention strategies.
ProfileTree uses audience segmentation as a foundation for digital marketing strategy. When planning paid search or social campaigns, targeting becomes substantially more precise when it is built on data-derived segments rather than assumed profiles.
Time series analysis
Time series analysis examines data collected over sequential time periods to identify trends, cycles, and seasonal patterns. For a marketing manager, it answers questions like: when does demand for our product peak, how long does a campaign’s effect last, and is the decline in traffic we are seeing part of a normal seasonal pattern or something that needs to be addressed?
The role of statistics in managerial decision-making is primarily predictive in this context. A business that understands its seasonal demand curve can plan campaigns, stock levels, and team capacity around evidence rather than last year’s recollection.
In website terms, understanding traffic seasonality shapes when to publish new content, when to invest in paid promotion, and when organic search is likely to be more competitive. This is a routine part of how ProfileTree structures content calendars and SEO strategy for clients with clear seasonal patterns.
Hypothesis testing and A/B testing
Hypothesis testing is the statistical framework that tells you whether a result is meaningful or whether it could have occurred by chance. A/B testing — comparing two versions of a marketing element — is its most direct application in digital marketing.
The practical process works as follows. You define a hypothesis: “Version B of this landing page will generate more enquiries than Version A.” You run both versions simultaneously to equivalent audiences. After collecting enough responses to achieve statistical significance, you apply a significance test — typically a chi-square test for conversion rates or a t-test for continuous measures — to determine whether the difference between the two versions is real or within normal random variation.
The common mistake SMEs make with A/B testing is calling a winner too early. A result that looks dramatically different after 50 visits may be entirely within expected random variation. Statistical significance — typically set at a 95% confidence level — requires a sufficient sample size before any conclusion is reliable. This is where understanding the statistical basis of managerial decision-making protects businesses from acting on noise rather than signal.
How to Apply Marketing Statistical Analysis: A Practical Framework
Knowing what the techniques are is one thing. Knowing how to actually apply them to a business decision is where most SMEs stall. The five steps below provide a working framework — not a specialist data science process, but a structured approach that any marketing manager can follow to get reliable answers from their data.
Step 1: Define a specific, testable question
Statistical analysis requires a precise question. How is our marketing performing?” is not a question statistical analysis can answer usefully. “Did the change we made to our enquiry form in January increase submission rates compared with December?” is.
Before collecting or analysing data, write down the specific decision the analysis needs to support. This shapes what data you need, what method is appropriate, and what result would change your course of action.
Step 2: Collect compliant, relevant data
In the UK, data collection for marketing purposes is governed by UK GDPR and the Privacy and Electronic Communications Regulations (PECR). Statistical analysis built on non-compliant data creates both legal exposure and analytical problems — data gathered without proper consent is likely to be unrepresentative.
The practical requirements for most SMEs: ensure analytics tracking is consent-based, that personal data used in segmentation or modelling is handled in accordance with your privacy policy, and that any customer data used for statistical purposes is collected with an appropriate lawful basis documented.
Data minimisation — collecting only what you actually need — is both a GDPR principle and good analytical practice. Unnecessarily broad datasets introduce noise, making statistical patterns harder to identify.
Step 3: Choose the right method for the question
The table below provides a starting framework. The choice of statistical method depends on the type of data you have and the type of question you are answering.
| Your question | Data type | Method to use |
|---|---|---|
| Are two groups different from each other? | Categorical | Chi-square test |
| Does one variable predict another? | Continuous | Regression analysis |
| What natural groups exist in my data? | Mixed | Cluster analysis |
| Is a trend real or seasonal noise? | Time-ordered | Time series analysis |
| Did this change actually work? | Conversion rate | A/B test with significance test |
Step 4: Interpret results in commercial terms
A p-value below 0.05 means the result has a less than 5% probability of occurring by chance — it is statistically significant. What it does not tell you is whether the effect is commercially meaningful. A landing page test might show a statistically significant improvement in conversion rate of 0.3 percentage points. Whether that is worth acting on depends on your traffic volume and the revenue per conversion.
Statistical significance and practical significance are separate judgments. The analysis tells you whether the result is real; the commercial context tells you whether it matters enough to act on.
Step 5: Build analysis into regular decision-making
One-off statistical exercises have limited value. The businesses that apply statistics most effectively to managerial decision-making build it into recurring processes — monthly performance reviews that test whether changes produced statistically meaningful results, segmentation reviews that update audience profiles as purchasing patterns shift, and campaign planning that uses historical time-series data to inform timing and budget allocation.
ProfileTree’s approach to digital training covers this kind of data literacy for SME teams — building in-house capability to ask better questions of marketing data rather than relying entirely on external reporting.
Marketing Analytics Versus Marketing Statistics: What is the Difference?
This is one of the most common points of confusion in marketing, and it matters practically because the two disciplines require different tools, different skills, and different questions. Treating them as interchangeable leads businesses to over-invest in reporting dashboards and under-invest in the methods that actually explain what the dashboards are showing.
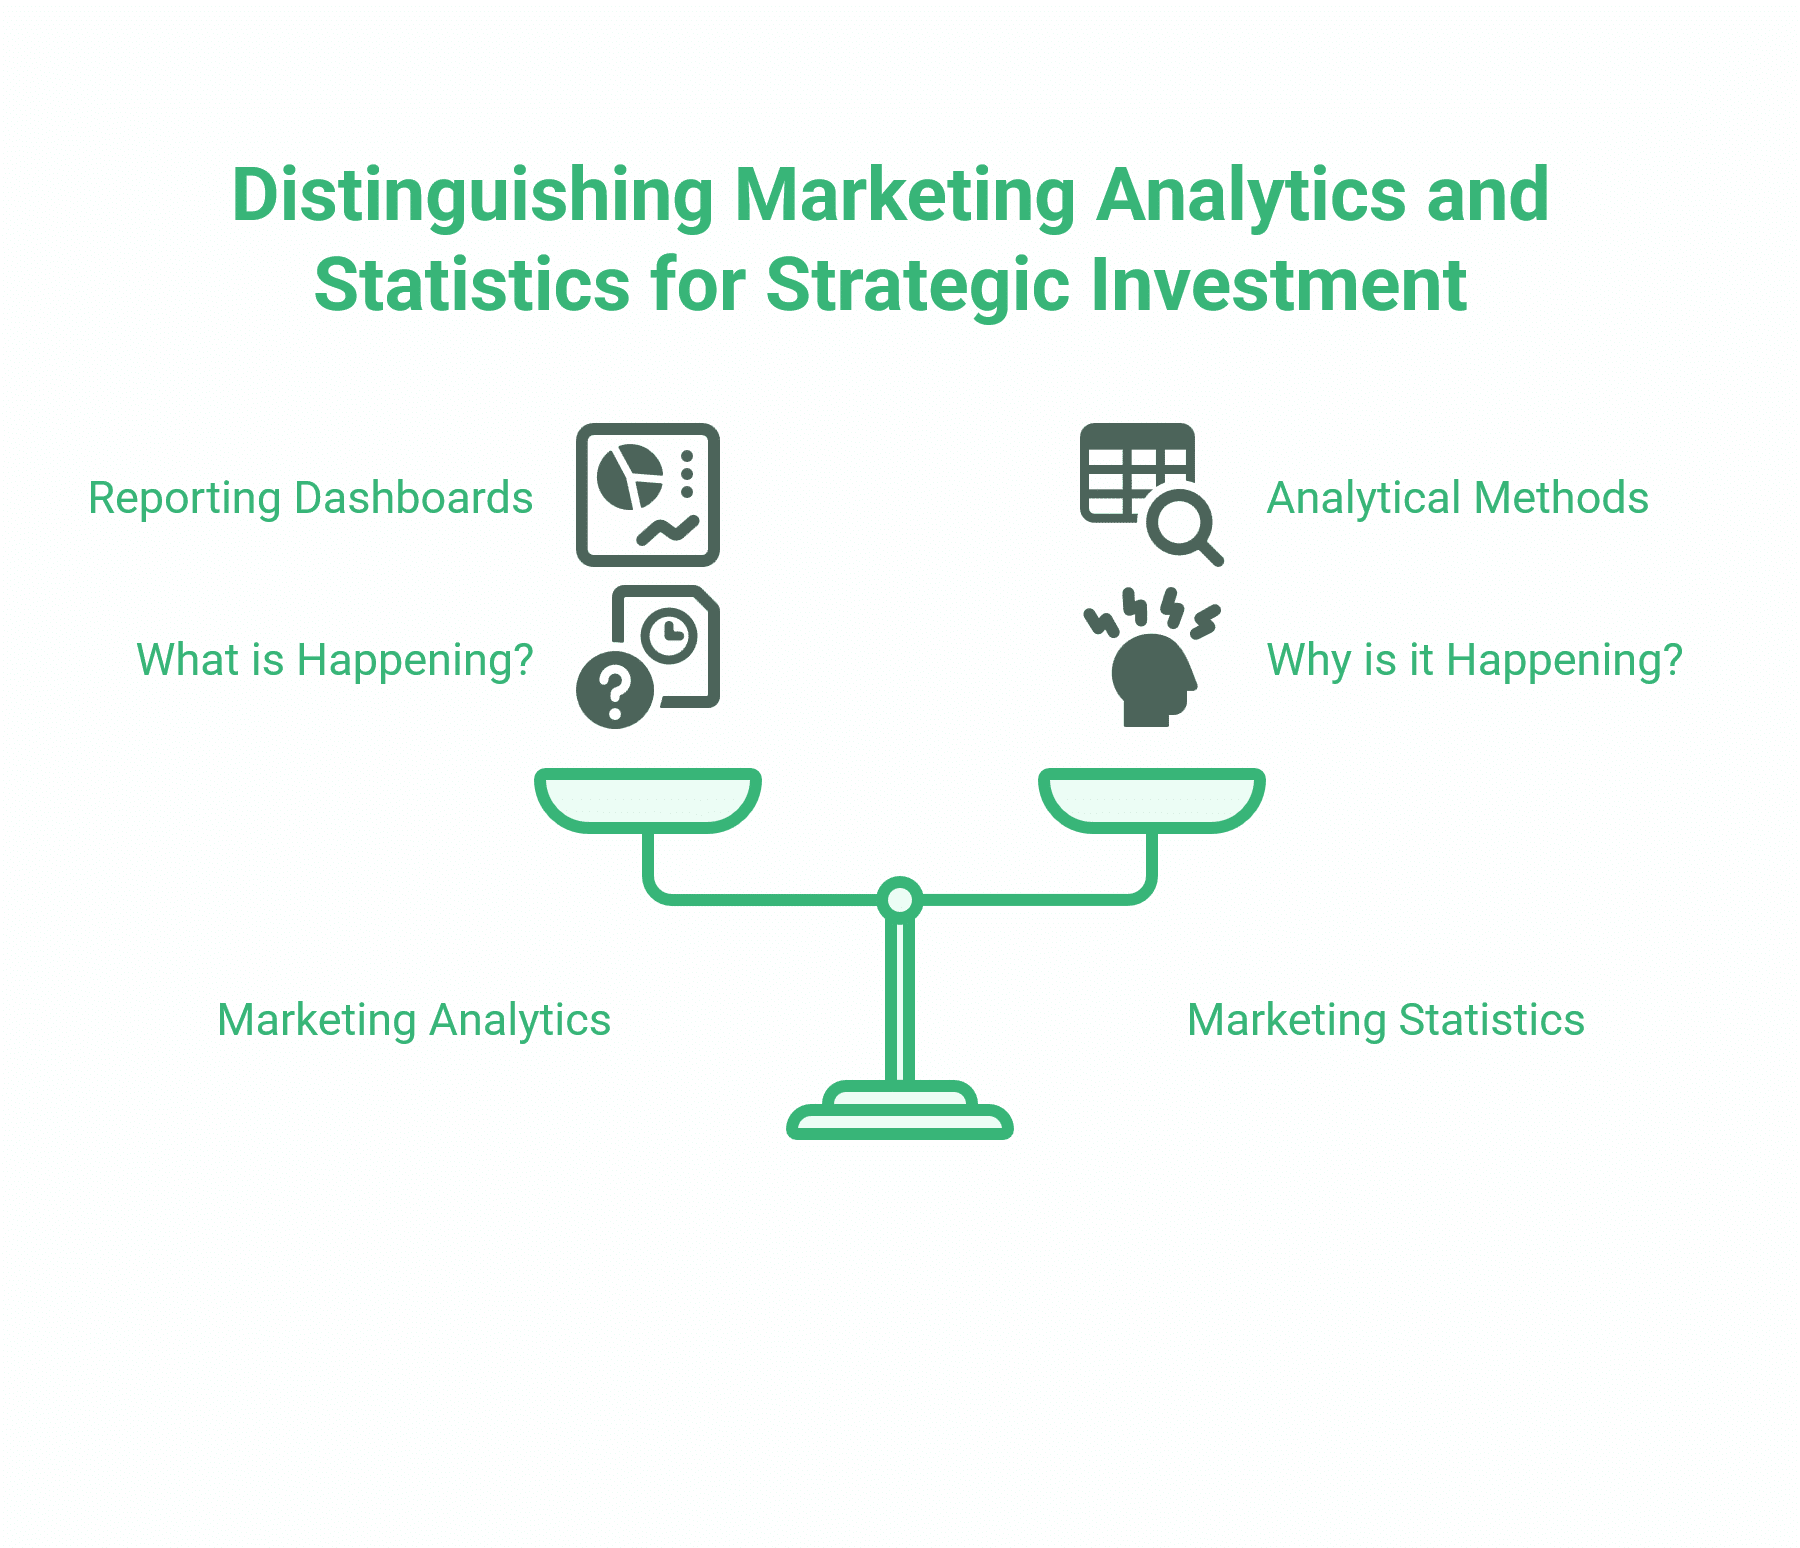
What marketing analytics does
Marketing analytics is descriptive. It tells you what happened. How many people visited the website this month, which pages they viewed, where they came from, and how many converted. Google Analytics 4, social media dashboards, and CRM reports are all analytics tools. They are valuable, but they report outcomes rather than explaining them.
What marketing statistics does
Marketing statistics is explanatory and predictive. It tells you why something happened and whether it is likely to happen again. It requires applying a mathematical framework to the data that analytics surfaces — asking whether patterns are real, whether relationships are meaningful, and whether results can be relied upon to make decisions.
Why the distinction matters for SMEs
Most SMEs are well served by their analytics tools, but make limited use of statistical methods. The gap matters most when decisions involve significant resource allocation — scaling ad spend, redesigning a website, restructuring a pricing model — where acting on a pattern that turns out to be random variation is costly.
Analytics tells you that the conversion rate dropped last month. Statistical analysis tells you whether that drop is statistically significant, whether it is correlated with a specific change, and what confidence level you can attach to any conclusion about cause. One without the other gives you numbers without meaning.
Applying Statistical Thinking to Your Marketing
Most SME marketing decisions are made on incomplete evidence. Statistical analysis does not require a data science team or specialist software — it requires asking precise questions, collecting relevant data, and applying the right method to get a reliable answer rather than a plausible-looking one.
ProfileTree’s digital marketing and AI implementation services are built around this principle: decisions should be grounded in tested data, not just reported data. If your business is ready to move from marketing reporting to marketing analysis, we can help.
FAQs
What is marketing statistical analysis?
Marketing statistical analysis is the application of statistical methods to marketing data to identify patterns, test relationships between variables, and support evidence-based decisions. It covers techniques including regression analysis, cluster analysis, A/B testing, and time series forecasting.
What is the role of statistics in managerial decision-making?
Statistics in managerial decision-making provides a tested framework for determining whether observed patterns are real, whether relationships between variables are meaningful, and whether proposed changes are likely to produce genuine results. It replaces judgment based on assumption with decisions grounded in data that can be examined and challenged.
How do statistics help in managerial decision-making?
Statistics helps managers test hypotheses before committing resources, identify which variables most strongly predict commercial outcomes, segment customers by genuine behavioural patterns, and forecast future demand based on historical trends. It reduces the risk of acting on random variation or misleading averages.
What are the main types of statistical analysis used in marketing?
The most commonly used methods are regression analysis (predicting outcomes and measuring variable relationships), cluster analysis (customer segmentation), time series analysis (trend and seasonality identification), and hypothesis testing, including A/B testing (determining whether observed differences are statistically significant).