Business Management Statistics for Informed Decision-Making
Table of Contents
Most small and medium-sized businesses are sitting on more data than they know what to do with. Website traffic, sales figures, customer enquiries, staff turnover, ad spend — the numbers accumulate, but without a clear framework for reading them, they stay numbers. Business management statistics give you that framework.
This guide covers the core statistical methods that matter for SME decision-making: how to read consumer behaviour, make sense of financial performance, measure marketing effectiveness, and use data to manage operations and people more confidently. Where relevant, it covers practical tools and approaches that put these methods within reach for businesses without an in-house data team.
What Business Management Statistics Actually Cover
Business management statistics is the application of data analysis methods to real business decisions. It’s not a single tool — it’s a set of techniques, each suited to a different type of question.
The core methods break down across five business functions:
| Business Function | Statistical Approach | What It Helps You Decide |
|---|---|---|
| Marketing | Descriptive stats, A/B testing, attribution | Which channels and campaigns drive results |
| Finance | Stock levels, supplier performance, and capacity | Cash flow health, profitability, risk |
| Operations | Demand forecasting, quality control, process analysis | Stock levels, supplier performance, capacity |
| HR | Workforce analytics, predictive modelling | Hiring needs, retention risk, training ROI |
| Strategy | Regression analysis, trend analysis, segmentation | Pricing, market entry, resource allocation |
The statistics aren’t the goal. The goal is better decisions. Statistics is the method for getting there without relying solely on instinct. For a broader look at how these methods connect, the role of business statistics in commercial decision-making is worth reading alongside this guide.
Understanding Consumer Behaviour Through Descriptive Statistics
The starting point for most business management statistics work is understanding what your customers actually do, not what you assume they do. Descriptive statistics give you the tools to summarise and interpret customer data clearly.
What Descriptive Statistics Tells You
Descriptive statistics summarise a dataset without making predictions. The core measures are mean, median, mode, range, and standard deviation. Applied to customer data, they answer questions like: what’s the average order value? How many customers come back within 90 days? What’s the spread of purchase frequencies across your customer base?
For an SME with a straightforward customer database or a connected e-commerce store, these measures are available without specialist software. Google Analytics 4 and most CRM platforms automatically surface them. The skill is in knowing which measures to look at and what they actually mean for the business.
Purchasing Patterns and Preferences
Tracking purchase frequency, average basket size, and peak buying periods gives a clear picture of how customers behave over time. A hospitality business in Belfast tracking weekly covers, average spend per table, and return visit rates across a quarter can use those three data points to plan staffing, set menu pricing, and decide when to push promotional activity. None of this requires a data analyst; it requires a clear dashboard and the discipline to review it regularly.
Demographics and Segmentation
Descriptive statistics also apply to customer demographics. Age range, location, acquisition source, and device type are all data points most SMEs already collect through their website and booking systems. Grouping customers by these characteristics is a form of descriptive analysis — and it’s the first step toward meaningful segmentation.
The meaning, types, and applications of business statistics cover the core statistical vocabulary in more depth if you’re building familiarity with these terms for the first time.
Spotting Trends with Data Visualisation
Raw numbers are difficult to interpret quickly. Data visualisation converts them into charts, graphs, and dashboards that make patterns visible at a glance — which is why it’s one of the most widely used tools in business management.
Choosing the Right Chart for the Question
The chart type should follow the question you’re asking. Line charts show trends over time: revenue month-on-month, website sessions week-on-week, conversion rate across a campaign period. Bar charts compare categories: sales by product line, enquiries by channel, revenue by region. Scatter plots reveal relationships between two variables: ad spend against leads generated, or staff hours against output.
Getting this wrong doesn’t just look unprofessional — it can lead to misleading conclusions. A bar chart showing monthly revenue without a baseline comparison tells you nothing useful. A line chart covering too short a period will show noise rather than trend.
Dashboards for SME Decision-Making
For most SMEs, the practical application of data visualisation isn’t a bespoke analytics platform — it’s a well-configured dashboard. Google Looker Studio (free), Microsoft Power BI, and the reporting views built into most CRM and marketing platforms all allow you to surface the metrics that matter in one place.
The key discipline is deciding which metrics to track before building the dashboard, not after. Tracking 30 metrics creates confusion. Tracking 6 or 8 that directly relate to the business’s commercial goals produces decisions. As Ciaran Connolly, founder of ProfileTree, advises SME clients: “Start with the three numbers that, if they moved in the right direction, would tell you the business is working. Build your reporting around those first.”
Business analytics tools for SMEs cover the specific platforms worth considering, including free and low-cost options suited to businesses without a dedicated data team.
Using Regression Analysis to Understand What Drives Results
Descriptive statistics tell you what happened. Regression analysis helps you understand why — and what’s likely to happen if conditions change. It identifies the relationship between variables so you can quantify the effect of one thing on another.
Practical Applications for Business Managers
The most common business application is understanding how changes in one input affect an output. How does advertising spend affect enquiry volume? What’s the relationship between response time and customer satisfaction scores? How does pricing affect conversion rate on a service page?
These relationships aren’t always intuitive. A trade business in the UK might assume its enquiry volume tracks closely with its ad spend. Regression analysis might reveal that organic search traffic is a stronger predictor of leads than paid activity, shifting the budget accordingly.
Linear regression is the simplest form: it models a straight-line relationship between two variables. Multiple regression handles greater complexity by modelling the combined effect of several inputs on an outcome. Most spreadsheet software and basic analytics platforms can run these models without specialist knowledge.
Forecasting with Regression Models
Regression models are also used to forecast. If you have 24 months of sales data and you can identify the variables that drive revenue, you can use those relationships to project forward. This is useful for budget planning, stock purchasing, and staffing decisions.
The caveat is that regression models reflect the past. They become less reliable when market conditions shift significantly — something UK businesses have experienced repeatedly since 2020. Treat forecasts as informed estimates, not certainties, and build in variance assumptions. For a broader look at data sources that support this kind of analysis, the best websites for business statistics list the most reliable sources for UK and global reference data.
Financial Statistics for Business Decision-Making
Financial analysis is where statistical methods have the longest track record in business management. Every set of management accounts is, at its core, a statistical summary of financial activity — and the ratios derived from those accounts tell the story of business health more accurately than the raw figures.
Key financial ratios for SME management
Gross profit margin (gross profit divided by revenue, expressed as a percentage) shows how efficiently a business converts sales into profit before overheads. Tracking this monthly and comparing it with the same period the previous year shows whether the pricing strategy and cost of sales are moving in the right direction.
The current ratio (current assets divided by current liabilities) measures short-term liquidity. A ratio below 1.0 means a business cannot currently cover its short-term debts from liquid assets — a signal that requires action, not observation.
Return on investment (ROI) applies across the business: to marketing campaigns, to new equipment purchases, to staff training programmes. The calculation is straightforward (net gain divided by cost of investment, expressed as a percentage), but many SMEs apply it inconsistently — calculating marketing ROI carefully while never formally evaluating the return on a £15,000 software implementation.
Revenue forecasting
Forecasting future revenue using historical data is one of the most practically valuable statistical applications for growing businesses. A simple trend-based forecast takes your monthly revenue figures for the past 12 to 24 months, identifies the underlying growth rate, and projects that forward — with adjustments for known factors like seasonality, planned marketing activity, or changes in pricing.
This is the minimum level of financial modelling any business seeking external finance should have in place. Banks and investors are not looking for complex econometric models; they are looking for evidence that the management team understands its own numbers and can construct a credible case for future performance.
Tracking digital marketing spend against financial outcomes
One of the clearest opportunities for SMEs to apply financial statistics is in connecting digital marketing expenditure to measurable revenue outcomes. The challenge is that many businesses track marketing costs carefully but measure results poorly — counting clicks and impressions without mapping them to sales pipeline or revenue.
A properly constructed marketing ROI model tracks cost per lead, lead-to-sale conversion rate, and average customer value by channel. When those three numbers are known, you can calculate the revenue return from every pound spent on Google Ads, SEO, or social media — and make budget allocation decisions based on data rather than preference.
Operations, HR, and Workforce Data
Statistical analysis in operations and human resources is less visible to most SME owners than marketing or financial data, but it is often where the most significant efficiency gains sit.
Supply chain and demand forecasting
For product-based businesses, demand forecasting — using historical sales data to predict future stock requirements — is one of the clearest commercial applications of business management statistics. The goal is to hold enough inventory to meet customer demand without tying up working capital in excess stock.
A basic approach uses seasonal indices: calculating what percentage of annual sales typically fall in each month, based on two or three years of data, and using those ratios to plan ordering. This does not require specialist software — it requires consistent record-keeping and the discipline to consult the data before placing orders.
HR analytics and workforce planning
People management decisions are increasingly supported by statistical analysis in businesses of all sizes. For SMEs, the most actionable HR metrics are typically straightforward: staff turnover rate (how many people leave as a percentage of total headcount, tracked quarterly), absenteeism rate (days lost per employee per period), and output per employee in roles where that can be measured.
Tracking these consistently over 12 to 24 months reveals patterns that are impossible to spot from individual events. A hospitality business in Northern Ireland, for example, might discover that staff turnover spikes significantly in Q1 each year — a pattern that points to something structural (end of contract seasonality, winter workload, or management behaviour at a specific time of year) rather than individual circumstances.
Digital skills and training data
For businesses investing in digital training — one of the fastest-growing needs across UK and Irish SMEs as AI tools become embedded in everyday workflows — measuring the effectiveness of that training is a direct application of HR analytics. Pre- and post-training assessments, productivity metrics before and after implementation, and staff confidence surveys are all forms of statistical measurement that justify training investment.
AI and Data Tools for SMEs
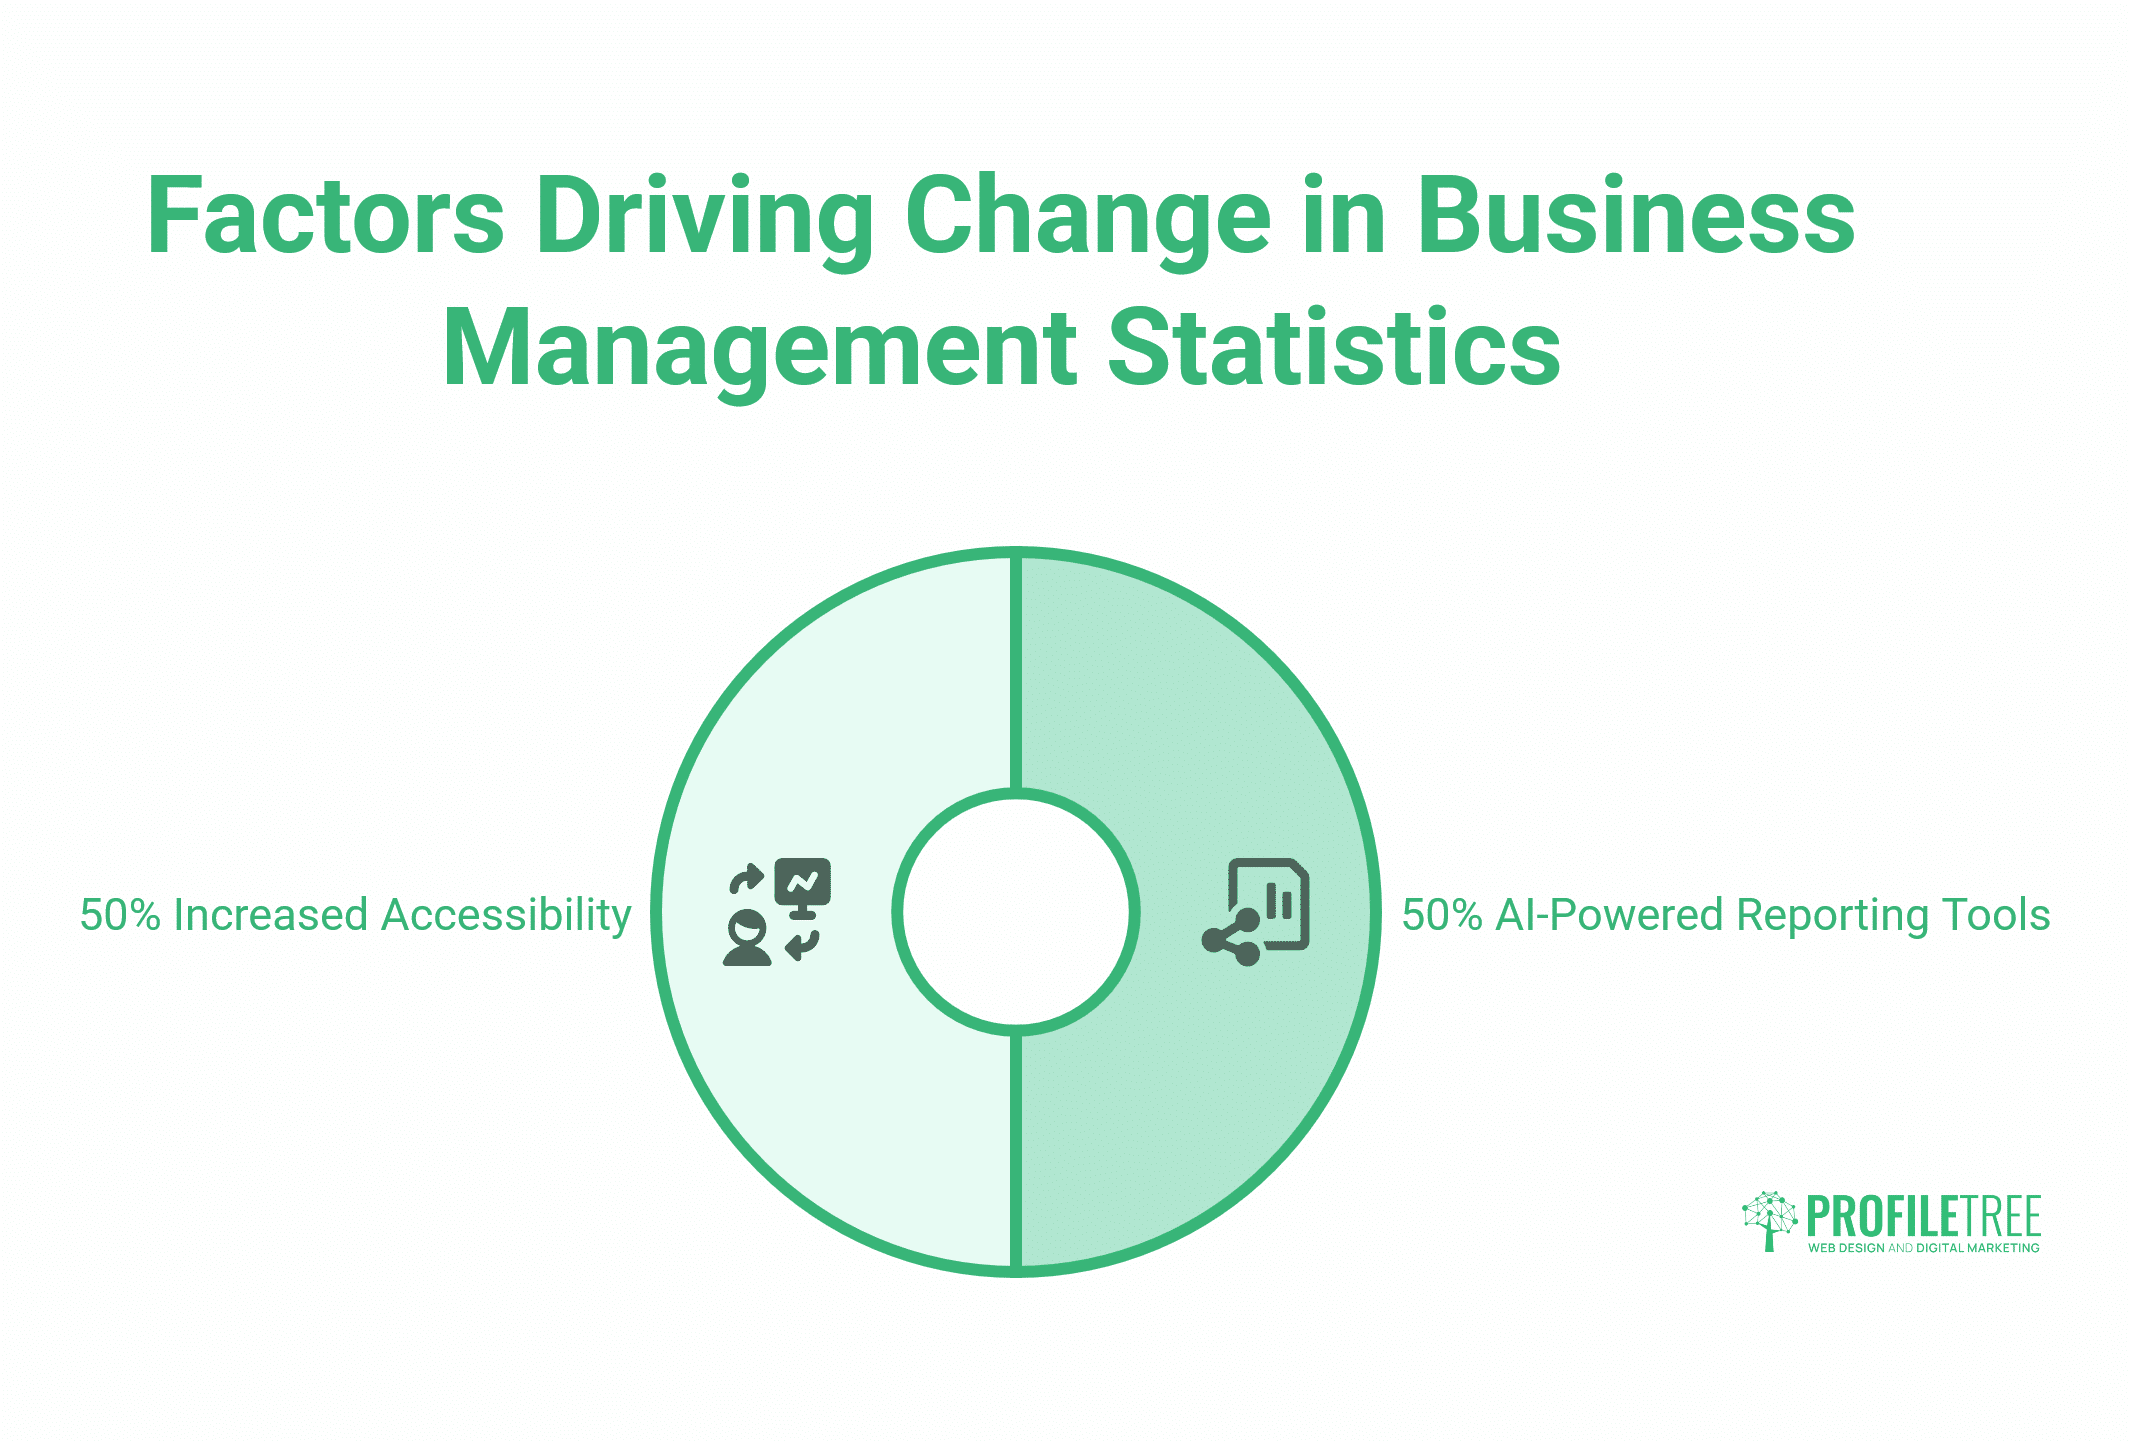
The most significant shift in business management statistics over the past two years is not a new statistical method — it is accessibility. AI-powered reporting and data analysis tools have made it practical for a business with no data analyst on staff to generate the kind of insight that previously required significant technical resources.
What AI-powered reporting actually means in practice
For most SMEs, AI in business analytics means one of two things: tools that automatically surface patterns in your existing data (flagging anomalies, generating trend summaries, predicting outcomes), or tools that connect previously separate data sources (sales data, website data, CRM data, financial data) into a single view.
The value of the latter is significant. A business tracking website traffic in Google Analytics, customer interactions in a CRM, and revenue in accounting software has three separate data streams that individually tell partial stories. Connected through an AI-enabled dashboard, they answer a fundamentally different question: what combination of marketing activity, customer touchpoints, and sales behaviour actually produces revenue?
ProfileTree works with SMEs across Northern Ireland, Ireland, and the UK to implement AI tools at exactly this level — not enterprise-grade data warehousing, but practical, affordable systems that give business owners meaningful visibility into the numbers that drive their business.
For SME owners who want to understand what AI implementation looks like before committing to a project, training your team to work with AI is a practical starting point, covering both the tools available and the internal changes needed to use them effectively.
Using data visualisation to communicate statistics
The most accurate data in the world has limited value if it cannot be communicated clearly to the people who need to act on it. Data visualisation — presenting numerical data in charts, graphs, and dashboards — is not decoration; it is a functional tool for decision-making.
Line charts reveal trends over time more clearly than tables of numbers. Bar charts make comparisons across categories immediate. Scatter plots show relationships between variables at a glance. The choice of chart type should follow the question being asked: if you are tracking a trend, use a line chart; if you are comparing totals across categories, use a bar chart; if you are looking for a relationship between two variables, use a scatter plot.
For SMEs presenting performance data to investors, partners, or senior staff, the quality of visualisation directly affects how well the data is understood and acted upon. A well-built marketing performance dashboard — showing traffic, leads, and revenue by channel in a single view — does more for strategic decision-making than any amount of raw data in a spreadsheet.
The role of statistics in digital marketing strategy
Digital marketing is among the most data-rich environments any SME operates in. Every paid campaign, every piece of organic content, every email sent, and every social post generates measurable data. The challenge is not collecting it — it is knowing which numbers to prioritise and how to connect them to commercial outcomes.
The statistical methods that matter most in digital marketing for SMEs are not complex. Conversion rate (the percentage of visitors who take a desired action) is the single most important metric for most websites. Cost per acquisition (the cost to bring in one paying customer, by channel) determines which marketing investments are worth scaling. Customer lifetime value (the average total revenue generated by a customer over their relationship with the business) determines how much it is rational to spend acquiring each new customer.
Conclusion
Business management statistics are most useful when they are treated as a regular management habit rather than an occasional exercise. The businesses that make the best data-driven decisions are not necessarily the ones with the most sophisticated tools; they are the ones that have identified which numbers actually matter, built a consistent process for collecting them, and developed the discipline to let the data challenge their assumptions. If you want to build that capability in your business — from analytics implementation to AI-powered reporting and digital training — ProfileTree works with SMEs across Northern Ireland, Ireland, and the UK to put practical data systems in place.
FAQs
What are business management statistics?
Business management statistics is the use of data collection, analysis, and interpretation to support business decisions. For most SMEs, the relevant methods are practical — descriptive statistics, trend analysis, and ratio calculation — rather than complex academic techniques.
How can small businesses use statistics without a data team?
Most small businesses already have the tools they need: Google Analytics, Search Console, a CRM, and accounting software. The priority is to define the three to five metrics that matter most and review them consistently.
What are the most important statistics for business decision-making?
For most SMEs, the highest-value metrics are conversion rate, cost per acquisition by channel, gross profit margin, customer lifetime value, and staff turnover rate. Our article on statistics in business decision-making explores these in more detail.
What is the difference between descriptive and inferential statistics in business?
Descriptive statistics summarise data you already have — revenue, average order value, website sessions by source. Inferential statistics draw conclusions from a sample, such as using a customer survey to represent your full customer base. Most SMEs work almost entirely with descriptive statistics.