Key Metrics to Measure Content Marketing Campaigns Success
Table of Contents
Most content marketing reports are full of numbers that don’t tell you much. Page views go up, someone puts a green tick on the spreadsheet, and the conversation moves on. The problem is that traffic without context is just noise.
Measuring content marketing properly means connecting what you publish to what your business actually needs: qualified leads, shorter sales cycles, better-informed customers. That requires a different set of questions and, often, a different set of metrics entirely.
This content marketing campaigns guide covers the four pillars of content measurement, how to implement tracking in GA4, how to account for content shared through private channels, and how to calculate the real efficiency of what you produce.
Why Content Measurement Usually Falls Short
Before getting into specific metrics, it’s worth understanding why so many measurement attempts fail to produce anything useful. The most common reason is confusing activity with outcomes. Publishing volume, follower counts, and raw impressions are easy to track but rarely linked to revenue.
Vanity Metrics vs Business Outcomes
A vanity metric is one that looks good in a slide deck but doesn’t change a business decision. Total page views is a classic example: a spike triggered by one viral piece of low-intent traffic can mask months of underperformance on content that actually converts. The fix is to define, before any campaign launches, what a business outcome looks like for this piece of content specifically.
For a how-to guide targeting potential clients, the outcome might be contact form submissions from that page. For a product comparison article, it might be the number of readers who subsequently visit a service page. Matching the metric to the intent is the foundation of any useful measurement framework.
The Data Silo Problem
Even when teams identify the right metrics, the data often lives in separate tools that never talk to each other. GA4 shows on-site behaviour. Your CRM holds lead quality data. Social platforms report engagement but rarely tie back to the pipeline. Without connecting these sources, you get a partial picture that leads to partial decisions.
The digital marketing campaigns that consistently perform well tend to be built around a single source of truth, whether that’s a CRM, a BI dashboard, or a well-structured GA4 account where key events are tracked end to end.
The Attribution Trap
Over-reliance on last-click attribution is another measurement gap that distorts content performance. A buyer who read three blog posts and a case study before requesting a demo will often be recorded as a direct conversion, with the content that shaped their thinking invisible in the data. Moving to assisted conversions or a data-driven attribution model gives a more honest account of what content is doing across the full customer journey.
The Four Pillars of Content Marketing Metrics
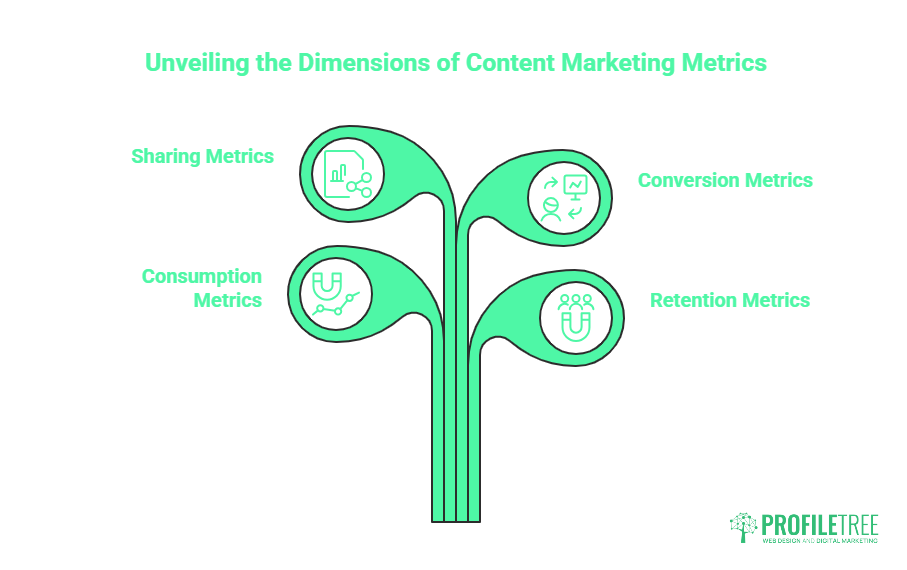
Rather than treating metrics as a flat list, it helps to organise them by what stage of the customer journey they reflect. The four-pillar model maps to the way buyers actually move through a decision: they discover, they engage, they consider, and they convert.
| Pillar | Key Metric | GA4 Event / Report | Business Goal |
|---|---|---|---|
| Consumption | Organic sessions, unique visitors | Traffic acquisition report | Brand awareness |
| Retention | Engagement rate, scroll depth | Engagement overview, custom scroll event | Content quality signal |
| Sharing | Social shares, inbound links | Referral source report, Ahrefs/GSC | Authority building |
| Conversion | Lead form submissions, assisted conversions | Key events, conversion paths | Pipeline contribution |
Consumption Metrics
Consumption metrics tell you how many people reached your content and from where. Organic sessions from Google Search Console or GA4’s traffic acquisition report give you a channel-level view. Unique visitors matter more than total page views because the same person refreshing an article doesn’t represent new reach.
For B2B content in particular, impression share from Google Search Console is worth tracking alongside clicks. A piece sitting at position 8 with deep impressions is a candidate for optimisation. A piece at position 20 with low impressions may need a rethink of its keyword targeting.
Retention Metrics
In GA4, the old bounce rate has been replaced by engagement rate, defined as the percentage of sessions that last longer than 10 seconds, include a conversion event, or involve at least two page views. For blog content, an engagement rate above 55% is generally a healthy baseline for UK B2B audiences.
Scroll depth, tracked as a custom event, tells you whether people are actually reading or abandoning after the first paragraph. If 70% of readers leave before the halfway point of a long guide, the content may need restructuring rather than more promotion. Understanding how business analytics tools surface this data is half the battle.
Sharing Metrics
Social shares are the most visible sharing signal, but inbound links remain the most valuable. A piece that earns three editorial backlinks from relevant industry sites contributes to organic authority in a way that 500 Twitter shares simply cannot replicate. Track both, but weight them differently when reporting to leadership.
Conversion Metrics
The conversion metrics that matter most are those tied directly to commercial intent: contact form submissions, demo requests, newsletter sign-ups from engaged readers, and file downloads that indicate intent research. Cost per lead from content, calculated by dividing total content production and promotion spend by the number of content-attributed leads, gives you a figure comparable to paid channel performance.
Mapping Metrics Across the Marketing Funnel
The pillar model above describes what metrics exist. Funnel mapping tells you which ones to prioritise for a given piece of content. An awareness-stage article should be judged on reach and engagement, not leads. Holding a broad educational guide to the same conversion standard as a service page comparison produces misleading conclusions.
Top of Funnel: Brand Awareness
Top-of-funnel content is trying to reach people who don’t yet know your brand exists. The relevant metrics here are organic impressions, new user acquisition, and branded search lift over time. Branded search lift, measured by tracking the volume of brand-name queries in Google Search Console over a rolling 90-day period, is one of the clearest signals that awareness content is working.
This is also where content that earns AI citations becomes measurable. Content appearing in Google’s AI Overviews or Bing’s generative answers is driving zero-click awareness at scale. Tracking this requires Bing Webmaster Tools’ AI page stats report and regular manual checks of AI Overview appearances for your target queries.
Middle of Funnel: Consideration and Intent
Mid-funnel content is read by people who know they have a problem and are evaluating options. Metrics here shift toward time on page, multi-page session depth, and return visits. A reader who views a how-to guide, then visits a service page, then downloads a case study across three separate sessions is showing high purchase intent even if they never fill in a contact form on the first visit.
Tracking this journey requires GA4’s exploration reports. The path exploration tool shows the sequence of pages within a session, revealing which content actually bridges readers toward commercial pages. For growing B2B businesses, this report often reveals that one or two pieces of content are doing a disproportionate share of the conversion work.
Bottom of Funnel: Conversion and Sales
At the bottom of the funnel, the question shifts from engagement to commercial outcome. Assisted conversion reports in GA4 show how often content appeared in the conversion path, even when it wasn’t the final touchpoint. This is critical for justifying content investment, because last-click attribution systematically undercounts content’s contribution.
If you work with a CRM, connecting GA4 client IDs to CRM contact records via first-party data allows you to track which content was consumed before a lead became a customer. This closes the attribution loop in a way that platform-level analytics alone cannot. Businesses looking to improve their digital marketing ROI consistently find that this integration pays for itself quickly.
Technical Implementation: Measuring Success in GA4
Google Analytics 4 operates on an event-based model rather than the session-and-pageview model of Universal Analytics. This is a significant shift for content teams, and getting it right makes the difference between reports that inform decisions and reports that just describe what happened.
Key Events to Set Up for Content Tracking
GA4 collects some events automatically: page views, session starts, scroll events at 90% depth, and outbound clicks. For content measurement, these defaults are a starting point rather than a complete setup. The events that add the most value for content teams are file downloads (PDFs, guides, templates), video engagement milestones (25%, 50%, 75%, 100% completion), contact form submissions tied to specific pages, and internal search queries.
Each of these should be marked as a Key Event in GA4 (formerly called Conversions), so they appear in conversion reports and can be weighted in attribution models. Without this step, GA4 treats all events equally, making it impossible to identify which content actions correspond to business value.
Building a Content Performance Exploration Report
GA4’s Explore section allows you to build custom reports not available in the standard interface. A content performance report built as a Free Form exploration with page title as the primary dimension, engagement rate and key event count as metrics, and organic search as a filter gives a clear view of which content is genuinely performing rather than just receiving traffic.
Adding session source/medium as a secondary dimension lets you see whether a high-performing piece is drawing most of its engaged audience from search, social, or email. This distinction matters when deciding whether to invest in further optimisation or in distribution for a given piece.
Setting Up Scroll Depth and File Download Tracking
GA4’s default scroll event fires at 90% page depth, which is too late to be useful for most long-form content. Using Google Tag Manager, you can set up custom scroll depth triggers at 25%, 50%, and 75% intervals. Comparing these thresholds against average time on page identifies pieces where people are scrolling quickly without reading, a pattern that often indicates the content is being skimmed for a specific answer rather than read in full.
File download tracking requires a GTM trigger set to fire on all clicks where the URL contains .pdf, .xlsx, or other file extensions. Feeding these events into GA4 as Key Events immediately makes downloadable assets visible in your content performance data, which matters particularly for gated content used in lead generation. This ties directly into the kind of structured approach outlined in our guide to content strategy refinement.
The Dark Social Challenge and Attribution in B2B Content
One of the most significant gaps in content measurement is the content that works but never appears in your analytics. When a potential client reads your article and shares it via email, Slack, or a private LinkedIn message, that referral shows up in GA4 as direct traffic. This is known as dark social.
How Dark Social Affects B2B Content Reporting
For B2B content specifically, dark social is not a marginal issue. Research consistently shows that professional content is shared primarily through private channels rather than public social feeds. A sector guide shared within a buying team’s Slack workspace or forwarded between procurement contacts represents high-intent readership that is systematically invisible in platform analytics.
The practical implication is that direct traffic, often dismissed as baseline noise, frequently contains a significant proportion of dark social referrals. For companies producing content for a professional B2B audience in the UK and Ireland, where LinkedIn direct messaging and email are the primary professional sharing channels, the gap between reported and actual content-driven visits can be substantial.
As Ciaran Connolly, founder of ProfileTree, puts it: “The content that actually wins clients rarely trends on social media. It circulates through WhatsApp groups and forwarded emails, and if you’re only measuring public channels, you’re measuring the wrong things.”
UTM Parameters and Qualitative Attribution
The most practical solution for reducing the dark social blind spot is consistent use of UTM parameters on all content links distributed through owned channels. When you publish a newsletter, share a guide via a sales email, or post an update on LinkedIn, using properly structured UTM parameters ensures those visits are attributed to the correct channel rather than lumped into direct traffic.
For shares you can’t control, a simple “how did you hear about us?” field on your contact forms and demo requests produces qualitative attribution data that, over time, reveals which content is driving inbound conversations. This approach is low-tech and underused, but it consistently surfaces channels and pieces that analytics alone would miss. The ethical handling of that first-party data also matters, particularly under UK GDPR.
GDPR-Compliant Tracking in the UK and Ireland
Tracking consent under UK GDPR means that a portion of your audience will decline analytics cookies, creating a structural gap in your reported data. Server-side tracking and cookieless measurement models, which use modelled data to fill in gaps from non-consenting users, are becoming standard practice for serious content operations.
The key takeaway for UK-based content teams is that reported metrics should always be understood as a lower-bound estimate of actual performance. Modelled data supplements but never replace consented tracking, so the priority is making cookie consent as accessible as possible rather than hiding or overcomplicating it. If you’re operating across Northern Ireland’s business landscape, it’s worth noting how much professional networking takes place in person and through community channels, as highlighted in resources like this guide to Northern Ireland’s cities. That same community-first culture shapes how B2B content actually travels.
Calculating Content ROI and Efficiency Metrics
ROI calculation for content is straightforward in theory and awkward in practice, because the costs are easy to identify, but the revenue attribution is always partial. The most useful approach is to track efficiency metrics alongside outcome metrics, so you can compare the productivity of different content types and production approaches.
Cost Per Content Piece vs Lifetime Value
Cost per content piece (CPCP) is calculated by dividing the total production cost of a piece, including research, writing, editing, design, and distribution time, by the number of leads or conversions it generates over its lifetime. Unlike cost per click in paid media, CPCP improves over time if the piece continues to generate organic traffic and conversions without additional spend.
Comparing CPCP against customer lifetime value (CLTV) for leads that originated through content gives you a long-term picture of content’s commercial contribution. A piece that cost £400 to produce and has generated eight qualified leads over two years, with a CLTV of £3,000 per converted client, has a far stronger ROI than its initial production cost suggests. All prices and figures in this guide are indicative UK examples and correct at the time of writing; use them as a benchmark rather than fixed quotations.
Measuring Content Efficiency Over Time
Not all content investments pay off at the same speed. Short-form social content may drive immediate traffic but generates minimal long-term returns. Comprehensive guides and pillar pages often underperform in the first three months before compounding as they accumulate backlinks and search authority. Understanding the payback period for different content types helps allocate budget more accurately.
Tracking organic sessions per piece at monthly intervals over 12 months shows the difference between content that peaks and declines versus content that builds steadily. Evergreen pieces with consistent or growing traffic are the most efficient use of production budget because the cost is fixed, but the returns compound. This is one of the core arguments for investing in transparent content marketing practices rather than volume-led publishing strategies.
Reporting for Business Stakeholders
Most senior stakeholders don’t need a dashboard full of engagement metrics. They need two or three numbers that connect content activity to business outcomes. A monthly content report covering organic lead volume from content-attributed sources, cost per content-sourced lead, and pipeline value from content-influenced opportunities covers the commercial story without overwhelming non-marketing readers.
Separating tactical weekly reports, which might track content publication pace, keyword movements, and social engagement, from strategic monthly reports focused on leads and pipeline keeps both audiences informed without forcing them to sit through the same meeting. For businesses building out a digital marketing strategy, this reporting discipline is often what converts content from a cost centre to a recognised revenue driver.
Conclusion
Measuring content marketing well is not about tracking more things. It’s about connecting the right metrics to specific business goals, setting up GA4 to surface the events that matter, and accounting for the attribution gaps that standard analytics cannot see. Content that earns clients rarely announces itself in a dashboard. Building the measurement infrastructure to find it is the work that separates content operations that grow from those that simply produce.
ProfileTree works with businesses across Northern Ireland, Ireland, and the UK to build content strategies grounded in data. Talk to our team about auditing your current measurement setup.
FAQs
What are the four main types of content marketing metrics?
The four main categories are consumption metrics (traffic and reach), retention metrics (engagement rate, scroll depth), sharing metrics (backlinks, social shares), and conversion metrics (leads, assisted conversions). Each maps to a different stage of the customer journey and should be evaluated in that context rather than compared directly.
How do I measure content success without Google Analytics?
CRM-level tracking provides an alternative source of truth: if you tag leads by their first or last known touchpoint, your CRM can show which content types are generating pipeline. Social platform native analytics cover reach and engagement. Qualitative attribution through contact form questions, such as “how did you hear about us?” captures dark social and word-of-mouth that no analytics platform sees.
What is a good engagement rate for a blog post in GA4?
GA4’s engagement rate counts sessions lasting over 10 seconds, involving two or more pages, or triggering a key event. For B2B blog content targeting a UK or Irish professional audience, an engagement rate between 55% and 70% is a healthy benchmark. Rates below 40% usually indicate either a mismatch between search intent and content or a page experience issue worth investigating.
How often should I report on content metrics?
Tactical checks, covering keyword position changes, content publication pace, and social engagement, are worth doing weekly. Strategic reviews connecting content activity to leads and pipeline belong in a monthly report for marketing leadership. Quarterly reviews should step back to assess which content clusters are contributing commercially and where production budget should be reallocated for the period ahead.
How does UK GDPR affect content tracking?
Under UK GDPR, analytics cookies require explicit consent, which means a share of your audience will never appear in your GA4 data. Server-side tracking and GA4’s modelled data features partially compensate, but reported figures should always be treated as a floor rather than a precise count.