Social Media Analytics: Deciphering Key Metrics for Strategic Insights
Table of Contents
Most businesses collecting social media data are measuring the wrong things. Follower counts and total likes feel satisfying to report, but they say almost nothing about whether your activity is generating revenue. Social media analytics, done properly, is the process of connecting platform data to commercial outcomes, and for UK SMEs operating with limited time and tighter budgets, knowing which numbers actually matter is what separates useful reporting from noise.
This guide covers the metrics worth tracking, how to structure your reporting, and where UK-specific factors, including data privacy obligations and the dominance of private messaging, change the picture for businesses here.
What Is Social Media Analytics?
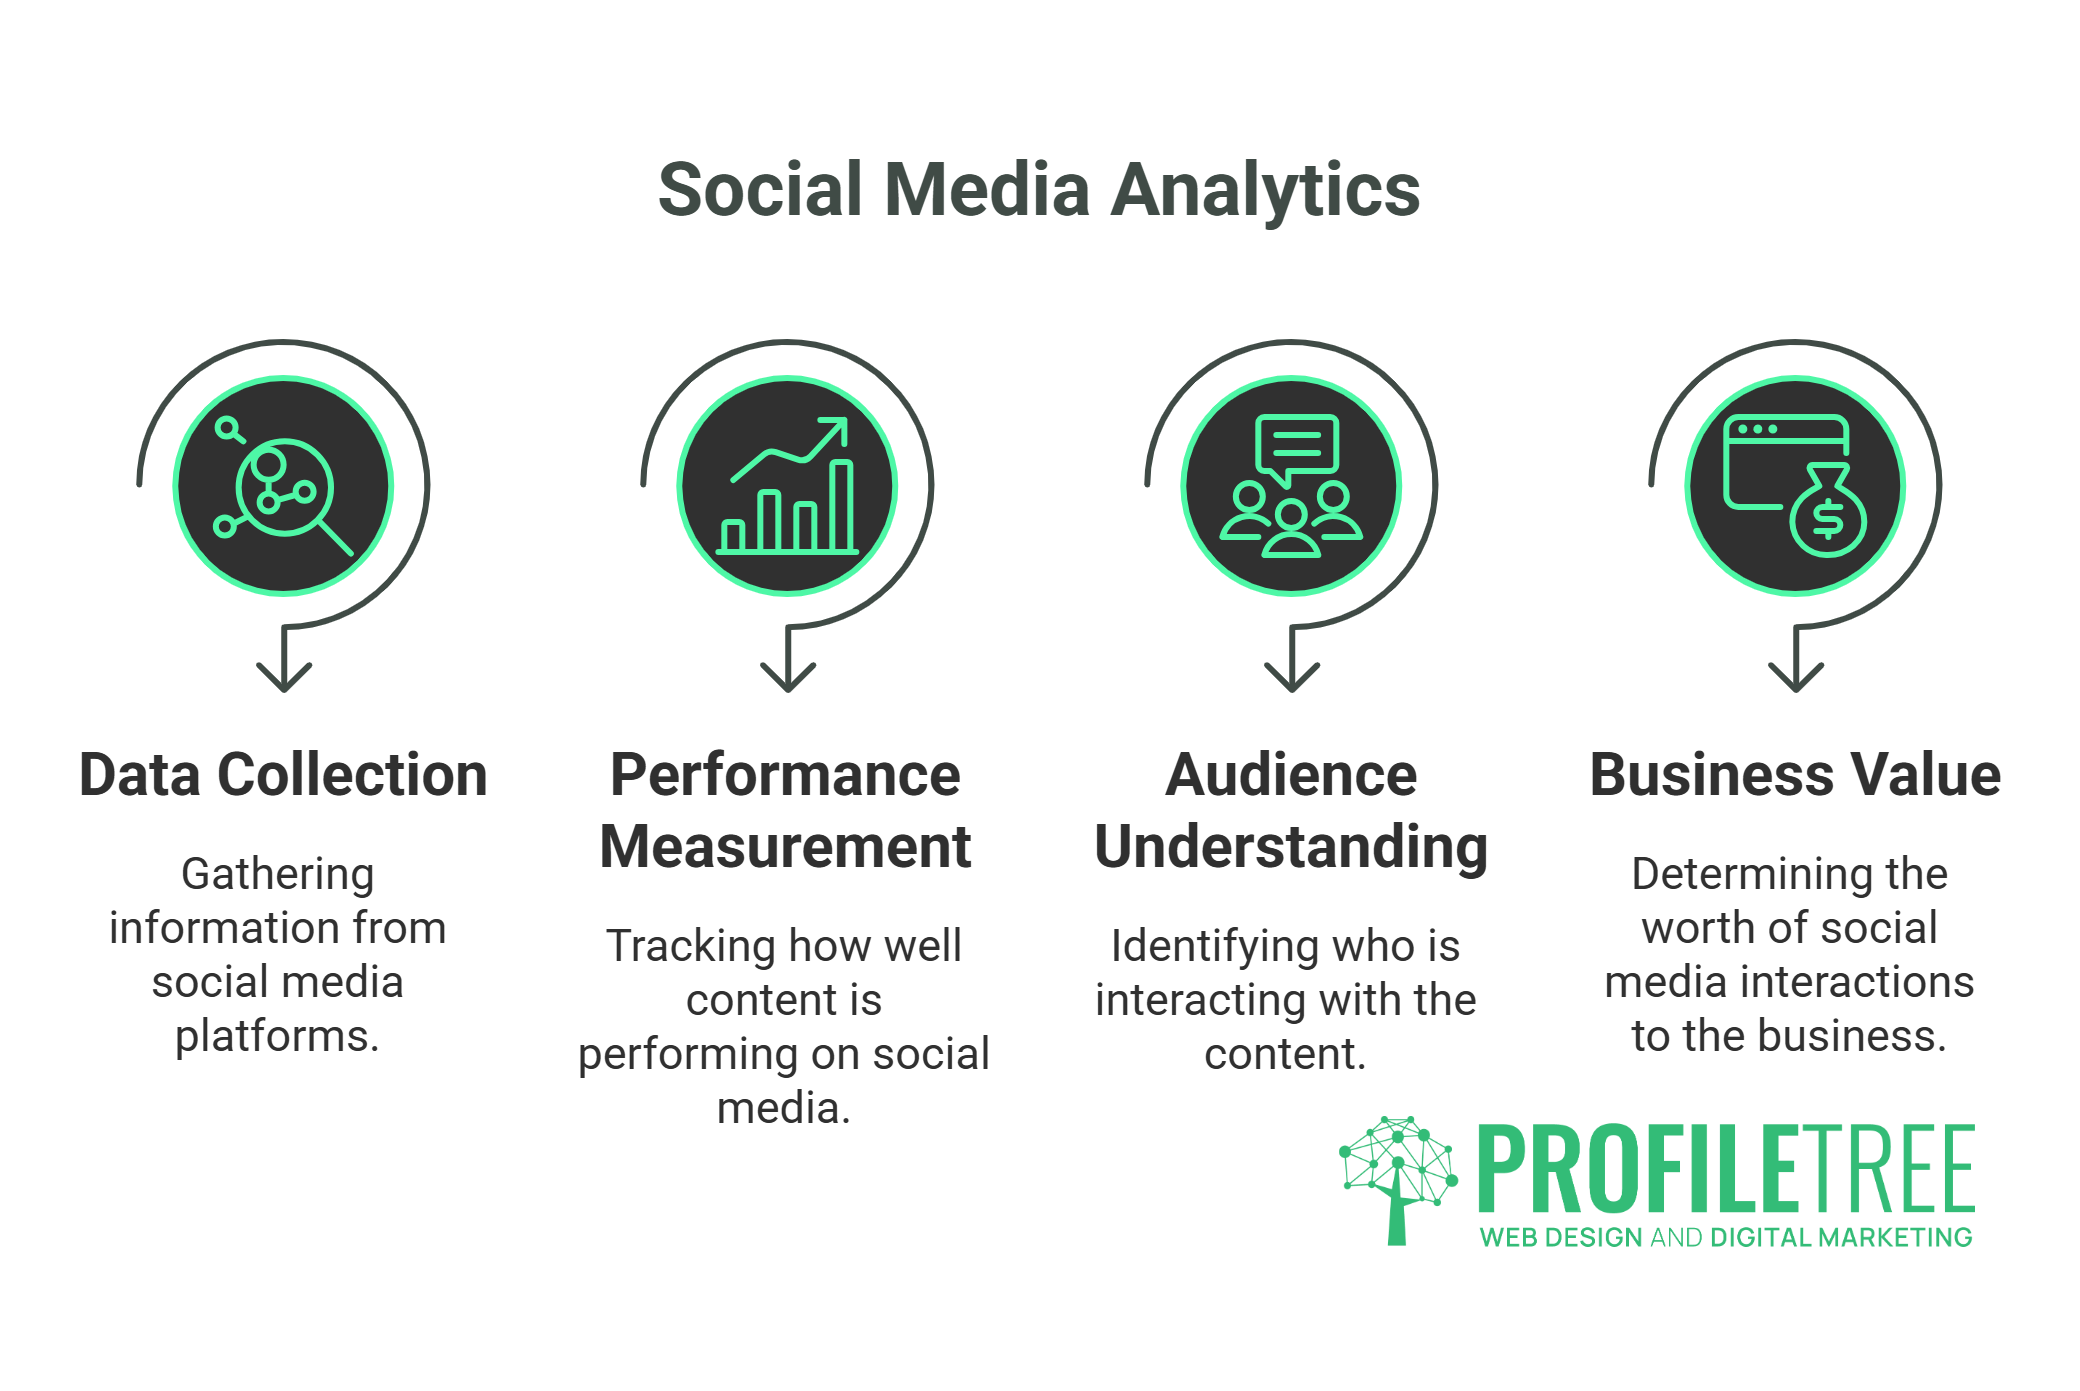
Social media analytics is the collection, measurement, and interpretation of data from social platforms to inform business decisions. It goes beyond counting interactions: it involves understanding why certain content performs, who is engaging with it, and what those interactions are worth to the business.
The Four Types of Social Media Analytics
Most frameworks organise analytics into four categories, each serving a different strategic purpose.
Descriptive analytics tells you what happened. Impressions, reach, follower growth, and engagement counts all fall here. These are the numbers most businesses already track, and they provide the historical baseline everything else builds on.
Diagnostic analytics explains why it happened. If a post significantly outperformed your average, diagnostic analysis looks at the variables: posting time, content format, topic, audience segment, and whether paid promotion was involved. This is where patterns start to emerge.
Predictive analytics uses historical patterns to forecast future performance. Which content types are likely to generate the most engagement next quarter? Which audience segments are most likely to convert? Platforms like Sprout Social and Hootsuite now offer predictive features, though for most SMEs, a well-maintained spreadsheet tracking your own historical data will get you most of the way there.
Prescriptive analytics tells you what to do next. It translates data into specific recommendations: post at this time, on this platform, with this format, for this audience. In practice, this is often the output of a proper monthly review rather than a platform feature.
Understanding which type of analysis you’re doing at any given moment stops you from drawing the wrong conclusions. A drop in reach (descriptive) doesn’t automatically mean your strategy is failing; diagnostic analysis might reveal it coincides with a platform algorithm change rather than a content quality problem.
Key Social Media Metrics to Track
The problem with most social media reports is not a lack of data but an excess of it. Every platform provides dozens of metrics; the skill is knowing which ones connect to your actual business goals.
Awareness Metrics
Reach is the number of unique accounts that saw your content. It is the broadest measure of audience exposure and the most useful metric for brand awareness campaigns.
Impressions count total views, including multiple views from the same account. A post with 500 reach and 1,200 impressions means your existing audience saw it more than once, generally a positive signal for algorithm distribution.
Share of voice measures your brand’s visibility relative to competitors within a topic or conversation. Tools like Brandwatch and Mention track this across platforms. For SMEs, monitoring brand mentions manually once a week is a reasonable starting point before investing in dedicated listening tools.
Engagement Metrics
Engagement rate is calculated as total interactions (likes, comments, shares, saves) divided by reach or followers, expressed as a percentage. It is the single most useful measure of content quality because it shows whether your audience is responding rather than just scrolling past.
UK benchmarks for 2026 vary significantly by platform and industry. As a general guide:
| Platform | Average Engagement Rate (UK, 2026) |
|---|---|
| 1.5–3.5% | |
| 2–5% (B2B content) | |
| TikTok | 4–8% |
| 0.5–1.5% | |
| X (Twitter) | 0.3–1% |
Any rate significantly above these averages suggests content that is resonating; significantly below suggests a format, topic, or timing problem worth investigating.
Saves and bookmarks are often overlooked but are particularly valuable signals. When someone saves content, they are flagging it as useful enough to return to, a stronger intent signal than a like.
Comments carry qualitative value that raw numbers cannot capture. A post generating genuine questions or discussion is building a different kind of relationship than one that attracts emoji reactions. Read them.
Conversion Metrics
- Click-through rate (CTR) measures how often people who saw your content clicked through to your website or a specific destination. Low CTR with high reach suggests a disconnect between what your content promises and what the link delivers.
- Conversion rate tracks the percentage of social visitors who completed a desired action on your website, a form submission, a purchase, a booking. This requires your analytics platform (Google Analytics 4 or equivalent) to be properly configured with UTM parameters on every social link you publish.
- Cost per result applies primarily to paid social campaigns and measures how much you spent to achieve each conversion. For organic content, the equivalent calculation uses staff time and content production costs.
As Ciaran Connolly, founder of ProfileTree, puts it: “The businesses that get the most from social analytics are the ones that connect their platform data to their CRM and website analytics. Until you do that, you’re only seeing half the picture.”
Social Media Analytics for UK Businesses: What’s Different
Generic social media guides are almost entirely written for US audiences or enterprise-level brands. Several factors make the UK context meaningfully different for SMEs.
Dark Social and Private Sharing in the UK
Research consistently shows that the majority of online content sharing happens through private channels, WhatsApp messages, direct messages, and email, rather than public posts. In the UK, WhatsApp penetration is significantly higher than in the US, making this particularly relevant for British brands.
Dark social refers to traffic that arrives at your website through private sharing links that analytics platforms cannot attribute to a specific source. It typically shows up as “direct” traffic in Google Analytics, which leads many businesses to underestimate the role social media plays in driving visits.
The practical workaround is consistent UTM parameter tagging on every link you share, including links you share in Stories, bio links, and any content distributed through messaging. When your tagged links start appearing as “direct” traffic, you know the share journey went through a private channel. You can also create specific short links for different distribution channels to compare volumes over time.
UK GDPR and Social Listening
Sentiment analysis and social listening tools that collect and process public social media data operate within a specific regulatory framework in the UK. Following Brexit, the UK retained and extended the GDPR framework through the UK Data Protection Act (2018) and continues to align broadly with EU standards.
For most SMEs, the practical implications are limited; monitoring publicly posted brand mentions and industry conversations is generally permissible. Where businesses need to exercise caution is in storing or processing personal data extracted from social platforms, particularly if using automated tools that build profiles of individual users. Always check the data processing terms of any social listening tool before committing to it.
The Online Safety Act (2023) adds further obligations for platforms themselves, but for businesses using social media as a marketing channel, the GDPR framework remains the primary consideration.
Moving from Vanity Metrics to Strategic Reporting
The most common failure in social media analytics is producing reports full of numbers that no one acts on. A post got 847 impressions last week. So what? What changed as a result?
Useful analytics reporting follows a “metric → insight → action” structure. Every data point in your report should lead to a specific interpretation and a specific decision.
The Metric Map: Connecting Data to Decisions
| Metric | What It Measures | Business Goal | The “So What?” |
|---|---|---|---|
| Reach | Audience size exposed to content | Brand awareness | If declining, investigate algorithm changes or posting frequency |
| Engagement rate | Content resonance | Audience quality | If below benchmark, test different formats or topics |
| CTR | Traffic generation | Website visits | If low, review the gap between the post promise and the destination |
| Conversion rate | Revenue contribution | If low, review the gap between post promise and the destination | If low with high CTR, the landing page is the problem |
| Follower growth rate | Audience building | Long-term reach | Vanity metric unless combined with engagement data |
How to Conduct a Social Media Audit in Five Steps
An audit gives you the baseline from which all improvement is measured. Run one before you change your strategy, and repeat it every six months.
- Step 1: Inventory your active platforms. List every account your business operates. Include inactive or legacy accounts. Assess which platforms are genuinely reaching your target audience versus which ones you maintain out of habit.
- Step 2: Gather three months of data. Pull reach, engagement rate, CTR, and follower growth from each platform. Use the native analytics tools; they are free and more accurate than third-party tools for platform-specific data.
- Step 3: Benchmark against industry averages. Use the UK benchmarks in the table above. Identify where you are significantly above or below average and prioritise investigating the outliers.
- Step 4: Map content types to performance. Which formats, video, carousel, static image, text post, generate the most engagement? Which generates the most clicks? These are not always the same answer.
- Step 5: Identify your two or three highest-impact actions. An audit should produce a short, specific action list, not a 40-slide presentation. What are the two changes most likely to move your numbers in the next 90 days?
The team at ProfileTree runs this process for clients as part of broader digital marketing campaigns{target=”_blank”}, often finding that businesses are investing time on platforms where their audience is not active while neglecting channels that show strong engagement data.
Choosing Analytics Tools for UK SMEs
The right tool depends on your budget, the platforms you use, and how much time you can realistically dedicate to analysis.
Free Tools Worth Using
- Native platform analytics, Instagram Insights, LinkedIn Analytics, Facebook Business Suite, and TikTok Analytics are more capable than most businesses realise. For a business managing two or three platforms, these tools cover the core metrics without additional cost.
- Google Analytics 4 is essential for tracking what social traffic does on your website. Set up UTM parameters on every link and create a simple dashboard showing social traffic by platform, sessions, and conversions.
- Meta Business Suite consolidates Facebook and Instagram data and allows basic cross-platform comparison.
Paid Tools for Growing Teams
- Buffer is well-suited to SMEs. It offers scheduling alongside analytics at a reasonable price point, with reporting features that cover engagement, reach, and post performance across platforms.
- Sprout Social is more powerful and more expensive. Its reporting features are strong for agencies or in-house teams managing multiple brands or accounts. The UK-specific benchmarking data it now includes makes it more useful for British businesses than it was previously.
- Hootsuite remains widely used and covers the core analytics needs well, though its pricing has increased significantly. Evaluate whether the features you use justify the cost compared to native tools, plus a lighter paid option.
For tracking social media marketing performance and its impact on sales{target=”_blank”}, the combination of native platform analytics plus GA4 covers most SME needs without a significant paid tool investment.
Reporting Social Media ROI to Business Leadership
Social media managers frequently struggle to translate platform metrics into language that resonates with directors, owners, or finance teams. The solution is to build your report around business outcomes rather than platform data.
A board-ready social media report covers four things: what it cost (time and budget), what it produced in terms of website traffic and leads, what those leads are worth based on your average conversion rate and deal size, and what the data suggests you should do differently next quarter.
Assisted conversions are particularly important in this context. Most social media interactions do not result in an immediate purchase; they are early-stage touchpoints in a longer buying journey. Google Analytics 4’s attribution reports show how often social media appeared in the path to conversion, even when it was not the last touch before purchase. Including this data gives a more accurate picture of social media’s commercial contribution than last-click attribution alone.
For a practical framework for connecting social media activity to broader digital strategy results, the approach is the same: trace the path from content to conversion and quantify each step.
Predictive Analytics and AI in Social Media Reporting
AI-powered features within social media tools have become genuinely useful rather than merely promotional. Most major platforms now incorporate some form of predictive recommendation: suggested posting times based on your audience’s historical activity, content format suggestions based on engagement patterns, and automated anomaly detection that flags unusual changes in performance.
For UK SMEs, the most practical application is using these recommendations as a starting point rather than a prescription. Platform-suggested posting times reflect your specific audience data, which makes them more relevant than generic “best time to post” guides. Content format recommendations based on your own historical data are similarly worth testing, particularly if your current approach is based on assumptions rather than evidence.
What AI tools cannot replace is the strategic interpretation of data in context. A spike in engagement that correlates with a news event, a sudden drop in reach that coincides with a platform algorithm change, or a pattern of high engagement with low CTR that suggests your content is entertaining but not commercially positioned, these require human judgment to interpret correctly.
FAQs
What is the best social media analytics tool for UK SMEs?
For most UK SMEs, the most practical starting point is native platform analytics (Instagram Insights, LinkedIn Analytics) combined with Google Analytics 4 for website data. If you manage multiple platforms and need consolidated reporting, Buffer offers a reasonable balance of features and cost. Sprout Social is worth considering once you have a dedicated social media function and need more detailed benchmarking and reporting.
Is social media analytics GDPR compliant?
Monitoring your own brand’s social media performance data is fully compliant, you are analysing aggregate data about content performance, not personal data about individuals. Social listening that involves collecting and storing personally identifiable information from public posts falls within UK GDPR scope, and you should check the data processing terms of any listening tool before use. Anonymised, aggregated sentiment data is generally permissible.
What is the difference between reach and impressions?
Reach counts the number of unique accounts that saw your content. Impressions count the total number of times your content was displayed, including multiple views from the same account. A high impressions-to-reach ratio means your content is being seen repeatedly, which is generally positive for brand recall.
How often should I check my social media analytics?
A daily “pulse check” of the previous day’s key metrics (reach, engagement rate on recent posts) takes around ten minutes and flags anything unusual quickly. A deeper monthly review, covering trend analysis, content format performance, and platform comparison, is where strategic decisions should be made. Avoid making strategy changes based on daily fluctuations, which are often noise rather than signal.
How do I track conversions from Instagram in the UK?
Instagram does not pass full referral data to Google Analytics, so UTM-tagged links are essential. Use a single consistent link in your bio with UTM parameters, update it when you run specific campaigns, and use Instagram’s built-in conversion tracking for any paid activity. For Stories, make sure every swipe-up or link sticker uses a UTM-tagged URL. DM-driven traffic is harder to attribute; a dedicated landing page or enquiry form question (“How did you find us?”) helps capture what analytics cannot.
Can I track my competitors’ social media analytics?
You can monitor publicly available data, post frequency, follower counts, and engagement on individual posts through tools like Sprout Social’s competitor benchmarking or free tools like Social Blade. You cannot access their internal analytics. Social listening tools can track brand mentions and share of voice across topics, which gives a reasonable proxy for comparing content performance and audience response.
Conclusion
Social media analytics becomes genuinely useful when it moves from reporting what happened to driving what you do next. Start with the metrics that connect directly to your business goals, build a reporting structure your leadership can act on, and revisit your approach every quarter. ProfileTree works with SMEs across Northern Ireland, Ireland, and the UK to build social media strategies grounded in data rather than habit{target=”_blank”}. If your current reporting isn’t informing decisions, that’s the first thing worth fixing.