How to Build a Visual Content Strategy That Delivers
Table of Contents
Most small businesses know they need better visuals. What they often lack is a clear plan for producing, distributing, and measuring whether it actually works.
This guide is written for SME owners and marketing managers across Northern Ireland, Ireland, and the UK who want to build a visual content strategy that performs. We cover the seven types of engaging visual content that earn results, a practical production framework you can follow with or without a specialist team, and how to measure what actually matters.
Beyond Decoration: Why Engaging Visual Content Drives Revenue
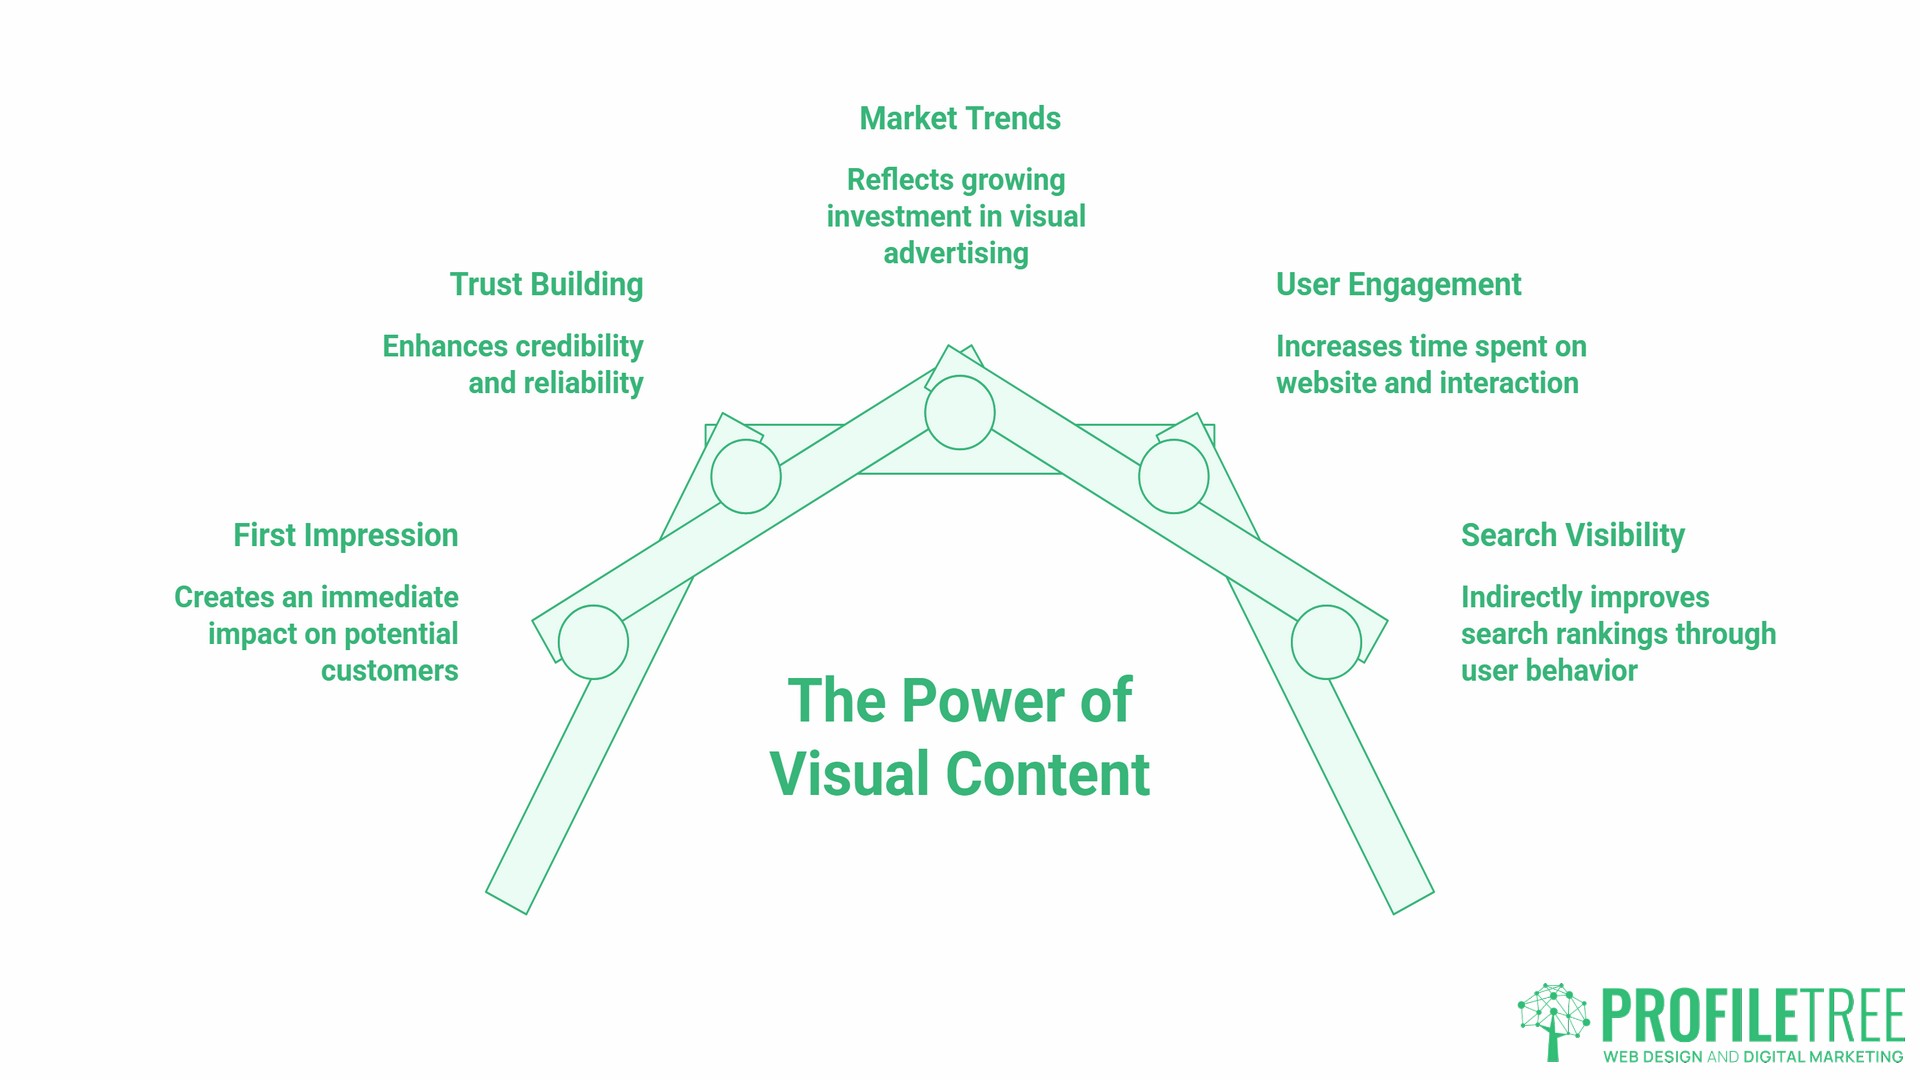
The case for engaging visual content is not about aesthetics. It is about how the human brain processes information.
We are wired to respond to visual stimuli before we process written language. A visual makes the first impression on a prospective customer before a single word is read. That impression either builds or erodes trust, and for SMEs competing against larger brands with bigger budgets, the quality of that first impression carries real commercial weight.
The market data support this direction of travel. According to IAB UK’s Digital Adspend 2025 study, UK investment in video advertising rose 20% year-on-year to £9.3 billion, growing faster than the overall digital ad market. Video now accounts for 59% of all social media advertising investment in the UK. These are not trend signals; they are buying decisions by brands that have tested and measured results.
There is also a practical benefit for your website. Pages with rich visual content, including original images and embedded video, tend to attract stronger user engagement signals. While Google has not officially confirmed dwell time as a direct ranking factor, leaked internal documents from the 2024 antitrust proceedings showed that user behaviour metrics, including what Google internally calls “long clicks,” do influence how pages are evaluated. Content that holds attention supports both the user experience and, indirectly, your search visibility.
The 7 Types of Engaging Visual Content in 2026
Understanding which formats work, and why, is the foundation of any practical visual strategy.
Short-Form Video: The Non-Negotiable Standard
Short-form video is now the dominant format across Instagram Reels, TikTok, YouTube Shorts, and LinkedIn. For SMEs, the challenge is not understanding that video works. It is producing video that meets the quality standard audiences now expect, consistently enough to build an audience.
A 60 to 90-second video explaining a service, demonstrating a product, or sharing a relevant insight can be distributed across multiple platforms without being reformatted from scratch. Unlike a written post, it places a real person in front of the audience, which builds trust faster than most other formats.
ProfileTree’s video production services are built around exactly this challenge: helping businesses in Belfast and across Northern Ireland produce video content that represents their brand accurately and performs commercially.
Data Storytelling: Making Insights Visual
Raw data is forgettable. Visualised data is shareable.
If your business holds any proprietary data, whether that is survey results, customer feedback patterns, or operational benchmarks, turning it into a clear chart or infographic gives you something genuinely original to publish. Infographics earn strong link equity because other publishers reference them as source material. They also perform well in AI-generated search overviews because they present structured, citable information in a form that is easy to extract.
The key is simplicity. One clear point per infographic, presented with a clean design, will outperform a complex multi-layer graphic every time.
AI-Assisted Imagery: Efficiency Without Losing Brand Identity
AI image generation tools, including Midjourney, Adobe Firefly, and Canva’s AI features, have changed what is accessible to small marketing teams. These tools can produce illustration-style imagery, conceptual graphics, and background assets at a fraction of the cost of commissioning original photography.
Used well, AI-assisted imagery fills the gap between professionally shot photography, which remains the gold standard for hero images, and the ongoing need for content at scale. Used poorly, it produces generic, style-less images that damage brand perception.
The practical approach for SMEs is to use AI tools to support visuals and social assets, while investing a professional production budget in the imagery customers see first: your website hero image, your LinkedIn profile, and your video thumbnails.
ProfileTree’s AI training and implementation services help SME teams understand where AI tools add genuine value in content workflows and where they create more problems than they solve.
Interactive Infographics and Polls
Static infographics earn attention. Interactive content earns time on page and data.
Polls on Instagram Stories and LinkedIn, interactive calculators embedded in blog posts, and clickable infographics that expand on demand all share one quality: they give the audience something to do rather than something to scroll past. This active engagement drives the user behaviour signals that matter for both social media algorithms and search performance.
For SMEs without a dedicated developer, tools like Outgrow and Typeform make basic interactive content accessible. More sophisticated interactive assets, particularly those embedded on a website, benefit from professional development to ensure they load correctly and track engagement properly.
User-Generated Content as Visual Social Proof
User-generated content (UGC) is the most cost-effective form of engaging visual content available to any SME. When a customer photographs your product, shares a video testimonial, or posts about their experience with your service, that content carries a credibility that branded photography cannot replicate.
The research is consistent. According to Stackla, 85% of consumers find UGC more influential than brand-produced photos or videos, and Nielsen data shows 92% of consumers trust recommendations from people they know above any other form of advertising.
“The businesses that grow fastest online are usually not the ones with the biggest content budgets,” says Ciaran Connolly, founder of ProfileTree. “They are the ones that have created a genuine experience worth sharing and made it easy for their customers to share it. That organic visual content builds trust in a way that polished corporate imagery simply cannot.”
The practical implication is that your visual content strategy should include a plan for collecting and sharing customer content, with clear permission protocols in place.
Personalised Visual Messaging for B2B Audiences
Most visual content guides focus on B2C use cases. For B2B SMEs, the challenge is different. LinkedIn carousels presenting case study outcomes, data visualisations embedded in proposals, and branded slide decks shared after presentations all serve as visual content assets in a B2B context.
Personalisation matters here more than production value. A LinkedIn carousel that speaks directly to a specific industry challenge, using data relevant to that sector, will outperform a polished generic graphic. B2B buyers are looking for evidence of expertise, not entertainment.
Memetic Content: Cultural Relevance for UK and Irish Brands
Not every piece of engaging visual content needs to be produced from scratch. Format-native content, which uses the conventions, humour, and references familiar to a specific audience, can be created quickly and earns high organic engagement when it lands.
For UK and Irish SMEs, this means being aware of local cultural references, current events, and platform-specific formats. It does not mean forcing memes into a brand voice that does not suit them. If your brand is formal and technical, format-native content is probably not the right tool. If your brand is approachable and community-focused, it can be a cost-effective way to reach new audiences.
The SME Production Framework: From Idea to Asset
Knowing the formats is the easy part. The harder challenge for most SMEs is building a repeatable process for producing engaging visual content without it consuming every available hour.
Phase 1: Strategic Planning and Storytelling
Before any production begins, clarify what you are trying to communicate and to whom. The most common mistake is starting with format (“we need a video”) rather than starting with intent (“we need customers to understand what makes our service different from cheaper alternatives”).
For each piece of visual content, define the single thing you want the audience to take away. Then ask whether a video, infographic, photograph, or interactive asset is the most effective delivery mechanism for that specific message.
ProfileTree’s content marketing services begin at this strategic level, ensuring that every visual asset produced serves a defined purpose within a broader content plan.
Phase 2: Choosing Your Tech Stack
The right production tools depend on the type of content, your team’s skills, and your budget. The table below gives an honest overview of the trade-offs.
| Content Type | DIY Tool | Quality Ceiling | When to Outsource |
|---|---|---|---|
| Social media graphics | Canva, Adobe Express | Medium (suitable for text-led posts) | When brand consistency is critical across campaigns |
| Short-form video | CapCut, iPhone camera | Medium (good for authenticity-led content) | When production quality must represent a premium brand |
| Infographics | Canva, Visme | Medium (suitable for simple data) | When the infographic will be used in PR or link building |
| Professional photography | N/A | Requires professional equipment | Always for website hero images and key product shots |
| AI imagery | Midjourney, Canva AI | Medium (suitable for editorial and social) | When brand identity requires specific art direction |
DIY tools are appropriate for content that needs to feel immediate and authentic. Professional production is appropriate for content that needs to represent your brand at its best.
Phase 3: Distribution Across the UK Digital Landscape
Producing content is only half the process. Distribution determines whether that content reaches the audience it was made for.
Each platform has its own technical requirements, audience expectations, and algorithmic preferences. A 9:16 vertical video formatted for Instagram Reels will not serve well as a LinkedIn post without adaptation. A data-rich infographic built for LinkedIn will not perform on Instagram Stories without significant simplification.
One of the most practical efficiency gains available to SMEs is the content atomisation principle: produce one substantial piece of content, then break it into multiple platform-appropriate assets. A five-minute YouTube video can yield a 60-second Reel, three still image frames with pull-out quotes, and a text post based on the transcript. This approach multiplies the return on each production investment.
For teams that lack the capacity to manage this process, ProfileTree’s digital marketing strategy services provide the planning and execution framework that turns individual content assets into a coordinated, cross-platform programme.
Measuring What Matters: Visual Content ROI
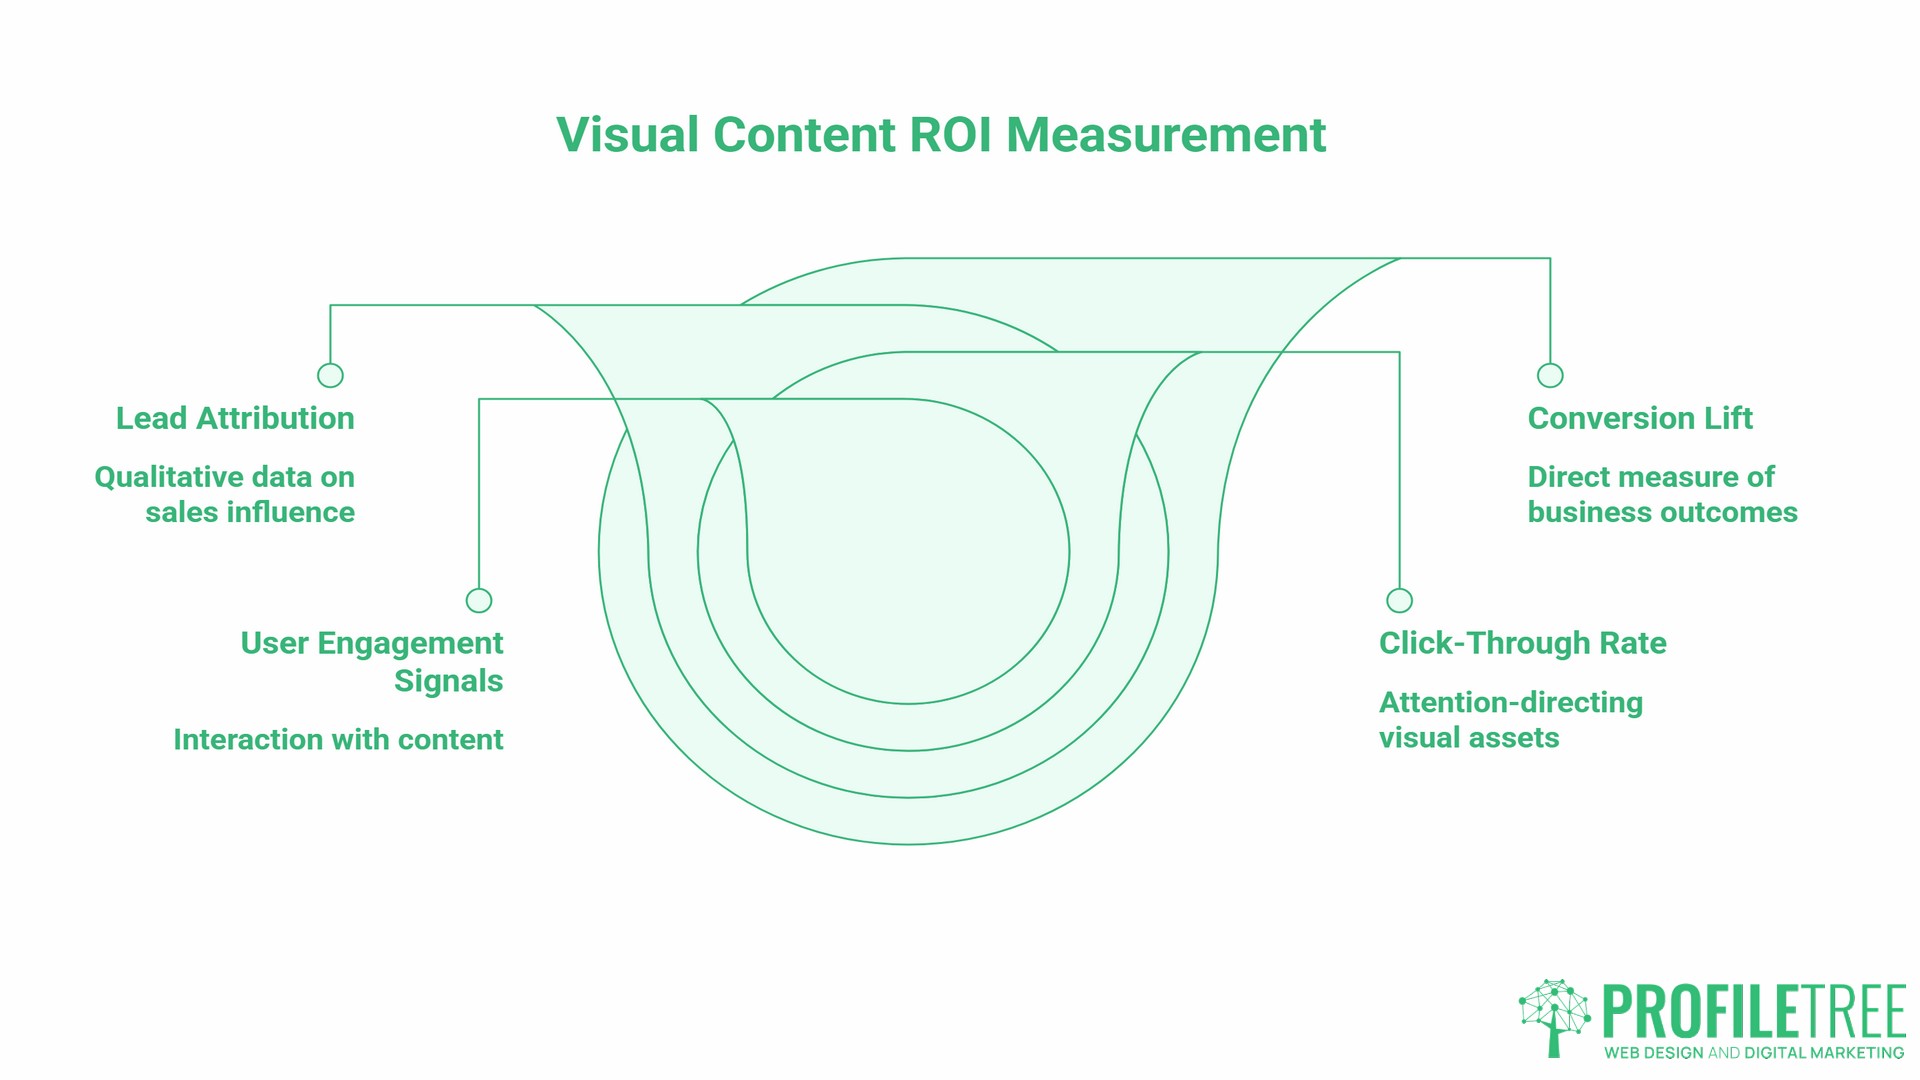
The standard approach to measuring visual content tracks engagement metrics such as likes, shares, comments, and views. These are useful indicators of reach and resonance, but they do not tell you whether your engaging visual content is contributing to business outcomes.
A more useful measurement framework tracks the following.
- User engagement signals. In Google Analytics 4, metrics including engaged sessions, scroll depth, and event completions show how visitors interact with your content. Visual content that holds attention will produce stronger engagement data. Pages where visitors leave quickly, despite strong traffic, may feature visual content that does not align with audience expectations.
- Click-through rate from visual assets. If you are embedding a video on your website, how many visitors click to play? If you are using visual content in email campaigns, which image-led emails generate the most clicks? These metrics show whether your visuals are directing attention.
- Conversion lift. The most direct measure of visual content ROI is whether pages with stronger visual content convert at a higher rate than pages without it. A/B testing that varies the visual treatment of a service page or landing page gives you direct evidence of which approach works.
- Lead attribution. If a prospect mentions a specific video or piece of content in a sales conversation, record it. This qualitative data builds a picture of which visual content is influencing real commercial decisions, not just generating impressions.
Solving the Production Gap: How ProfileTree Scales Your Visual Output
The most common barrier to effective visual content for SMEs is not a lack of ideas. It is the gap between what a business knows it should be producing and what its internal team actually has the capacity to deliver.
This gap has three common forms: time constraints that mean planned content never gets made; skills gaps that mean content gets made but does not represent the brand well; and coordination failures that mean content gets produced but never distributed effectively.
ProfileTree works with businesses across Northern Ireland, Ireland, and the UK to close this gap. Our video production team handles everything from scripting and filming to editing and optimisation. Our content marketing team builds the strategic framework that ensures individual assets serve a larger commercial purpose. Our digital training programmes build the internal capability, which means your team can handle day-to-day visual content without needing to outsource every piece.
The right solution depends on your team’s existing capacity and the type of content your brand needs most. Get in touch with the ProfileTree team to discuss your requirements.
Frequently Asked Questions
How much does visual content production cost for a UK SME?
Costs vary significantly depending on content type. DIY social media graphics using tools like Canva cost only staff time. Professionally produced short-form video for a UK SME typically ranges from a few hundred pounds for a single-camera testimonial to several thousand for a fully edited brand film. Infographic design for PR and link-building purposes usually falls in the mid-hundreds range. The right investment depends on the content’s commercial purpose and where it will be seen.
What are the seven types of visual content I should focus on first?
Short-form video, data infographics, AI-assisted imagery, interactive content, user-generated content, B2B visual assets such as LinkedIn carousels, and format-native content. The priority order depends on your audience and your existing production capacity. Most SMEs should start with short-form video and UGC before investing in more complex formats.
How do I make my visuals accessible to all users?
Write descriptive alt text for all images on your website and include captions on all video content. Use sufficient contrast between text and background in graphics, and avoid relying on colour alone to convey meaning. These practices serve users with visual impairments and also support SEO, as alt text is indexed by search engines.
Can AI replace a professional videographer?
Not for the content that matters most. AI video tools are useful for transcribing audio, generating rough cuts, and automating subtitles. They cannot replace the judgment, technical skill, and creative direction that a professional brings to content designed to represent a brand well. The practical approach is to use AI tools to handle the mechanical parts of video production and invest professional time where human judgment makes a visible difference.
How often should I post visual content on social media?
Quality consistently outranks frequency. Three to four high-quality visual posts per week will outperform daily low-effort content in both engagement and long-term audience growth. The content atomisation approach described in Phase 3 is the most practical way to maintain posting frequency without sacrificing quality.
What is the best aspect ratio for engaging video content?
9:16 vertical format for Instagram Reels, TikTok, and YouTube Shorts. 16:9 horizontal for YouTube, your website, and presentations. 1:1 square for standard social feeds and LinkedIn posts. Always produce for the primary distribution platform first and adapt for secondary platforms afterwards.