Instagram Audience Insights: Analysis and Influencer Strategy
Table of Contents
Instagram Insights contains far more than likes and follower counts. When read carefully, the platform’s native data tells you who your audience actually is, how potential influencer partners perform before you commit budget, and where competitors are winning or losing attention without you paying for a third-party tool.
This guide focuses on three specific uses of Instagram Insights that most brands underuse: deep audience profiling, manual competitor research, and influencer evaluation. For the technical walkthrough of accessing Insights and tracking ad performance, see our companion guide on using Instagram Insights for marketing strategy.
What follows is aimed at marketing managers, brand owners, and social media leads across Northern Ireland, Ireland, and the UK who want to get more strategic value out of data they already have.
Reading Your Audience Data Beyond the Basics
Most accounts glance at the top-line follower demographics and move on. The real value of Instagram’s audience data sits one or two layers deeper, in the gaps between what you assume about your audience and what the numbers actually show.
Age and Gender: What the Splits Tell You
Instagram Insights breaks your follower base into age brackets (13-17, 18-24, 25-34, 35-44, 45-54, 55-64, 65+) split by gender. The useful question is not just which group is largest, but which group over-indexes compared to your customer data from other channels.
If your CRM shows that 45-54-year-old women are your highest-value buyers but your Instagram follower base skews 25-34, you have a content mismatch rather than a reach problem. The audience coming to your profile is not the audience buying from you, which changes the brief for creative entirely.
For B2B brands in Northern Ireland using Instagram for recruitment or thought leadership, rather than direct sales, the demographic split becomes a proxy for talent pipeline health: are the people engaging with your employer brand content the age cohort you are actually trying to hire?
Location Data and UK Peak Times
The Insights location breakdown shows followers by country and city. For businesses serving specific regions, this data is worth checking quarterly, since follower geography drifts as content spreads beyond your target area.
The “Most Active Times” section (found under Audience in a Business account) shows hourly and daily activity patterns for your specific followers. UK and Irish audiences have distinct peak windows that differ from the US-centric benchmarks in most published guides.
Typically, weekday engagement peaks between 12:00 and 14:00 GMT and again between 19:00 and 21:00 GMT, though this varies by sector and audience age. Your own data will be more accurate than any industry average, so use the Insights figures rather than generic scheduling advice.
For businesses targeting both Northern Ireland and the Republic of Ireland, note that the location data does not separate the two jurisdictions clearly; Belfast and Dublin may both appear under their respective countries, but cross-border audiences often behave similarly in terms of timing and content preferences.
Reached vs. Follower Audience: Why the Gap Matters
Instagram Insights distinguishes between the demographics of people who follow you and those your content actually reached during a given period. These two groups are often meaningfully different, particularly if you are using hashtags or Reels that pull in non-followers.
If your reached audience is consistently younger or from different locations than your follower base, your content distribution pattern is working outside your core audience. That is not automatically a problem, but it should be a conscious decision. Understanding Instagram Reels’ reach mechanics helps explain why short-form video tends to pull a broader demographic than static posts, which is worth factoring into your content mix planning.
Turning Audience Segments into Content Briefs
Demographic data only becomes useful when it changes something in your content planning. The step most brands skip is the translation from “here is who follows us” to “here is what we should make differently.”
Building Audience Segments from Insights Data
Start by identifying your two or three largest distinct audience segments from the age, gender, and location breakdowns. Give each segment a working label that describes its likely relationship to your business. For example, a Belfast-based professional services firm might identify “25-34 female, Belfast and Dublin, weekday active” as one segment and “35-44 male, rest of UK, weekend active” as another.
Once you have labelled segments, go back to your last 30 days of post performance and filter by content type. Check whether posts with the highest Save and Share rates, rather than just likes, skew toward content that appeals to one segment more than another. Saves and shares are the highest-intent signals in Instagram’s engagement hierarchy because they represent deliberate, intentional actions rather than passive scrolling behaviour.
“The accounts that grow sustainably on Instagram are the ones where the team genuinely understands who is saving their content and why,” says Ciaran Connolly, founder of ProfileTree. “Real figures are easy to chase. Save rates tell you whether you are actually building an audience that trusts you.”
The Creative Brief Adjustment Process
Once you know which content type is earning the highest Save rate from your priority segment, the next step is to brief your creative team on the specific format signals. A high Save rate on carousel posts explaining a process means your audience wants reference content they can return to. A high Share rate on short Reels means they are sharing for social currency, which suggests more entertaining or surprising content will extend your reach through their networks.
The table below maps common Insights patterns to creative brief adjustments.
| Observed Signal | Likely Audience Behaviour | Creative Brief Adjustment |
|---|---|---|
| High Saves / Low Shares | Audience keeps content for personal reference | More step-by-step carousels, checklists, how-to formats |
| High Shares / Low Saves | Audience shares for social expression | More opinion-led, surprising, or entertaining short-form video |
| High Reach / Low Engagement | More step-by-step carousels, checklists, and how-to formats | Narrow the topic focus; appeal to a smaller, more specific audience |
| High Comments / Low Reach | Strong community response within existing followers | Prioritise community management; use Stories polls to sustain conversation |
| High Profile Visits / Low Follow Rate | Visitors are evaluating but not committing | Strengthen bio and pinned content; make sure the grid communicates a clear value proposition |
Using Story Insights for Audience Segmentation
Stories provide a second, faster-moving data layer that complements your grid analytics. The key metrics to track in Stories are Taps Forward (the viewer moved on quickly), Taps Back (they wanted to re-read or re-watch), and Exits (they left the Stories queue entirely).
A high Taps Back rate on a specific Story frame is a signal worth paying attention to: the audience found something worth revisiting. If you identify a consistent pattern across several Stories, the content in those frames is a candidate for expansion into a full post or carousel. If a specific Story topic consistently produces high Exits, that topic is breaking audience interest, regardless of how important you believe it is strategically.
For brands that run regular polls and question stickers in Stories, the response patterns also reveal audience priorities. Responses to “What would you find most useful?” or “Which of these challenges applies to you?” provide qualitative audience data that demographic breakdowns cannot.
Manual Competitor Research Using Instagram’s Native Tools
Third-party social analytics platforms can cost several hundred pounds per month. For most SMEs, the manual approach using Instagram’s own features provides sufficient intelligence for strategic decisions without the overhead.
What You Can and Cannot See Without Tools
Instagram does not give you access to a competitor’s Insights dashboard. What you can observe publicly includes their posting frequency, content mix, engagement volumes, comment sentiment, hashtag strategy, and Reel performance through the public view count that appears on video content.
View counts on Reels are visible to anyone and provide a meaningful signal of content reach. A competitor’s Reel with 40,000 views on an account with 5,000 followers has achieved significant distribution beyond its own audience, which tells you the topic or format has a broader appeal than its follower count would suggest.
For context on how Reels mechanics affect organic reach and what view counts signal about algorithm behaviour, the guide on why Instagram Reels matter for marketing strategy explains the distribution logic in detail.
Building a Manual Monitoring System
Select three to five competitors and visit their profiles at a consistent interval, either weekly or fortnightly. Record the following in a simple spreadsheet for each visit: number of posts published since last visit, average visible engagement (likes plus visible comments) on the most recent five posts, content formats used (carousel, Reel, static image, Story highlight update), and any recurring themes or topics.
Over two to three months, patterns emerge without any paid tool. You will see which content formats your competitors are increasing or decreasing, which topics generate the highest engagement, and whether their posting frequency is consistent or erratic. Erratic posting schedules often indicate internal resource constraints, which may be an opportunity to fill a content gap they are leaving open.
The free social media analytics tools that complement native Instagram data can extend this process further, particularly for tracking share of voice and cross-platform presence, without requiring a significant budget commitment.
Reading Comment Sections as Competitive Intelligence
Competitor comment sections are often the most underused source of competitive intelligence available. Read the comments on their five to ten highest-engagement posts from the past 90 days. Look specifically for: questions the audience is asking that the content did not answer, complaints or frustrations that appear more than once, and the language patterns used by commenters to describe their problems.
Recurring questions in competitor comments indicate content gaps. If the same question keeps appearing on a competitor’s posts and neither they nor anyone else is answering it well, that question is a content brief. Write the post, carousel, or Reel that answers it properly, and you are filling a demonstrated audience need rather than guessing.
This approach connects directly to broader social media marketing and sales strategy, where audience language patterns inform not just content but positioning, messaging, and product development.
Evaluating Influencers Through Instagram Insights
Influencer partnerships are one of the more common ways SMEs in Northern Ireland and across the UK extend their reach on Instagram. The evaluation process before committing to a collaboration determines most of the value you will get from it.
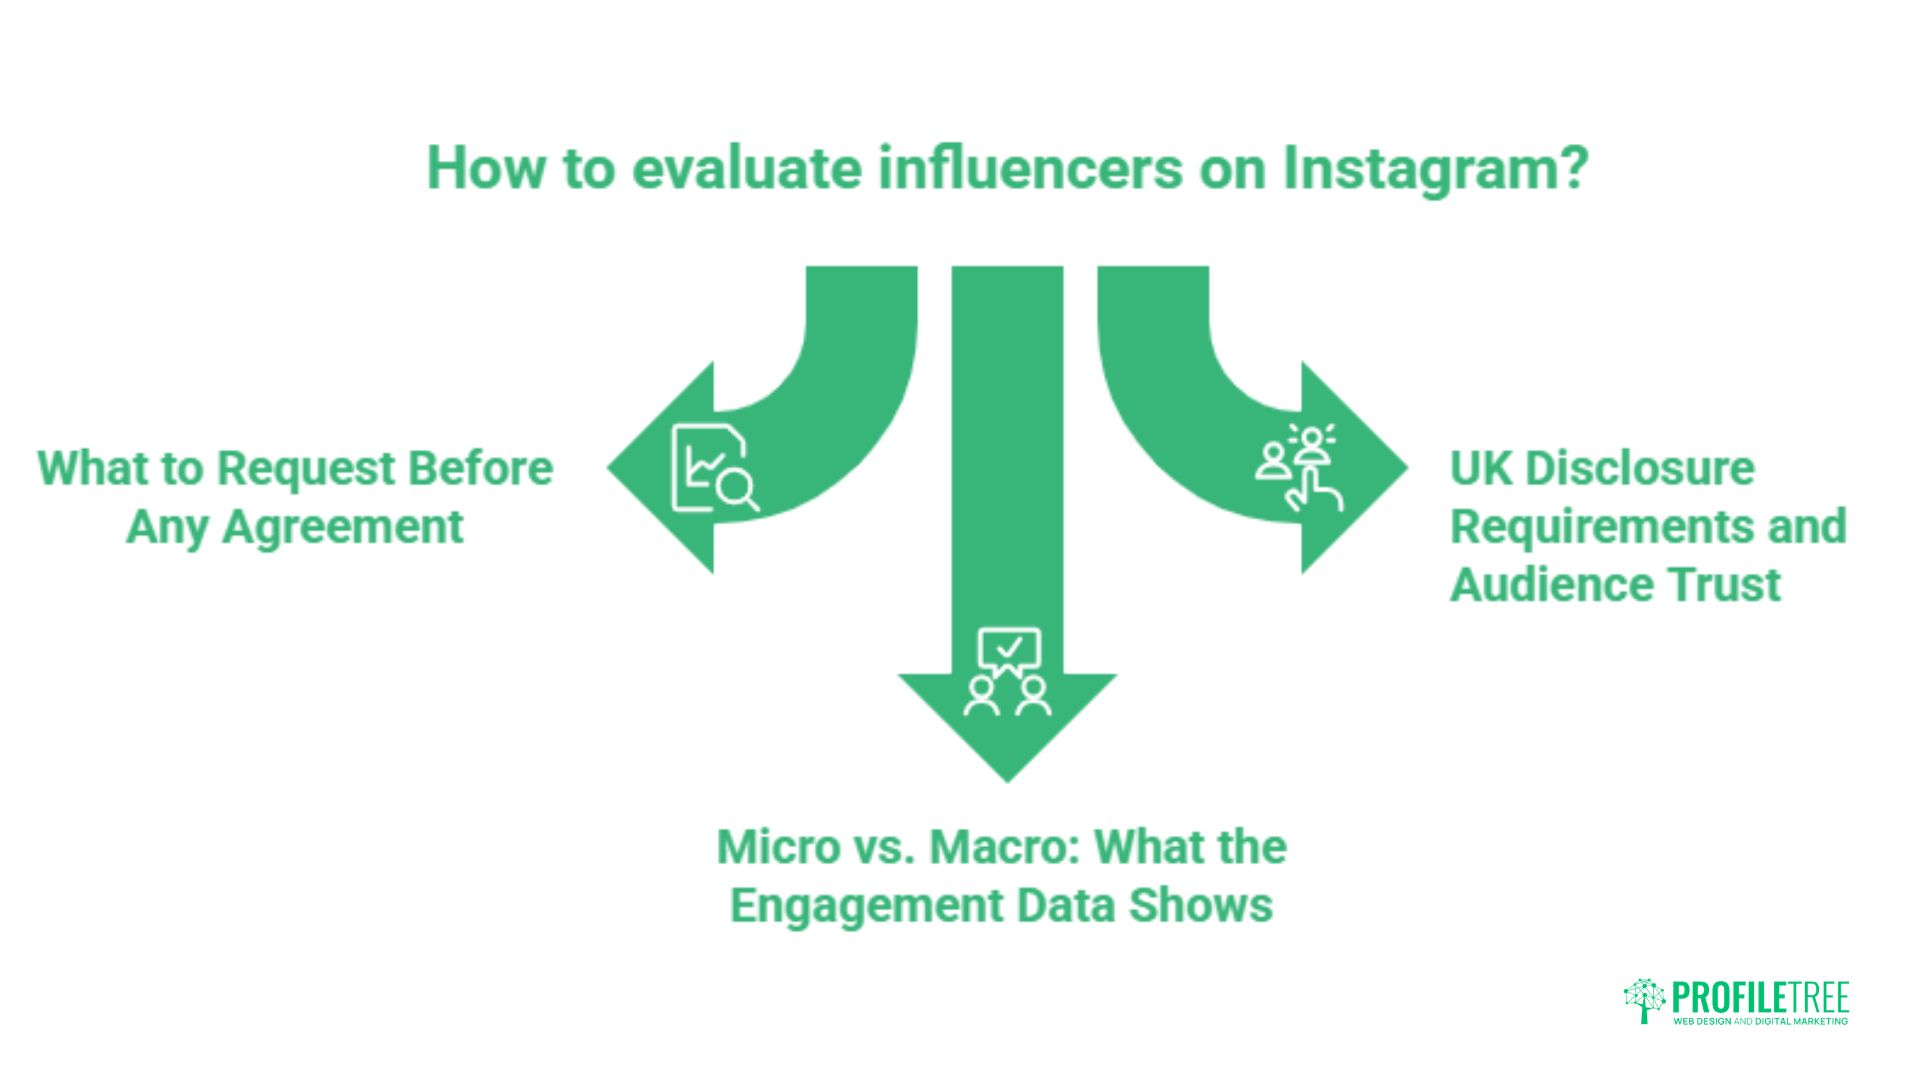
What to Request Before Any Agreement
Before agreeing to terms with any influencer, request a screenshot of their Audience Insights dashboard showing follower demographics and active times, along with post-level engagement data for their last five to ten sponsored posts. Any credible influencer will share this willingly; hesitation to provide it is a meaningful signal in itself.
The demographics screenshot tells you whether their audience matches yours. An influencer with 50,000 followers, where 70% are based in the United States, provides limited value for a Northern Ireland-focused business, regardless of how impressive the total follower count looks. Location and age alignment with your target audience matter more than raw follower volume.
The sponsored post engagement data tells you how their audience responds when they are being paid to promote something. Engagement typically drops on sponsored content compared to organic posts; a drop of 20-30% is normal. A drop of 70-80% suggests the audience has learned to disengage from promotional content on that account, which means your campaign will likely underperform.
Micro vs. Macro: What the Engagement Data Shows
Engagement rate tends to decline as follower count grows. An influencer with 5,000 genuinely engaged followers in your specific sector will often outperform one with 100,000 broadly distributed followers for a targeted campaign. The micro and macro influencer comparison goes into this in detail, but the core principle is that engagement rate and audience specificity matter more than scale for most SME campaigns.
Calculate engagement rate manually: add together likes, comments, and saves on the last ten organic posts, divide by ten, then divide that average by the follower count and multiply by 100. For accounts under 10,000 followers, a rate above 5% is strong. For accounts between 10,000 and 50,000, 3-5% is healthy. Above 50,000 followers, 1.5-3% is typical for well-run accounts.
Be alert to accounts with high likes but sparse or generic comments. Purchased engagement shows up most clearly in comment quality: generic one or two-word comments, comments in languages that do not match the apparent audience location, and rapid-fire comments posted within minutes of publishing are all indicators that engagement figures cannot be taken at face value.
UK Disclosure Requirements and Audience Trust
Under the ASA (Advertising Standards Authority) CAP Code, any paid or gifted partnership must be disclosed clearly and upfront using labels such as “Ad” or “Paid Partnership.” Instagram’s native Paid Partnership label in the post header satisfies this requirement for most content, but Stories with commercial intent require an explicit verbal or on-screen disclosure within the first few seconds.
One concern brands often raise is whether mandatory disclosure harms campaign reach. Instagram’s own transparency data and the broader body of UK influencer marketing research suggest that disclosure does not significantly reduce engagement when the influencer has genuine audience trust. It is worth tracking this specifically: ask your influencer partner to share engagement metrics from their disclosed sponsored posts versus organic content over the same period, so you have actual evidence rather than an assumption.
For businesses wanting to build their own Instagram presence alongside influencer activity, ProfileTree’s social media marketing services cover both organic strategy and paid partnership management for SMEs across Northern Ireland, Ireland, and the UK.
Exporting Data and Working With It Outside the App
Instagram’s in-app Insights view is limited to 90 days of data. For trend analysis beyond that window, you need to export data and store it externally, either in a spreadsheet or via Meta Business Suite’s export function.
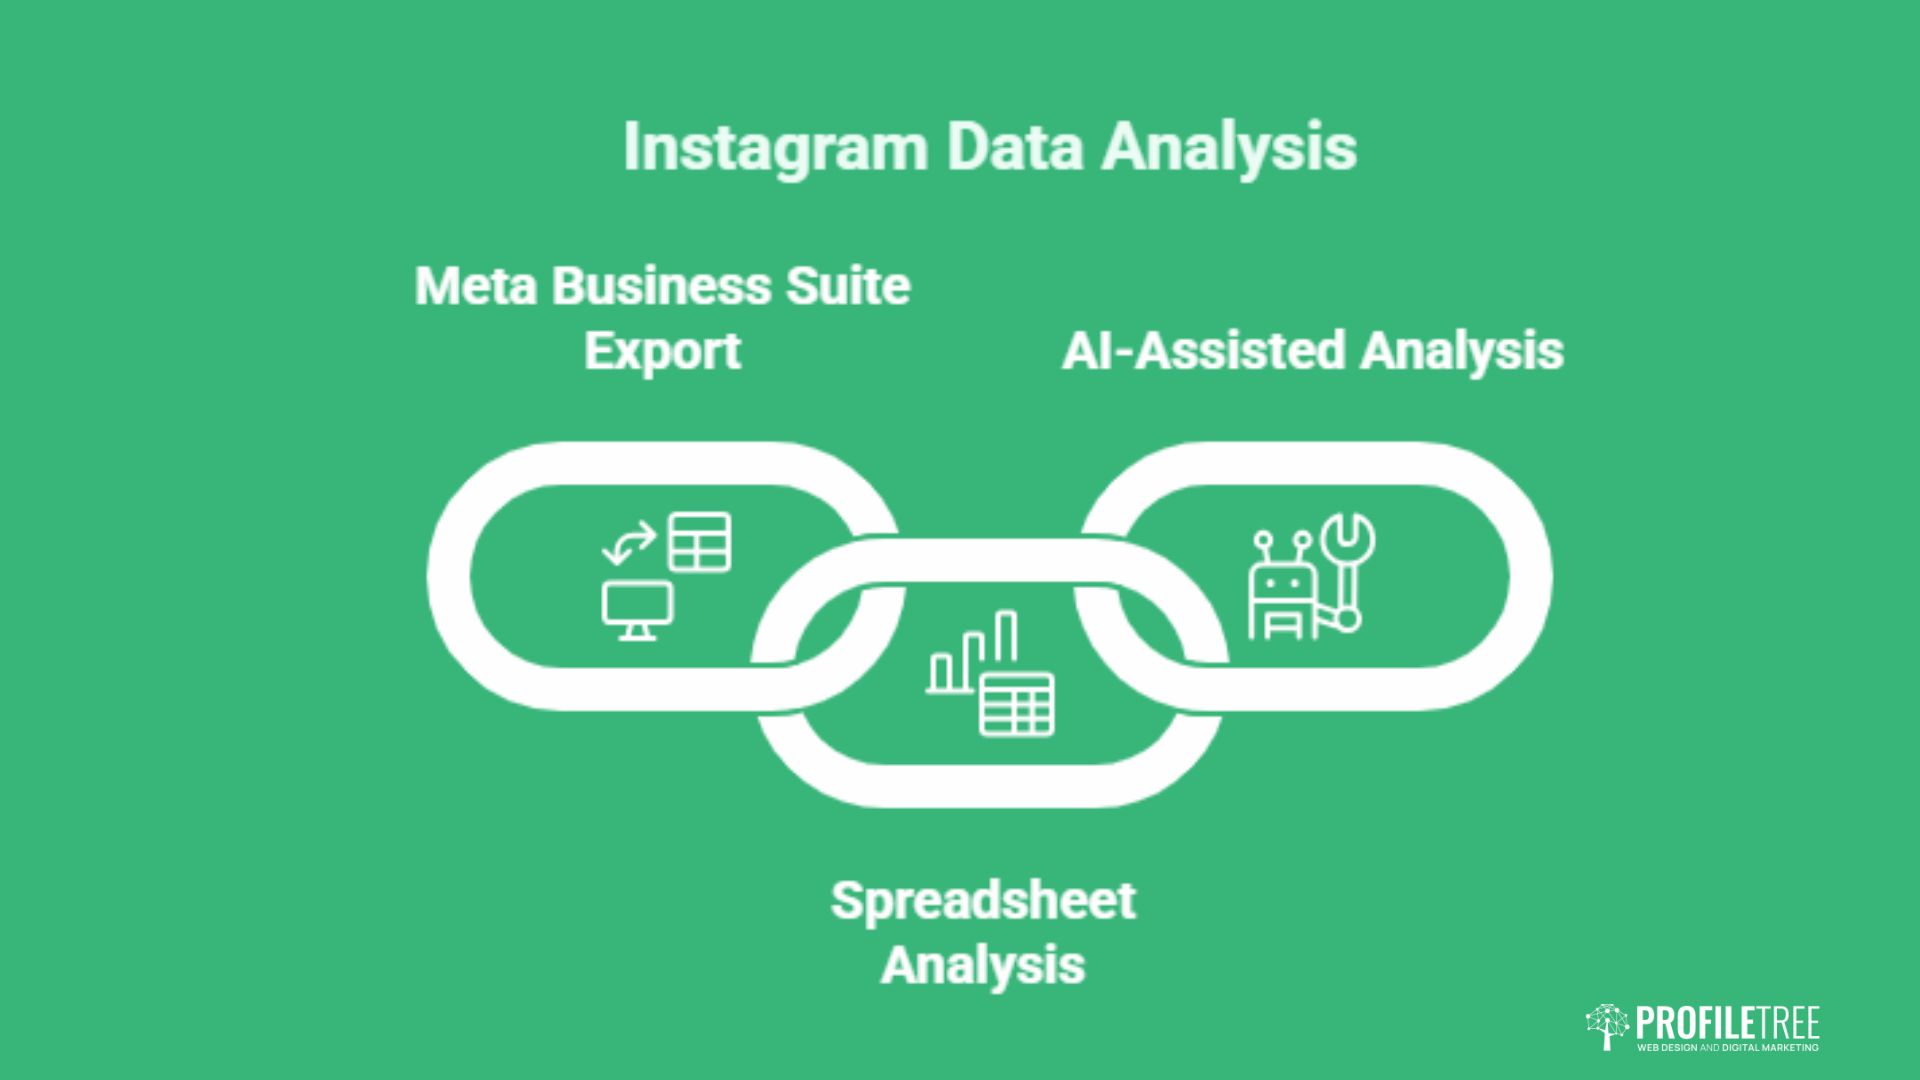
The Meta Business Suite Export Process
Meta Business Suite (business.facebook.com) offers a more comprehensive data export than the Instagram app. In the Insights section, select the date range you want (up to 90 days per export), choose the metrics you need, and download the results as a CSV file. Running this export monthly and storing the files lets you build a continuously updated dataset that extends back as far as you need.
The most useful metrics to export regularly are: Reach and Impressions by post, Saves and Shares by post, Profile Visits, Website Clicks (if you have a link in bio), and Follower count at the end of the period. With 12 months of monthly exports, you can calculate year-on-year trends that the app view cannot show you.
Using Spreadsheets for Pattern Recognition
Once you have three or more months of export data in a spreadsheet, simple pivot tables will surface patterns that are invisible in the app. Sort posts by Save rate rather than by total likes, and you will typically find that the content type with the highest average Save rate is different from the content that got the most likes. That gap is where your content brief should shift.
Month-on-month follower count changes, tracked in a simple line chart, show whether growth is accelerating or plateauing more clearly than the in-app view. Correlating follower growth rate with content publishing frequency in the same period shows whether posting cadence is a meaningful variable for your specific account, which it often is, though the relationship varies significantly by account and sector.
AI-Assisted Analysis of Exported CSV Data
Exported Instagram CSV data can be analysed using large language models to identify patterns that would take hours to find manually. Paste a month’s worth of post-level data into a chat interface and ask the model to identify which content categories have the highest Save rate, which posting days correlate with above-average reach, or whether there is a relationship between caption length and comment volume.
This is not a replacement for strategic judgement, but it is a legitimate time-saving step for marketing managers who manage Instagram alongside a wider set of responsibilities. The output is most useful as a prompt for testing hypotheses, rather than as definitive conclusions to act on without further validation.
For businesses that want to go further with data-led digital strategy across channels, ProfileTree’s digital marketing services include analytics support and performance reporting for growing businesses across the UK and Ireland.
Northern Ireland businesses exploring digital opportunities can also find a broader context in the Connolly Cove guide to Northern Ireland’s cities, which illustrates the regional economic and cultural context that shapes local audience behaviour.
Conclusion
Instagram Insights is most valuable when it moves beyond vanity metrics. Audience demographic gaps, competitor comment intelligence, influencer engagement verification, and exported trend data are all available without a paid analytics tool. The businesses that use these data points to make deliberate decisions about content format, audience targeting, and partnership selection tend to see compounding returns over time. If you want support building a data-led Instagram strategy for your business, speak to ProfileTree’s social media team.
FAQs
Why can’t I see Instagram Insights on my personal account?
Instagram Insights is only available to Business and Creator accounts. Switch your account type in Settings under Account. The process takes less than a minute and does not affect your existing content or followers. Once switched, Insights data begins accumulating immediately, though historical data from before the switch is not available.
How far back does Instagram Insights data go in the app?
The Instagram app shows data for up to 90 days. If you need data beyond that window, you must export it via Meta Business Suite before the 90-day period expires. Setting a monthly export reminder is the simplest way to build a longer-term dataset without losing historical performance records.
What is a good engagement rate for UK brands on Instagram?
Benchmarks vary by follower count and sector. For accounts with fewer than 10,000 followers, an engagement rate of 4-5% is strong. For accounts between 10,000 and 50,000 followers, 2-4% is healthy. Above 50,000 followers, 1.5-2.5% is typical for well-run accounts. B2B accounts generally see lower rates than B2C consumer brands, but follower quality and relevance matter more than the rate itself for commercial outcomes.
How can I see competitor Instagram Insights without paying for a tool?
You cannot access a competitor’s private Insights dashboard. What you can observe publicly includes Reel view counts, visible engagement on posts, content frequency, comment sentiment, and hashtag usage. A consistent manual audit tracked in a spreadsheet provides sufficient competitive intelligence for most strategic decisions without any paid tool.
Does using the Paid Partnership label on Instagram reduce engagement?
Research and platform data suggest that disclosure does not significantly reduce engagement when the influencer has genuine audience trust. A drop of 20-30% on sponsored versus organic content is normal and expected. Drops significantly beyond that range indicate an audience that has disengaged from promotional content on that account, which is a meaningful signal when evaluating influencer partners.