
Small Business Statistics UK: Figures, Facts and Trends
Table of Contents
The UK is home to around 5.5 million small businesses. They account for 99.9% of the entire private sector business population, employ nearly half the private sector workforce, and generate over £2 trillion in annual turnover. Those numbers are striking on their own. But what they don’t tell you is why so many of these businesses struggle to grow, why thousands close in their first five years, and what separates the ones that scale from the ones that stall.
This guide pulls together the most current UK small business statistics from the ONS, the Federation of Small Businesses, and other primary sources. It covers market size, survival and failure rates, sector breakdowns, digital adoption trends, and the regional picture for Northern Ireland and Ireland. If you’re researching a business plan, assessing your own position, or simply trying to understand the landscape, the data here provides a starting point grounded in real figures.
The UK Small Business Landscape: Key Numbers
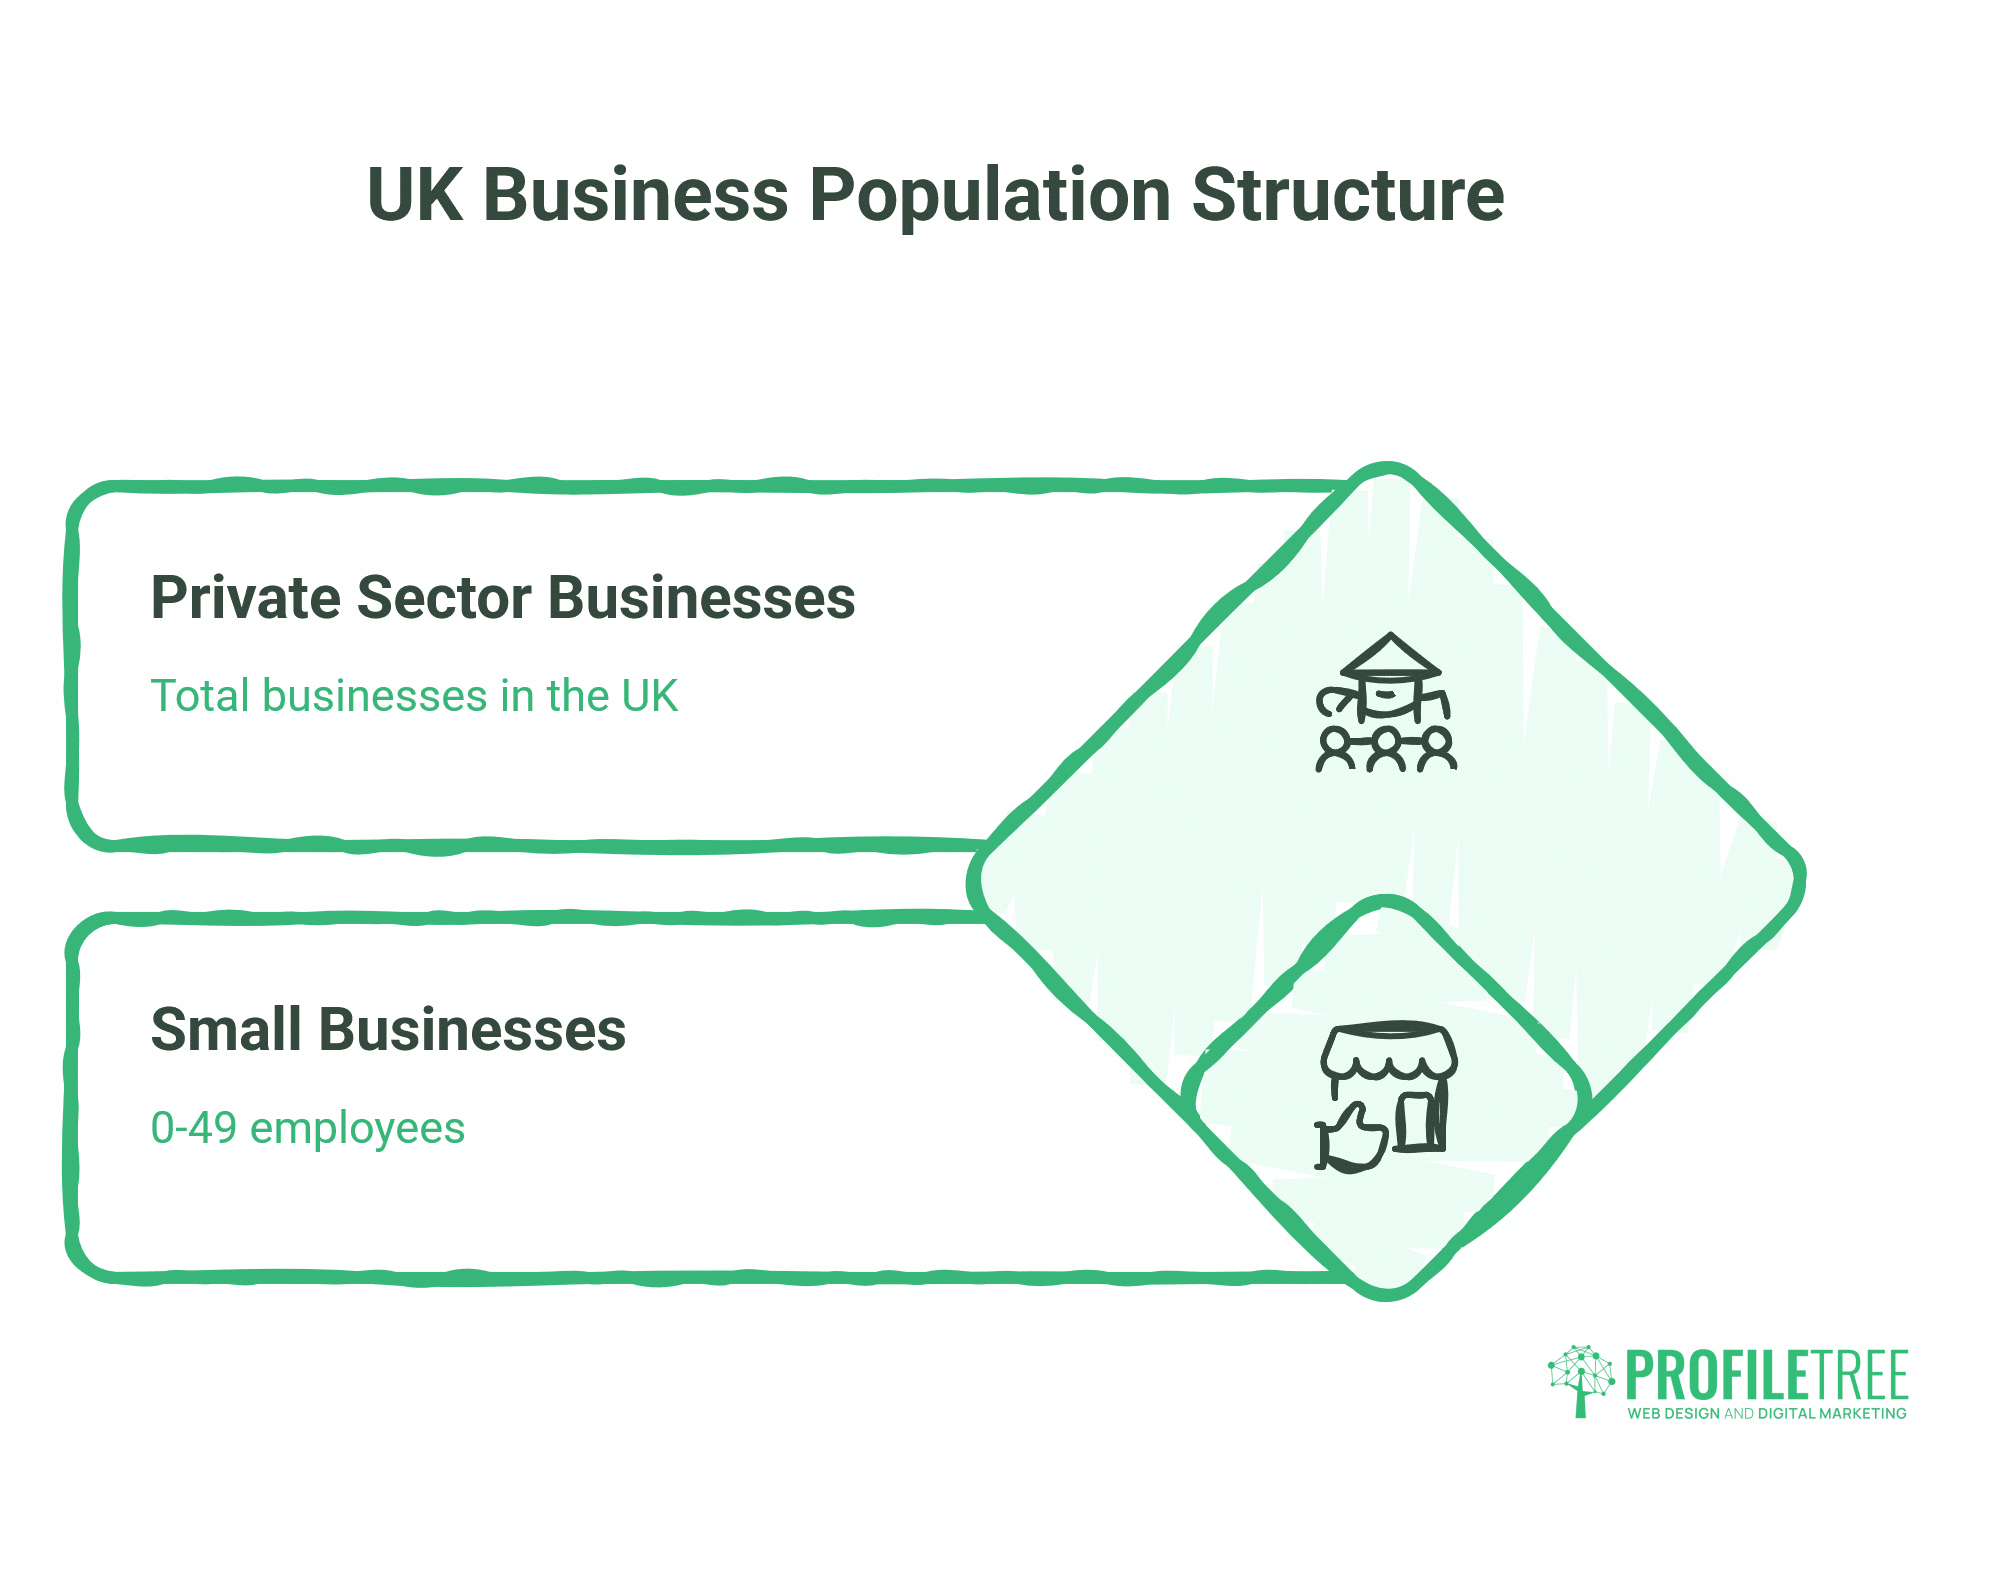
The Department for Business and Trade’s Business Population Estimates remain the most cited source for headline SME figures. The most recent data puts the UK private sector business count at approximately 5.5 million, of which 5.51 million are classed as small businesses (0 to 49 employees).
| Business Type | Number | % of Total Businesses | Employment | Turnover |
|---|---|---|---|---|
| All SMEs | ~5.5 million | 99.9% | 61% of private sector | ~£2.4 trillion (53%) |
| Small (0–49 employees) | ~5.51 million | 99.2% | ~13 million (48%) | ~£1.6 trillion (36%) |
| Medium (50–249 employees) | ~36,900 | 0.7% | ~3.6 million (13%) | ~£0.8 trillion (17%) |
| Large (250+ employees) | ~7,700 | 0.1% | 39% | 47% |
Source: Department for Business and Trade, Business Population Estimates. Figures are approximate and subject to annual revision.
The dominance of micro businesses within this total is worth noting. Sole traders and businesses with no employees make up approximately 74% of all UK SMEs. These are the businesses most exposed to cost pressures, most dependent on the owner’s own capacity, and most likely to either stagnate or close if conditions deteriorate.
UK Small Business Survival and Failure Rates
Business survival statistics are among the most searched-for data points in this space, and among the most frequently misquoted. The ONS publishes annual business demography figures that show survival rates by business age.
The broadly accepted picture for the UK looks like this:
| Business Age | Approximate Survival Rate |
|---|---|
| 1 year | ~91–93% |
| 3 years | ~60–65% |
| 5 years | ~42–47% |
| 10 years | ~30–35% |
Source: ONS Business Demography, UK. Rates vary year on year and by sector.
Roughly half of UK small businesses do not reach their fifth year. That is not a reason for pessimism; it reflects the natural churn of a market where many businesses are started speculatively, or where owners exit by choice rather than failure. But the data does point to genuine risk concentrations, particularly in the first two to three years.
The reasons businesses fail are reasonably consistent across multiple studies. Cash flow problems are cited most often, followed by weak demand, owner burnout, and inability to compete digitally. The Federation of Small Businesses and Insolvency Service data both point to undercapitalisation and poor financial planning as the leading structural causes.
For a more detailed breakdown of the data behind these figures, the analysis in ProfileTree’s guide to small business failure rates in the UK covers survival statistics by sector and business age.
The Northern Ireland and Ireland Picture
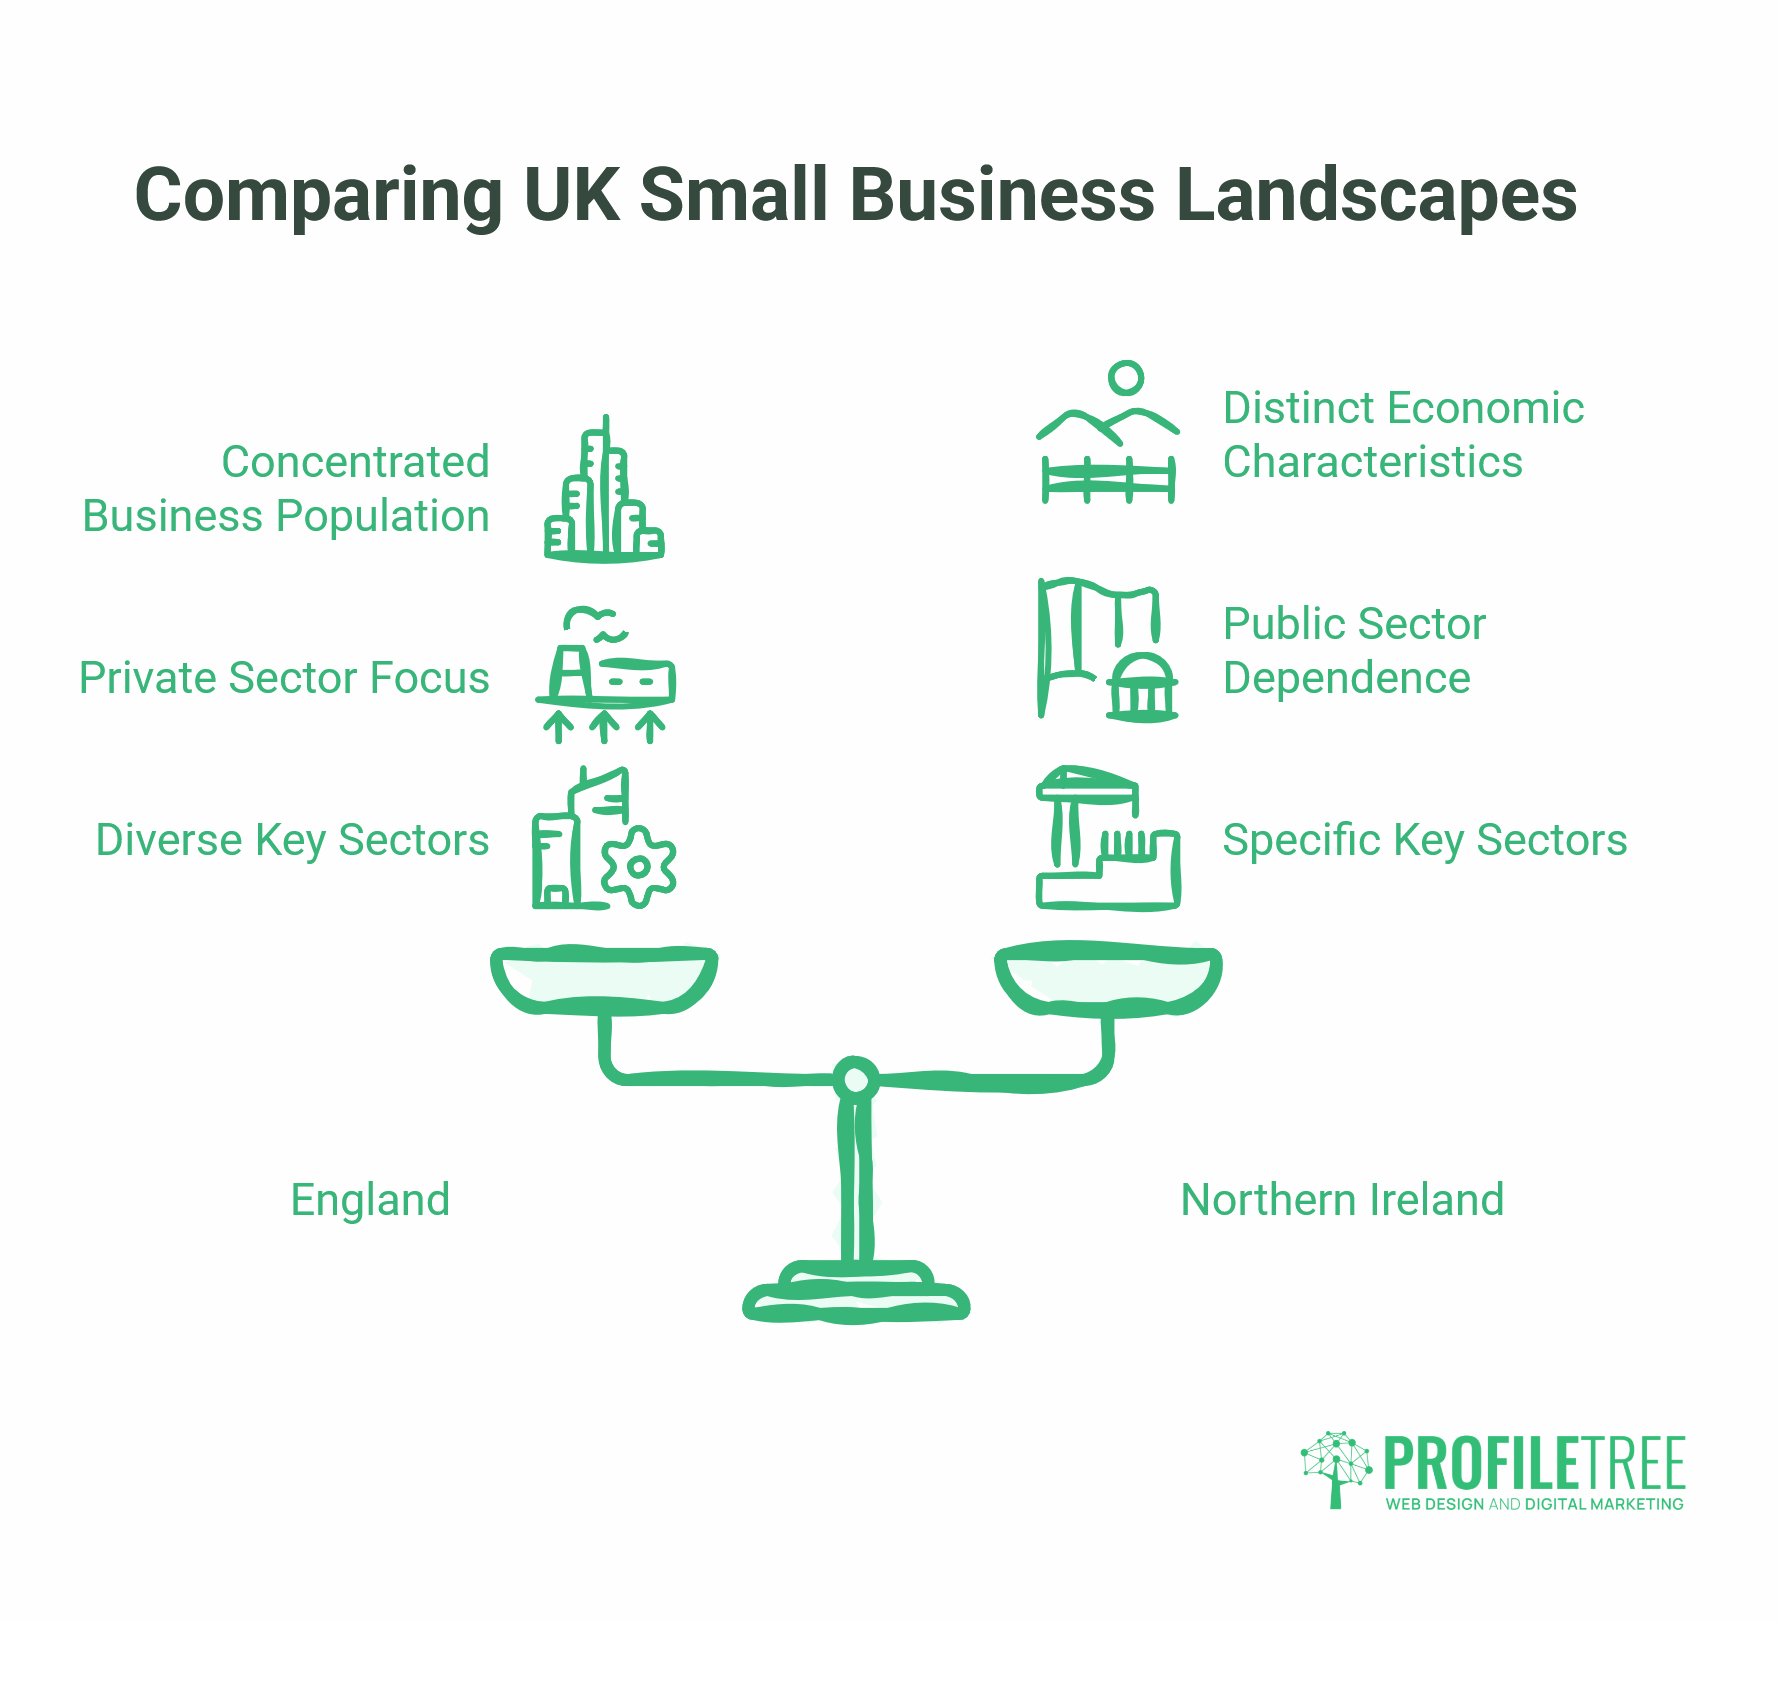
Most aggregated statistics for UK small businesses focus on England, where the business population is concentrated. Northern Ireland and the Republic of Ireland have distinct economic characteristics that warrant separate treatment.
Northern Ireland
The ONS and Invest Northern Ireland both publish figures for the NI business population. Northern Ireland has approximately 122,000 registered businesses, of which the vast majority are SMEs. The economy is more dependent on public sector employment than the UK average, which means private-sector SMEs face a different competitive and talent environment.
Key sectors for NI SMEs include construction, professional and technical services, retail, and hospitality. Cross-border trade with the Republic of Ireland remains significant, and post-Brexit trading arrangements have created additional compliance considerations for businesses moving goods across the border.
Republic of Ireland
The Central Statistics Office (CSO) reports approximately 250,000 active enterprises in Ireland, with SMEs (defined as having fewer than 250 employees) accounting for over 99% of that total. Irish SMEs employ around 68% of the private sector workforce and contribute roughly 50% of turnover. The Irish economy has shown strong growth over recent years, though concentration in multinational-dominated sectors means SME performance is not always reflected in headline GDP figures.
For businesses operating across both jurisdictions, digital infrastructure matters differently. Internet penetration, digital payment adoption, and online consumer behaviour are broadly similar on both sides of the border, but regulatory frameworks and tax treatment differ, affecting how businesses structure their digital operations.
Small Business Failure: The Root Causes Behind the Statistics
The survival rates above describe what happens; they don’t fully explain why. The data on failure causes gives a clearer operational picture.
Cash flow is consistently the single most cited cause of business failure. A CB Insights analysis of business failures found that cash flow problems or capital shortages were cited in over 38% of cases. UK-specific research from the FSB and Experian corroborates this pattern: many businesses that close are technically profitable on paper but unable to manage the timing gap between invoicing and payment.
Market demand misalignment is the second major factor. Businesses that launch products or services without adequate validation, or that fail to adapt as consumer behaviour shifts, account for a substantial share of early-stage closures.
Digital visibility and competition have grown as a cause over the past five years. Small businesses in sectors such as retail, hospitality, and professional services increasingly compete for customers through search results, social media, and other online platforms. Businesses that cannot be found online lose ground to competitors that can.
“We work with SMEs across Northern Ireland and the UK who often have strong products and real expertise, but struggle to translate that into online visibility,” says Ciaran Connolly, founder of ProfileTree. “The gap between a business that ranks on page one and one that sits on page five isn’t always about quality; it’s frequently about how well the digital foundations are set up.”
The connection between digital presence and business survival is not coincidental. Understanding how statistics inform business decision-making helps owners spot the specific gaps worth addressing rather than making broad assumptions.
Sector Breakdown: Where UK Small Businesses Operate
The UK small business population is not evenly distributed across sectors. Department for Business and Trade data shows a clear concentration in a handful of industries.
| Sector | Share of UK Small Businesses |
|---|---|
| Construction | ~16% |
| Professional, scientific and technical | ~14% |
| Wholesale and retail trade | ~10% |
| Health and social work | ~8% |
| Administrative and support services | ~8% |
Construction leads primarily because of the high volume of sole traders and micro firms operating as subcontractors. Professional and technical services are the second largest category and include a wide range of consultancy, legal, accountancy, and specialist advisory businesses.
The distribution matters for benchmarking. A professional services firm with five employees and £300,000 in annual turnover sits in a very different competitive position to a construction subcontractor of similar size. Sector-specific benchmarks from trade bodies and industry associations provide more useful reference points than national averages.
For businesses interested in how UK business data is compiled and used more broadly, the analysis in global business statistics provides useful comparative context.
Digital Adoption Statistics: The Growing Gap
Digital adoption among UK SMEs has accelerated since 2020, but the data consistently shows a significant gap between larger businesses and micro firms. The DCMS and Lloyds Bank UK Business Digital Index both publish annual data on digital maturity across the business population.
Key findings from recent editions include:
- Approximately 1 in 5 UK small businesses has no meaningful online presence beyond a basic listing
- Fewer than half of small businesses have a website they actively maintain
- E-commerce adoption remains low outside retail and hospitality, despite clear consumer demand for online purchasing and booking options
- Digital skills remain a persistent challenge: around 22% of small business owners reported difficulty finding staff with adequate digital skills (FSB)
These gaps have commercial consequences. Businesses with a well-maintained website, active local search presence, and regular content publication attract more enquiries, convert at higher rates, and build a more defensible position against larger competitors.
The shift towards AI tools is beginning to show in the data, too. Adoption of AI among UK SMEs is growing, but usage tends to cluster in customer-facing automation (chatbots, email marketing tools) rather than in operational or strategic applications. The cost-benefit analysis of AI implementation in SMEs breaks down where the return on investment is strongest for smaller businesses.
For SMEs that have successfully adopted AI, the results are instructive. A growing body of evidence from organisations, including McKinsey and the ONS, shows that businesses that integrate AI tools into routine processes report measurable improvements in output per employee. The challenge for most small businesses is knowing where to start without over-investing in tools that don’t match their current scale.
The Digital Skills Gap and What It Costs SMEs
The skills gap in UK small businesses is not limited to technical roles. Digital skills across marketing, data analysis, content production, and customer communication represent a critical capability that many SMEs lack in-house.
The Federation of Small Businesses reported in 2023 that 22% of small business owners struggled to fill vacancies, with technology and digital roles among the hardest to recruit for. The broader picture, from organisations such as the Learning and Work Institute, suggests that digital skills shortages cost UK businesses billions of pounds annually in lost productivity and missed commercial opportunities.
For many small businesses, the most practical response is not to hire but to upskill. Structured digital training programmes allow business owners and their existing teams to build the capabilities they need without committing to the cost of a specialist hire. ProfileTree’s digital training services are designed specifically for SME owners and teams who need to develop these skills practically rather than theoretically.
Regional Distribution: Where Small Businesses Cluster
Business concentration in the UK follows broadly predictable patterns, with London and the South East accounting for a disproportionate share of the total business population.
| Region | Approximate Number of Businesses |
|---|---|
| London and South East | ~1.89 million (34%) |
| Scotland | ~298,000 |
| Wales | ~219,000 |
| North East England | ~156,000 |
| Northern Ireland | ~122,000 |
The London weighting reflects the concentration of financial, professional, and technology businesses in the capital. Outside London, regional economies show quite different sector profiles. Scotland’s business population is heavily weighted towards agriculture, energy, and tourism alongside professional services. Northern Ireland’s small business community is more evenly spread across construction, retail, hospitality, and professional services, with cross-border trade playing a larger role than in any other UK region.
Regional concentration also affects digital competition. A small business in Belfast competing for local customers faces a different organic search landscape than an equivalent business in central London. Local SEO, Google Business Profile optimisation, and regionally targeted content all behave differently at different levels of market density.
Business Finance and Funding: What the Numbers Show
Access to finance remains a structural challenge for UK SMEs. The British Business Bank’s Small Business Finance Markets report is the most comprehensive annual dataset on this topic.
Key data points from recent reports:
- The majority of small businesses that seek external finance do so for working capital rather than growth investment
- Bank lending to SMEs has remained broadly flat in real terms, with alternative lenders (fintechs, peer-to-peer platforms, invoice finance providers) growing their market share
- Around 36% of small business finance applications are rejected by traditional high street banks
- Government-backed schemes, including Start-Up Loans and the Growth Guarantee Scheme, provide an important alternative route for businesses that cannot access conventional lending
For a detailed breakdown of the current lending landscape, the small business loan statistics guide covers approval rates, average loan sizes, and the distribution of lending across sectors and regions.
Government Support Schemes for UK SMEs
The UK government runs a range of support programmes for small businesses, though awareness and take-up remain patchy. The most relevant active schemes include:
Start-Up Loans: Government-backed personal loans for new businesses, typically between £500 and £25,000, with a fixed interest rate and free mentoring support.
Growth Guarantee Scheme: Successor to the Recovery Loan Scheme, providing lender guarantees on SME borrowing to improve access to finance for viable businesses that cannot meet standard lending criteria.
Innovate UK grants: Funding for research and development activity, available to SMEs in qualifying sectors and technology categories.
Help to Grow: Management: Subsidised leadership development programme for senior people in SMEs, delivered through business schools.
Invest Northern Ireland: Invest NI provides a range of funding, advisory, and market development support specifically for Northern Ireland businesses, with programmes covering export development, skills, and digital capability.
Availability and eligibility criteria for all schemes change regularly. The GOV.UK Business Finance and Support Finder is the most reliable source for current programme details.
Key Trends Shaping UK Small Businesses
The statistics above describe where things stand. A handful of trends point to where they’re heading.
Digital adoption will continue to separate growing businesses from static ones. The gap between SMEs with a strong online presence and those without is already visible in the data; over the next 12 months, that gap is likely to widen as consumer expectations around online discovery, booking, and purchasing continue to rise.
AI tool adoption among small businesses will accelerate, but unevenly. Businesses with existing digital skills will find it straightforward to add AI to their workflows. Those without those foundations will struggle to assess what’s worth adopting and what isn’t. The practical implication is that digital skills investment now has a compounding return: it determines not just current capability but future capacity to adopt new tools.
Cost pressures are unlikely to ease significantly in the near term. Energy costs, wage growth, and ongoing supply chain adjustments mean that margin management remains a priority for most SMEs. Businesses that have reduced reliance on manual processes and improved their marketing efficiency through digital channels are better positioned to absorb these pressures without cutting capacity.
For Northern Ireland specifically, the cross-border trading environment and the economy’s reliance on public-sector activity create distinct conditions. Private sector SMEs here face a tighter talent pool and a more complex regulatory backdrop than equivalent businesses in Great Britain, which makes strategic investment in digital capability more, not less, important.
Conclusion
Understanding what the statistics mean for your own business is more useful than the numbers in isolation. The UK’s 5.5 million small businesses face genuine pressures — cash flow, digital competition, skills shortages — but the data also shows where the growth opportunities sit. Businesses that build a visible online presence, close their digital skills gaps, and make informed decisions from reliable data consistently outperform those that don’t. If you want to talk through how digital strategy affects small business growth, the ProfileTree team works with SMEs across Northern Ireland, Ireland, and the UK to turn that intent into measurable results.
FAQs
What percentage of small businesses fail in the first five years in the UK?
ONS business demography data suggests that approximately 53-58% of UK businesses do not survive to their fifth year, though this varies considerably by sector. Construction and hospitality show higher attrition rates; professional and technical services tend to show better survival rates.
How many small businesses are there in the UK?
The Department for Business and Trade estimates that there are approximately 5.5 million businesses in the UK private sector, of which 5.51 million are classed as small (under 50 employees). This figure fluctuates annually and is measured through HMRC payroll data, VAT registrations, and survey data.
What is the number one reason small businesses fail?
Cash flow problems are the most consistently cited cause across UK and international research, including both genuine insolvency and businesses that cannot manage payment timing gaps. Weak market demand and undercapitalisation are the next most cited causes.
What is classed as a small business in the UK?
UK law defines a small business as one with fewer than 50 employees and either an annual turnover of no more than £10.2 million or a balance sheet total of no more than £5.1 million. A micro business has fewer than 10 employees.