Mobile Marketing Statistics: The SME Growth Guide for UK and Ireland
Table of Contents
Mobile now accounts for the majority of web traffic in the UK, yet a large proportion of SME websites were built for desktop-first browsing and have never been properly optimised for the devices their customers actually use. That gap between consumer behaviour and business presence is where marketing budgets get wasted, and sales get lost.
This guide brings together verified mobile marketing statistics from named primary sources, including Ofcom, the IAB UK, Statista, eMarketer, and Think with Google, and maps them to the practical decisions UK and Irish SMEs need to make about their web presence, content strategy, and local search visibility. Effective mobile marketing is no longer a separate discipline from general digital strategy; for most UK businesses, it is the majority of digital strategy. The data points to clear priorities.
The Mobile-First Reality for UK Businesses
The scale of mobile adoption in the UK still catches many business owners off guard when they review their analytics. Mobile users now make up the majority of the audience most SME websites are actually serving, whether or not the site was built with that audience in mind.
According to Ofcom data published via Statista in 2024, approximately 91% of UK adults own a smartphone. Salesforce Research data, reported by Statista, shows that in Q2 2024, smartphones accounted for 77% of retail site visits in the UK. The Ofcom Communications Market Report 2024 confirmed that average data consumption per mobile user increased 21% year on year in 2023, reaching 9.9 GB per month, reflecting how thoroughly mobile has become the primary connected device for most people.
The IAB UK H1 2024 Digital Adspend update described the “dominance of mobile spend” as one of the established trends accelerating across the UK digital advertising market. By the full-year 2024 report, the UK’s total digital ad market had reached £35.5 billion, growing 13% year on year. Mobile was described as the dominant environment for that spend.
“Mobile is where your customers are researching, comparing, and deciding,” says Ciaran Connolly, founder of ProfileTree. “A business that performs well on desktop but poorly on mobile is invisible to a significant portion of its target audience, and that invisibility has a direct cost.”
The implementation gap is the challenge most SMEs have not yet closed. Consumer behaviour shifted to mobile years ago. Business infrastructure, particularly website performance, content formatting, and local search optimisation, has been slower to follow. A coherent mobile marketing approach closes that gap by treating mobile performance, content, and search visibility as one connected system rather than three separate projects. The mobile marketing statistics in this guide show exactly where that gap is largest and what closing it looks like in practice.
Mobile Search Behaviour and Local Intent
Mobile search behaves differently to desktop search. Queries tend to be more location-specific and more likely to prompt immediate action, because mobile users are frequently searching while already out, deciding where to go next rather than researching from a desk.
According to Statista and Google data, mobile devices now account for approximately 63% of all Google search queries globally. Think with Google research shows that “near me” search queries have grown by more than 500% since 2020 and that 76% of mobile users who conduct a local search visit a business within 24 hours. For service businesses in Belfast, Dublin, Edinburgh, or any regional UK city, that pattern represents customers at the point of decision.
The mobile marketing statistics on search also reveal a significant technical threshold. Think with Google research, published in its Mobile Site Load Time Statistics, found that as page load time increases from 1 to 5 seconds, the probability of mobile users bouncing rises by 90%. Separate Think with Google research found that as load time goes from one second to ten seconds, bounce probability increases by 123%. For most SME websites, load times well above three seconds on mobile are common, particularly on sites built before 2020 without performance optimisation.
Google has incorporated Core Web Vitals into its ranking algorithm since 2021, with mobile page experience a primary signal. Research compiled at Scalify in 2026 shows that only 39% of websites currently pass all three Core Web Vitals on mobile, compared to 54% on desktop. The gap is where the ranking disadvantage concentrates.
For SMEs serving specific cities or regions, local SEO sits directly on top of these mobile search patterns. What appears when someone searches for your service category on their phone is shaped by Google Business Profile completeness, local schema markup, and the mobile performance of the pages that rank. ProfileTree’s work on local SEO for businesses addresses these three dimensions together, because fixing only one of them rarely produces a sustained result.
Mobile Commerce and Conversion Statistics
The shift to mobile as the primary shopping device is one of the most consequential changes in UK retail, and it means mobile users are now the default audience for any business selling online, not a secondary segment to accommodate.
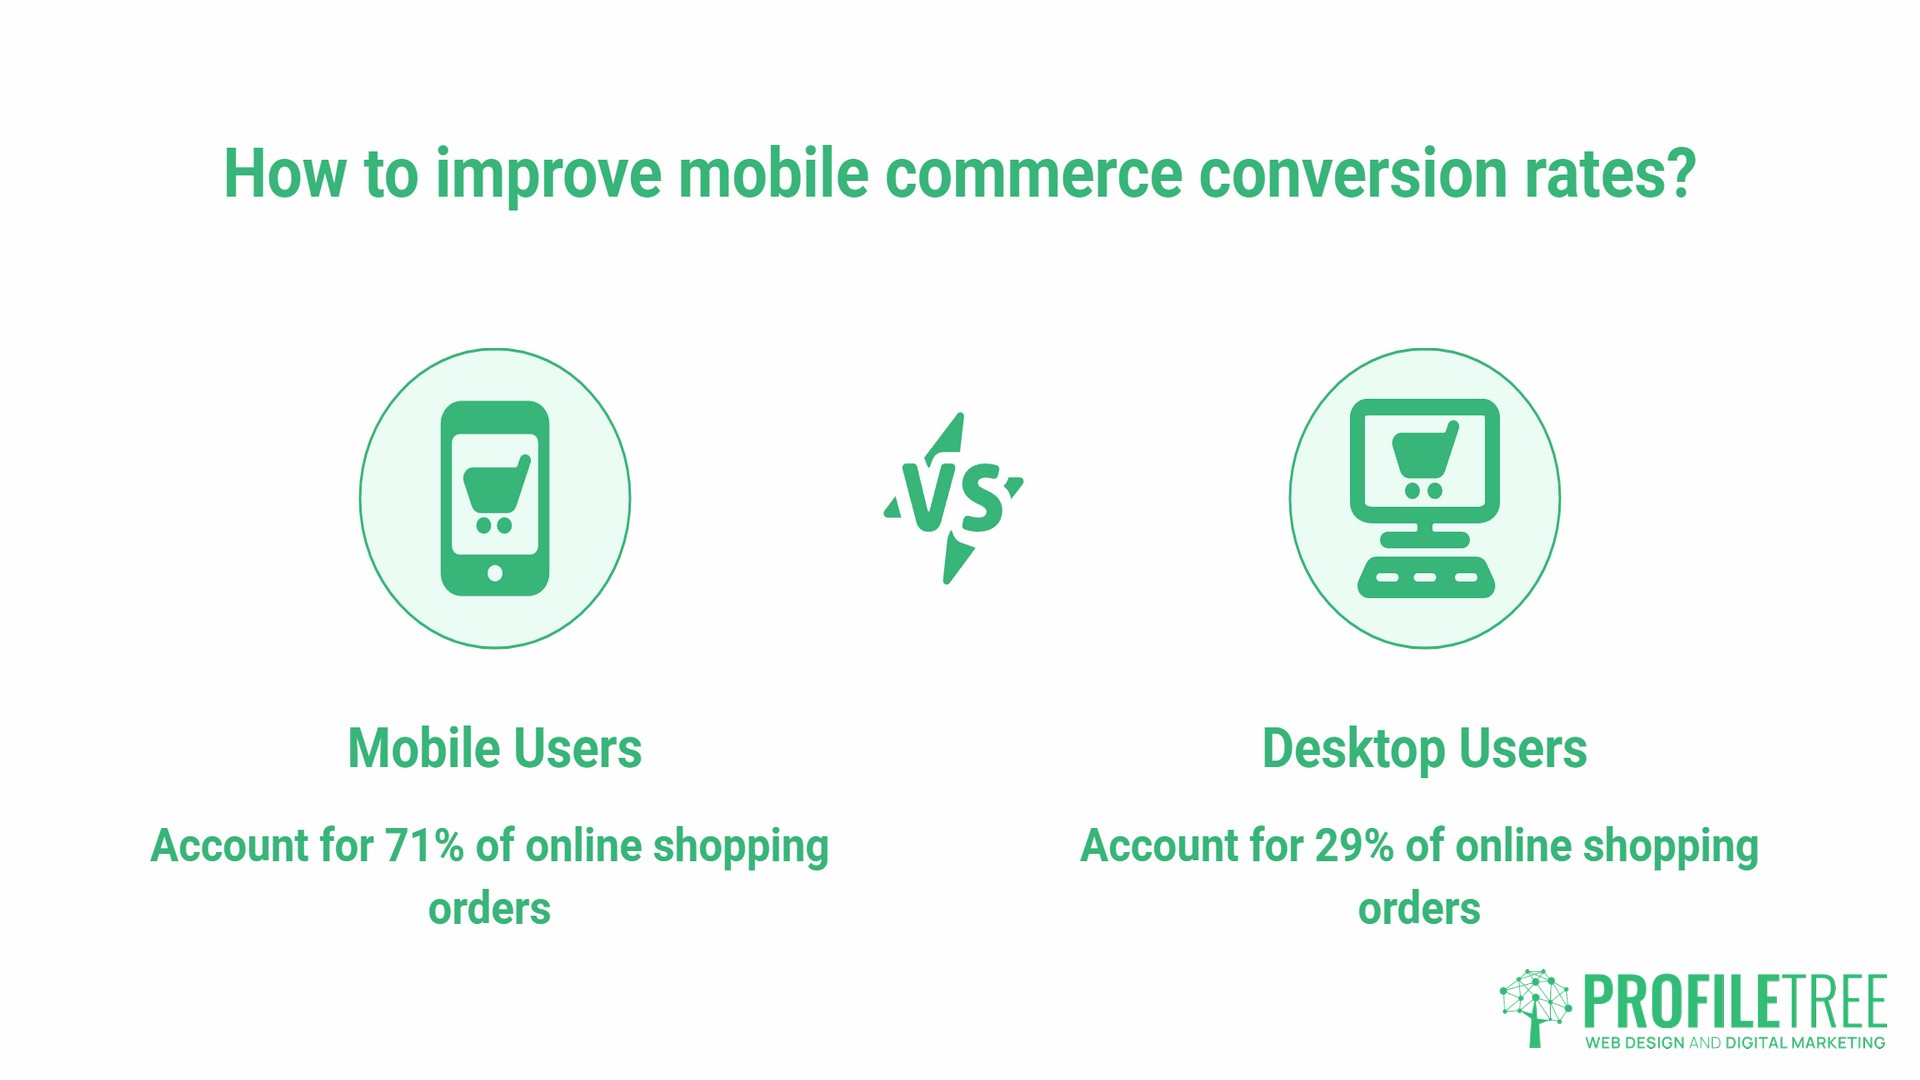
Salesforce Research data, reported by Statista for Q2 2024, shows that smartphones were used to complete 71% of online shopping orders in the UK, while accounting for 77% of retail site visits. This gap between traffic share and order share points to the conversion rate problem that persists across mobile commerce. According to the same Statista data set, desktop still converts at a higher rate despite generating far less traffic.
Statista and eMarketer data on UK mobile commerce share shows that mobile accounted for approximately 56% of e-commerce retail sales in the UK in 2023, with projections pointing to continued growth toward 57.6% by 2027. More recent estimates compiled by Charle and Ecommerce Scotland for 2025 and 2026 suggest mobile transactions already account for 55 to 60% of UK e-commerce purchases.
Cart abandonment is where the conversion gap is most visible. The Baymard Institute, which tracks abandonment rates across more than 50 studies, puts average cart abandonment at 70.22%, with mobile users abandoning at a significantly higher rate than desktop users, approximately 85.65% according to research from Email Vendor Selection. The drivers are consistent across studies: unexpected costs at checkout, complex form fields, slow page load times, and checkout flows that break on mobile browsers.
Deloitte research found that a 0.1-second improvement in mobile site speed leads to an 8% increase in conversion rates for e-commerce. That figure gives a precise commercial value to the performance improvements ProfileTree’s web design and development services deliver as a standard part of any new build.
Mobile wallets have removed some of the friction. UK Finance data shows that contactless payments continue to grow as a proportion of all UK transactions. Statista data for 2025 shows that mobile wallets have been adopted by approximately 57% of UK adults, with the 16 to 24 age group leading at 88% adoption. Businesses that accept Apple Pay and Google Pay at checkout reduce one of the most significant causes of abandonment.
Social Media Mobile Engagement
Social media is, for most users, a mobile experience, and the mobile marketing statistics on content performance reflect that fact. Any social media strategy that ignores mobile formatting is working against the platform it is built on.
Statista data shows that the vast majority of social media usage globally takes place on mobile devices. The IAB UK H1 2024 Digital Adspend update confirmed that investment in video display grew 26% year on year in the first half of 2024, with mobile described as the dominant environment for that growth. By the full-year 2025 IAB UK Adspend report, video had risen to account for 23% of total digital ad spend in the UK, and social media spend had grown 21% to £11.5 billion.
The commercial implication for content strategy is significant. Video content formatted for desktop viewing, typically horizontal 16:9, performs substantially worse on mobile-first platforms than content shot and edited vertically. The IAB UK data on video spend confirms that advertisers are shifting budgets toward formats that match how mobile users consume content.
Short-form video is the format with the highest organic reach on mobile-first platforms. ProfileTree’s guide to the rise of short-form video covers the platform-specific dynamics in detail. The core mobile marketing principle for SMEs is consistent: content that is not optimised for a phone screen held vertically is underperforming against content that is, regardless of the quality of the underlying message.
Video production for mobile consumption is a distinct discipline from standard video marketing. Aspect ratio, caption placement, hook timing, and thumbnail design all work differently on a small screen than on a monitor. For businesses considering investment in video content, short-form video content for mobile-first platforms is the format with the lowest barrier to entry and the highest current reach.
The video below gives an overview of how ProfileTree approaches digital marketing strategy for businesses at different stages of mobile readiness.
Mobile Advertising Performance
The IAB UK Digital Adspend 2024 report, published in April 2025, confirmed that total UK digital ad spend reached £35.5 billion in 2024, a 13% year-on-year increase. Mobile spending grew at almost three times the rate of the overall market in H1 2024, according to the IAB UK H1 update, described by IAB UK CEO Jon Mew as part of the “dominance of mobile spend” that has characterised UK digital advertising for several consecutive years.
The IAB UK Digital Adspend 2025 report, the most recent available, showed total UK digital ad spend reaching £40.5 billion, with video accounting for 23% of total spend and social media growing 21% to £11.5 billion. These mobile marketing statistics on ad spend confirm that the channel mix is continuing to move decisively toward mobile-first environments, with social media platforms capturing a growing share of that investment.
For regional SMEs, location-based mobile advertising offers a cost-effective way to reach high-intent audiences. The ability to target ads to users within a defined geographic area, or to users who have previously visited a physical location, is substantially more precise on mobile than on desktop because location data is more granular. For businesses serving a specific city or region, this precision is one of the strongest arguments for mobile-first paid media strategies.
Mobile ad blocking continues to grow. Statista data show that the proportion of mobile users in the UK who use ad blockers has risen steadily. The commercial response is to invest in formats that provide genuine value: native content, sponsored editorial, and well-targeted social advertising, rather than in interruptive display formats that users actively avoid.
Technical Performance: The Cost of a Poor Mobile Experience
Google’s mobile-first indexing, in place since 2019, means the mobile version of a website is the version Google primarily crawls and evaluates for ranking. For businesses that have never independently audited how their site performs on mobile, this is a structural risk that compounds over time.
The mobile marketing statistics on technical performance are among the most commercially precise available. Think with Google research on mobile page speed, cited consistently across industry sources, shows that the probability of a mobile bounce increases 90% when load time goes from one second to five seconds, and 123% when it goes from one second to ten seconds. A 2024 Deloitte study found that a 0.1-second improvement in load time increases conversion rates by 8% for e-commerce and 10.1% for travel sites.
Research compiled from HTTP Archive data in 2026 shows that only 39% of websites currently pass all three Core Web Vitals on mobile. Fewer than half of mobile users get an experience that meets Google’s thresholds for Largest Contentful Paint, Interaction to Next Paint, and Cumulative Layout Shift. For businesses whose sites are in the failing majority, the ranking and conversion costs are real and measurable.
The table below summarises the relationship between mobile page load time and bounce probability, based on Think with Google research data.
| Page load time | Bounce probability increase vs 1 second |
|---|---|
| 1 second | Baseline |
| 3 seconds | +32% |
| 5 seconds | +90% |
| 7 seconds | +113% |
| 10 seconds | +123% |
Source: Think with Google, Mobile Site Load Time Statistics.
For most SME websites, reducing load time from five seconds to under two seconds is achievable through image compression, code minification, caching, and hosting upgrades. ProfileTree’s web development work with SMEs is structured around Core Web Vitals targets from the outset, because retrofitting performance improvements after launch consistently costs more than building for performance from the start.
Progressive Web Apps and Mobile App Engagement
Progressive web apps occupy a distinct position in the mobile marketing technology landscape, and they are relevant to a wider range of SMEs than traditional native app development.
A progressive web app is a website that delivers app-like functionality: home screen installation, offline availability, push notifications, and fast loading. Unlike a native iOS or Android app, a PWA does not require submission to an app store, does not need a separate development codebase for each operating system, and can be built at significantly lower cost.
For SMEs in Northern Ireland and across the UK who are considering whether to invest in a mobile app, PWAs often represent the more practical option. The functionality covers most SME use cases, including appointment booking, loyalty programmes, product catalogues, and service portals. For businesses where the use case is a good fit, a PWA delivers most of the commercial benefits of a native app at a fraction of the ongoing cost.
Statista app retention benchmarks show that average 90-day app retention rates sit around 32%. That means roughly two in three mobile users who download an app stop using it within three months. PWAs tend to have higher initial adoption because they remove the installation barrier: users add a PWA to their home screen directly from the browser, without visiting an app store. For existing customer bases, that lower friction translates into higher uptake.
The mobile marketing statistics around app engagement also highlight where native apps remain superior: for businesses with a genuinely engaged, loyal customer base that will benefit from offline functionality and deep device integration, such as retail loyalty programmes or field service tools, native app development is worth the investment. The decision is not binary. Understanding which use case you are solving determines which technology is appropriate.
A Three-Step Mobile Growth Framework for SMEs
The mobile marketing statistics in this guide point to a consistent pattern: most SMEs are losing business because their mobile presence does not match the quality of the customer experience they deliver in person or over the phone. The following three-step framework gives a practical structure for closing that gap.
Step 1: The mobile audit
Before investing in any new mobile marketing activity, understand your current position. Google’s freely available PageSpeed Insights tool assesses your site’s Core Web Vitals scores on mobile. Google Analytics shows what proportion of your traffic is mobile, the mobile bounce rate compared to desktop, and which pages see the highest mobile drop-off.
This audit typically takes two to three hours for an SME site and produces a prioritised list of technical issues. Common findings include uncompressed images, render-blocking scripts, unresponsive form fields, and checkout flows that break on mobile browsers. Each has a specific fix.
The mobile marketing statistics on Core Web Vitals pass rates (39% of sites passing on mobile) suggest that most SME websites have actionable issues. Finding them is the first step.
Step 2: Content re-optimisation for mobile users
Mobile users scan rather than read linearly, are more likely to be interrupted mid-session, and are less likely to scroll to the bottom of a long page. Content that works well on desktop, long paragraphs, complex tables, and multi-column layouts frequently fails to hold attention on mobile.
Restructuring existing content for mobile consumption involves shorter paragraphs, more frequent subheadings, simplified tables, and placing the most important information in the first screen without requiring a scroll. This is not about reducing the depth of the content. It is about making that depth accessible on a small screen.
Short-form video, produced in vertical format for mobile-first platforms, is the content format with the highest organic reach on social media. The IAB UK’s data on video’s 20% year-on-year spend growth and 23% share of total digital ad spend reflects where social media audiences are spending their time and where advertisers are following them. For SMEs that have not yet invested in video content for social media, this is the format to start with.
Step 3: Local visibility
For most SMEs in the UK and Ireland, local search on mobile is the channel with the highest commercial intent. Think with Google data shows 76% of mobile users who conduct a local search visit a business within 24 hours. A user searching for your service category in your city is typically ready to make a decision the same day.
Appearing in that search requires a complete and optimised Google Business Profile, location-specific pages on your website with local schema markup, and a site that performs well enough on mobile to keep users engaged once they click through. All three elements need to work together for the mobile marketing statistics on local search intent to translate into actual footfall or enquiries.
Mobile Marketing Statistics at a Glance
The table below brings the key verified mobile marketing statistics in this guide together for quick reference.
| Category | Key statistic | Source |
|---|---|---|
| Smartphone ownership | 91% of UK adults own a smartphone | Ofcom via Statista, 2024 |
| Retail site visits | Smartphones account for 77% of UK retail site visits | Salesforce Research via Statista, Q2 2024 |
| Shopping orders | UK total digital ad spend: £40.5bn (2025), mobile is the dominant environment | Salesforce Research via Statista, Q2 2024 |
| M-commerce share | Mobile accounts for approximately 56% of UK e-commerce retail sales | Statista/eMarketer, 2023 data |
| Cart abandonment | Average cart abandonment on mobile: ~85.65% | Email Vendor Selection / Baymard Institute |
| Digital ad spend | UK total digital ad spend: £40.5bn (2025), mobile the dominant environment | IAB UK Digital Adspend 2025 |
| Page speed and bounce | Load time from 1 to 5 seconds increases bounce probability by 90% | Think with Google |
| Core Web Vitals pass rate | Only 39% of websites pass all three Core Web Vitals on mobile | Scalify, 2026, via HTTP Archive data |
| Mobile wallet adoption | 57% of UK adults use digital wallets; 88% penetration among 16-24s | Statista, 2025 |
| Local search intent | 76% of local mobile searches result in a business visit within 24 hours | Think with Google / Google Consumer Insights |
FAQs
Why are mobile marketing statistics important for small businesses?
Mobile marketing statistics give business owners an evidence base for decisions that are otherwise made on intuition. When the data shows that 77% of retail site visits in the UK come from smartphones, that is a clear signal about where website investment should go. When it shows that mobile cart abandonment rates sit around 85%, compared to 65 to 70% on desktop, it points to a specific problem with a specific solution. Good mobile marketing starts with this kind of evidence rather than guesswork. The statistics do not replace business judgment, but they make that judgment better-informed.
What percentage of UK web traffic is mobile?
Salesforce Research data, reported by Statista for Q2 2024, show that smartphones account for 77% of UK retail site visits. For broader web traffic beyond retail, mobile’s share is similarly dominant. Ofcom’s 2024 Communications Market Report confirms that mobile data consumption grew 21% year on year in 2023. For any specific site, Google Analytics gives a more precise breakdown than industry averages.
Does mobile page speed affect Google rankings?
Yes, directly. Google has used mobile-first indexing since 2019, meaning the mobile version of a site is what it primarily evaluates. Core Web Vitals, covering loading performance, interactivity, and visual stability on mobile, have been confirmed as ranking signals since 2021. Research compiled in 2026 shows only 39% of websites pass all three Core Web Vitals on mobile. A site in the failing majority is at a structural disadvantage in mobile search rankings.
How much does a mobile-optimised website cost?
The question worth asking alongside it is what a poorly optimised mobile site costs in lost mobile users. Think with Google research shows that a 5-second load time increases the probability of mobile bounce by 90% compared to a 1-second load time. A Deloitte study found that a 0.1-second improvement in mobile load time increases e-commerce conversion rates by 8%. Quantifying those losses relative to your average customer value makes the ROI case for investment.
Performance improvements to an existing WordPress site, including image compression, caching, and code clean-up, typically range from a few hundred to a few thousand pounds. A full mobile-first rebuild for an SME typically sits in the £3,000 to £15,000 range, depending on complexity and scope.
What is the difference between a mobile-friendly and a mobile-first website?
A mobile-friendly site is one that does not break on a phone. Text is readable, buttons are tappable, and the layout adjusts to the screen size. A mobile-first site is one designed from the outset for the mobile experience, with desktop as a secondary consideration.
Mobile-first sites load faster on mobile, score better on Core Web Vitals, and convert better because the navigation, content structure, and interaction patterns are built around how mobile users actually behave, rather than retrofitted from a desktop layout. For businesses whose analytics show more than 50% of traffic is mobile, which now describes most SME sites, mobile-first is the appropriate design approach for any new build.
Is SMS marketing still effective for UK businesses?
SMS marketing has among the highest open rates of any digital channel. Industry benchmarks consistently show open rates above 90%, compared to average email open rates of 20 to 30%. For time-sensitive communications such as appointment reminders, order confirmations, and flash offers, SMS remains one of the most direct channels available. UK GDPR requires explicit opt-in for marketing SMS, which means the channel works best as part of a customer retention strategy rather than cold outreach. For businesses that have already built a consented list, it is one of the most cost-effective mobile marketing tools available.
What is a progressive web app, and should my business have one?
A progressive web app delivers app-like functionality via a website: home screen installation, offline access, push notifications, and fast load times. For SMEs in Northern Ireland and across the UK considering a mobile app investment, a PWA is often the more practical choice. It works across all devices without requiring separate iOS and Android builds, does not require app store approval, and costs significantly less to maintain than a native app.
If your business use case involves appointment booking, a product catalogue, a loyalty programme, or a customer portal, a PWA is worth evaluating before committing to native app development. For businesses with a highly engaged customer base requiring deep device integration, native app development remains the stronger option.