
Blog Analytics: The Complete Guide to Data-Driven Growth for UK SMEs
Table of Contents
Most businesses treat blog analytics as a reporting exercise. They check pageviews at the end of the month, note that traffic went up or down, and move on. That approach produces numbers without answers. The point of analytics is not to count visitors; it is to understand what the data is telling you to do differently.
This guide is built around that principle. It covers the metrics that matter for UK SMEs, how to set up tracking correctly under UK privacy law, and, most importantly, how to move from spotting a data pattern to taking a specific editorial or technical action.
Whether you manage your own blog or work with a content marketing agency, the frameworks here will help you get more from the data you are already collecting.
What Is Blog Analytics?
Blog analytics is the process of collecting, interpreting, and acting on data about how your blog content performs. It goes well beyond counting pageviews. Done properly, it tells you which posts attract the right audience, which ones convert readers into enquiries, where people drop off, and which topics are losing search visibility over time.
The difference between metrics and insights
A metric is a number. An insight is what that number means for your next decision.
“3,200 pageviews last month” is a metric. “Our how-to posts attract three times more engaged readers than our opinion pieces, and that pattern has held for six months — so we should shift our content calendar” is an insight.
The goal of every analytics review is to leave with an insight, not a figure. If your monthly report produces a table of numbers with no clear action, it is not serving its purpose.
UK GDPR and Blog Analytics: What Every Business Needs to Know
This section is where most guides go quiet. US-centric resources from HubSpot, Semrush, and similar platforms rarely address the practical reality of collecting analytics data under UK and EU privacy law. For businesses in Northern Ireland and the wider UK, this is not a footnote it directly affects how much you can trust your data.
Navigating UK GDPR and Consent Mode v2
Under the UK GDPR, you cannot set analytics cookies without the user’s consent. If a visitor declines your cookie banner, their session is not tracked in standard Google Analytics 4 configurations. On sites with well-designed consent banners, a significant proportion of visitors opt out, meaning your GA4 data may represent only a fraction of your actual traffic.
Google’s Consent Mode v2, introduced in 2024, partially addresses this. When implemented correctly, it allows GA4 to model user behaviour for users who decline cookies, filling some gaps with aggregated, anonymised data. The Information Commissioner’s Office (ICO) provides guidance on lawful analytics use; any business collecting data from UK visitors should review the ICO’s current cookie consent requirements before drawing firm conclusions from their reports.
The practical takeaway: treat your GA4 data as directionally accurate rather than precisely complete. Trends and ratios are more reliable than absolute numbers.
The impact of cookie banners on data accuracy
The design of your consent banner affects your data quality. An intrusive or poorly timed banner pushes more visitors toward the “reject all” option, widening the gap between actual traffic and tracked traffic. A clear, well-positioned banner with a genuine choice, not a dark-pattern design that buries the reject option, produces higher consent rates and more accurate data.
If you are seeing unusual traffic drops without an obvious cause, audit your consent banner before assuming a content or SEO problem. A banner change can significantly affect reported traffic without changing actual visitor numbers.
The Actionable Analytics Framework: If the Data Shows This, Do That
The most useful thing any analytics guide can give you is a decision framework. The table below maps common data patterns to their likely causes and immediate actions. This is the “So What?” matrix that most generic guides skip.
| Metric Pattern | Likely Problem | Immediate Action |
|---|---|---|
| High bounce rate + high time on page | The title tag or meta description is not compelling enough | Add a contextual CTA or internal link to a relevant service or related post |
| High traffic + low conversion | Intent mismatch visitors are not the right audience for your offer | Review the keywords bringing traffic; adjust content angle or add a more targeted CTA |
| High search rank + low CTR | Title tag or meta description is not compelling enough | Test a rewritten meta title that leads with the benefit, not the topic |
| Falling traffic on an older post | Content decay competitors have published fresher, stronger content | Run a content refresh: update statistics, add new sections, improve internal links |
| High mobile bounce rate | Page loads slowly or displays poorly on mobile | Run a Core Web Vitals check; address image sizes and layout issues |
| Low scroll depth | The article loses relevance or quality after the first screen | Move the most useful content earlier; cut or compress weak sections below the fold |
“The businesses that get the most from their content are the ones that treat analytics as a brief for the next action, not a record of the last month,” says Ciaran Connolly, founder of ProfileTree. “Data without a decision attached to it is just noise.”
High bounce rate and high time on page: the missing CTA fix
This combination is one of the most common patterns on content-heavy sites. Visitors are reading the time-on-page figure confirms that, but they are leaving without taking any action. The problem is usually structural: the content delivers value but does not give the reader a logical next step.
The fix is a contextual call to action placed within the body of the article, not just at the bottom. If the post covers content strategy, a mid-article link to a content marketing service page or a related guide on maximising ROI from digital marketing campaigns gives engaged readers somewhere to go.
High traffic and low conversion: the intent mismatch audit
When a post attracts strong traffic but generates few enquiries or leads, the most common cause is a mismatch between what the content promises and what the business offers. A post that ranks for “free blog analytics tools” attracts people looking for a tool to download, not a digital agency to hire. Traffic figures look healthy; commercial value is low.
The audit here is to check the top queries driving traffic to that post in Google Search Console. If the keywords are purely informational and carry no commercial intent, you have three options: accept the post as a brand-awareness asset, rewrite it to attract a more commercially minded audience, or add a section that bridges from the informational content to a relevant service.
High search rank and low CTR: the title tag problem
A post ranking on page one but generating a low click-through rate is almost always a title tag problem. The title either does not match what the searcher is looking for, does not communicate a clear benefit, or is outperformed by competitors whose titles answer the query more directly.
Test a rewritten meta title that leads with the outcome rather than the topic. “Blog Analytics: What to Track” competes with a dozen similar titles. “Blog Analytics: Turn Your Data Into Your Next Editorial Decision” positions the content differently and speaks to readers who are past the basics.
Essential Metrics for UK B2B and B2C Blogs
Not every metric deserves equal attention. The list below focuses on the ones that consistently inform useful decisions for SMEs in Northern Ireland and the UK.
Engagement rate versus bounce rate in GA4
Universal Analytics measured bounce rate as the percentage of sessions in which a user viewed only one page. GA4 replaced this with engagement rate, the percentage of sessions that lasted longer than 10 seconds, included a conversion event, or had at least 2 pageviews.
This is a meaningful change. A visitor who reads a 2,000-word article for four minutes and then closes the tab would have been counted as a bounce in Universal Analytics. In GA4, that session counts as engaged. If you are comparing historical data across both platforms, the numbers are not directly comparable.
For most SME blogs, an engagement rate above 50% is a reasonable baseline. Below that figure, the most common causes are slow page load times, content that does not match the search query, or a poor mobile experience.
Conversion tracking: lead magnets versus commercial intent
Conversions on a blog can mean different things depending on the goal. For a B2B services business, the most valuable conversion is typically a contact form submission or a click to a service page. For a business with a content-led funnel, it might be a newsletter sign-up or a download.
GA4 lets you set up custom events to track the actions that matter to your business. The important thing is to define this before you start reviewing data, not after. “We got 200 conversions last month” only means something if you know what a conversion is and what it is worth.
Scroll depth and content readability
Scroll depth tracking shows how far down a page visitors read before leaving. If 80% of visitors leave before reaching the halfway point of a 3,000-word article, the content is not holding their attention — or it is answering their question early, and they have no reason to read further.
Both interpretations matter. If readers are leaving early because they found what they needed, the fix is to add more value further down the page and to make the structure visible enough that readers know more useful content follows. If they are leaving because the content drops in quality, the answer is to edit it.
Identifying and Fixing Content Decay
Content decay is one of the most underaddressed problems in blog analytics. It describes the gradual loss of search visibility that affects posts as competitors publish fresher, better-structured content on the same topic.
A post that ranked on page one two years ago can slip to page three without any change to the post itself, simply because the competitive landscape has shifted around it.
How to spot posts losing search share
In Google Search Console, filter your pages by date range and compare impressions year-on-year. Posts with declining impressions over three to six months are showing early signs of content decay.
Cross-reference this with position data. A post that has dropped from position four to position twelve over six months is at risk of falling off page one entirely. The time to act is before it drops, not after.
A broader view of your site’s analytics health, including which pages are gaining or losing visibility, is covered by ProfileTree as part of an SEO services review for clients. Identifying decay early is significantly more efficient than attempting to recover a post that has already lost most of its rankings.
The three-step refresh process
Step 1: Update the content itself. Add new sections that cover angles the original post missed. Replace any statistics that are more than two years old with current figures, sourced and linked. Address any questions in the People Also Ask box that the post currently ignores.
Step 2: Improve the structure. Ensure the post has a clear H2 and H3 hierarchy, a table of contents for longer pieces, and at least one comparison table or structured list that search engines can extract for featured snippets.
Step 3: Strengthen internal links. Add links to and from the refreshed post. A post that other pages on your site link to is considered more authoritative than one sitting in isolation. Use anchor text that reflects the topic of the linked post, not generic phrases like “click here.”
The Best Blog Analytics Tools for UK Businesses
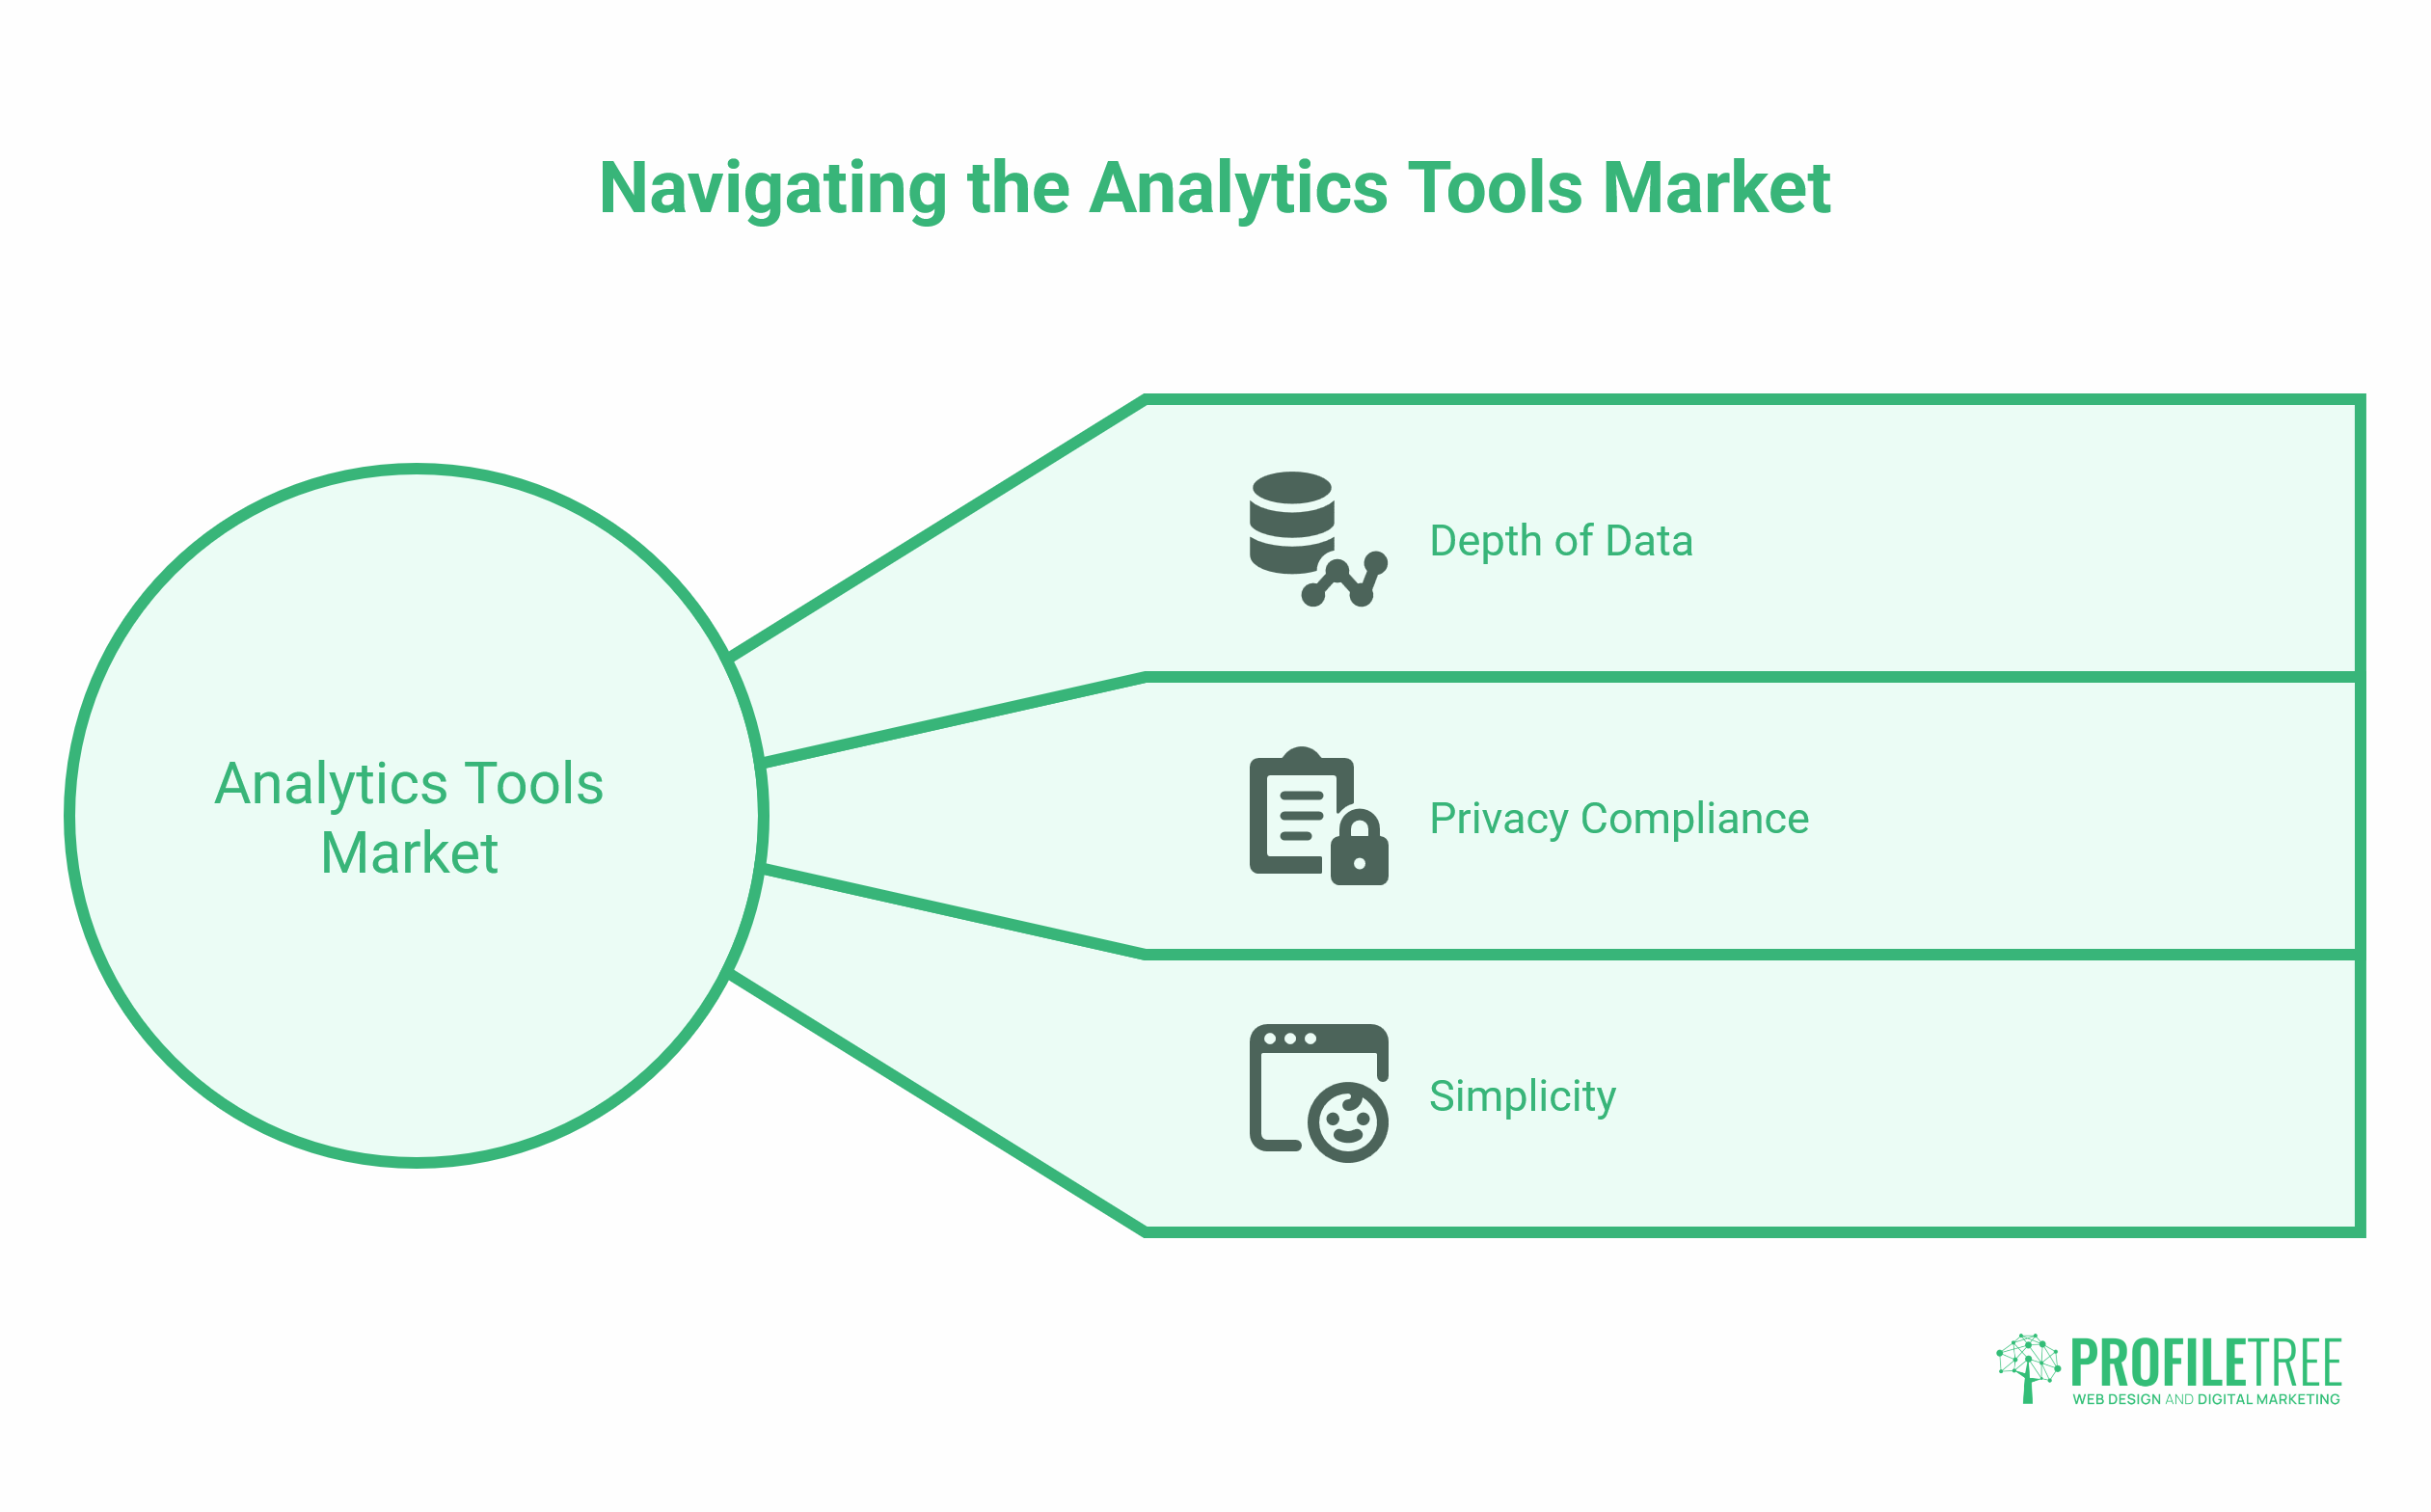
The tools market has settled into three clear options for most businesses. The right choice depends on your priority: depth of data, privacy compliance, or simplicity.
GA4: the standard
Google Analytics 4 is the default starting point for most businesses. It is free, integrates directly with Google Search Console, and provides the most comprehensive dataset available without a subscription. The reporting interface is less intuitive than Universal Analytics was, but the underlying data is richer, particularly for tracking user journeys across multiple sessions.
For UK businesses using WordPress, GA4 integrates seamlessly via either the Site Kit plugin or a Google Tag Manager implementation. ProfileTree’s web design and development process includes GA4 setup as standard for client sites, ensuring event tracking is configured correctly from launch rather than retrofitted later.
Matomo: the privacy-first option
Matomo is an open-source analytics platform that can be self-hosted, meaning your data never leaves your own servers. For businesses with strict data governance requirements, particularly those in legal, healthcare, or financial services, this is a meaningful advantage. Matomo also provides 100% data ownership, with no sampling of results, unlike GA4, which applies to large data sets.
The trade-off is setup complexity and ongoing maintenance. Self-hosting requires a server and technical configuration; the cloud-hosted version of Matomo reintroduces a third-party data dependency, though under stronger privacy terms than Google.
Plausible: the simple option
Plausible is a lightweight, privacy-focused analytics tool that is fully GDPR-compliant by design. It does not use cookies or collect personal data, so it can operate without a cookie consent banner. The data it provides is intentionally limited: traffic, referral sources, top pages, and basic device data.
For small businesses that want a quick overview without the complexity of GA4, Plausible is a practical starting point. It is not a replacement for GA4 if you need conversion tracking or detailed user journey analysis.
How Analytics Connects to Your Content Marketing Strategy
Understanding your data is only half the work. The other half is knowing what to do with it, and this is where many businesses hit a wall. The data tells you a post is underperforming; it does not write the improved version.
ProfileTree works with SMEs across Northern Ireland, Ireland, and the UK to bridge that gap. The analytics review identifies where content is and isn’t working; the content marketing service then addresses the gaps, whether that means refreshing existing posts, building new pillar content, or restructuring internal linking across a site.
The two activities are most effective when they run together. Analytics without content action produces reports. Content without analytics produces guesswork.
For businesses at an earlier stage, those who want to manage their own analytics but need to understand the tools properly, ProfileTree’s digital training programme covers GA4 setup, Search Console interpretation, and content performance tracking in a practical, hands-on format.
Analytics Cadence: How Often Should You Check Your Data?
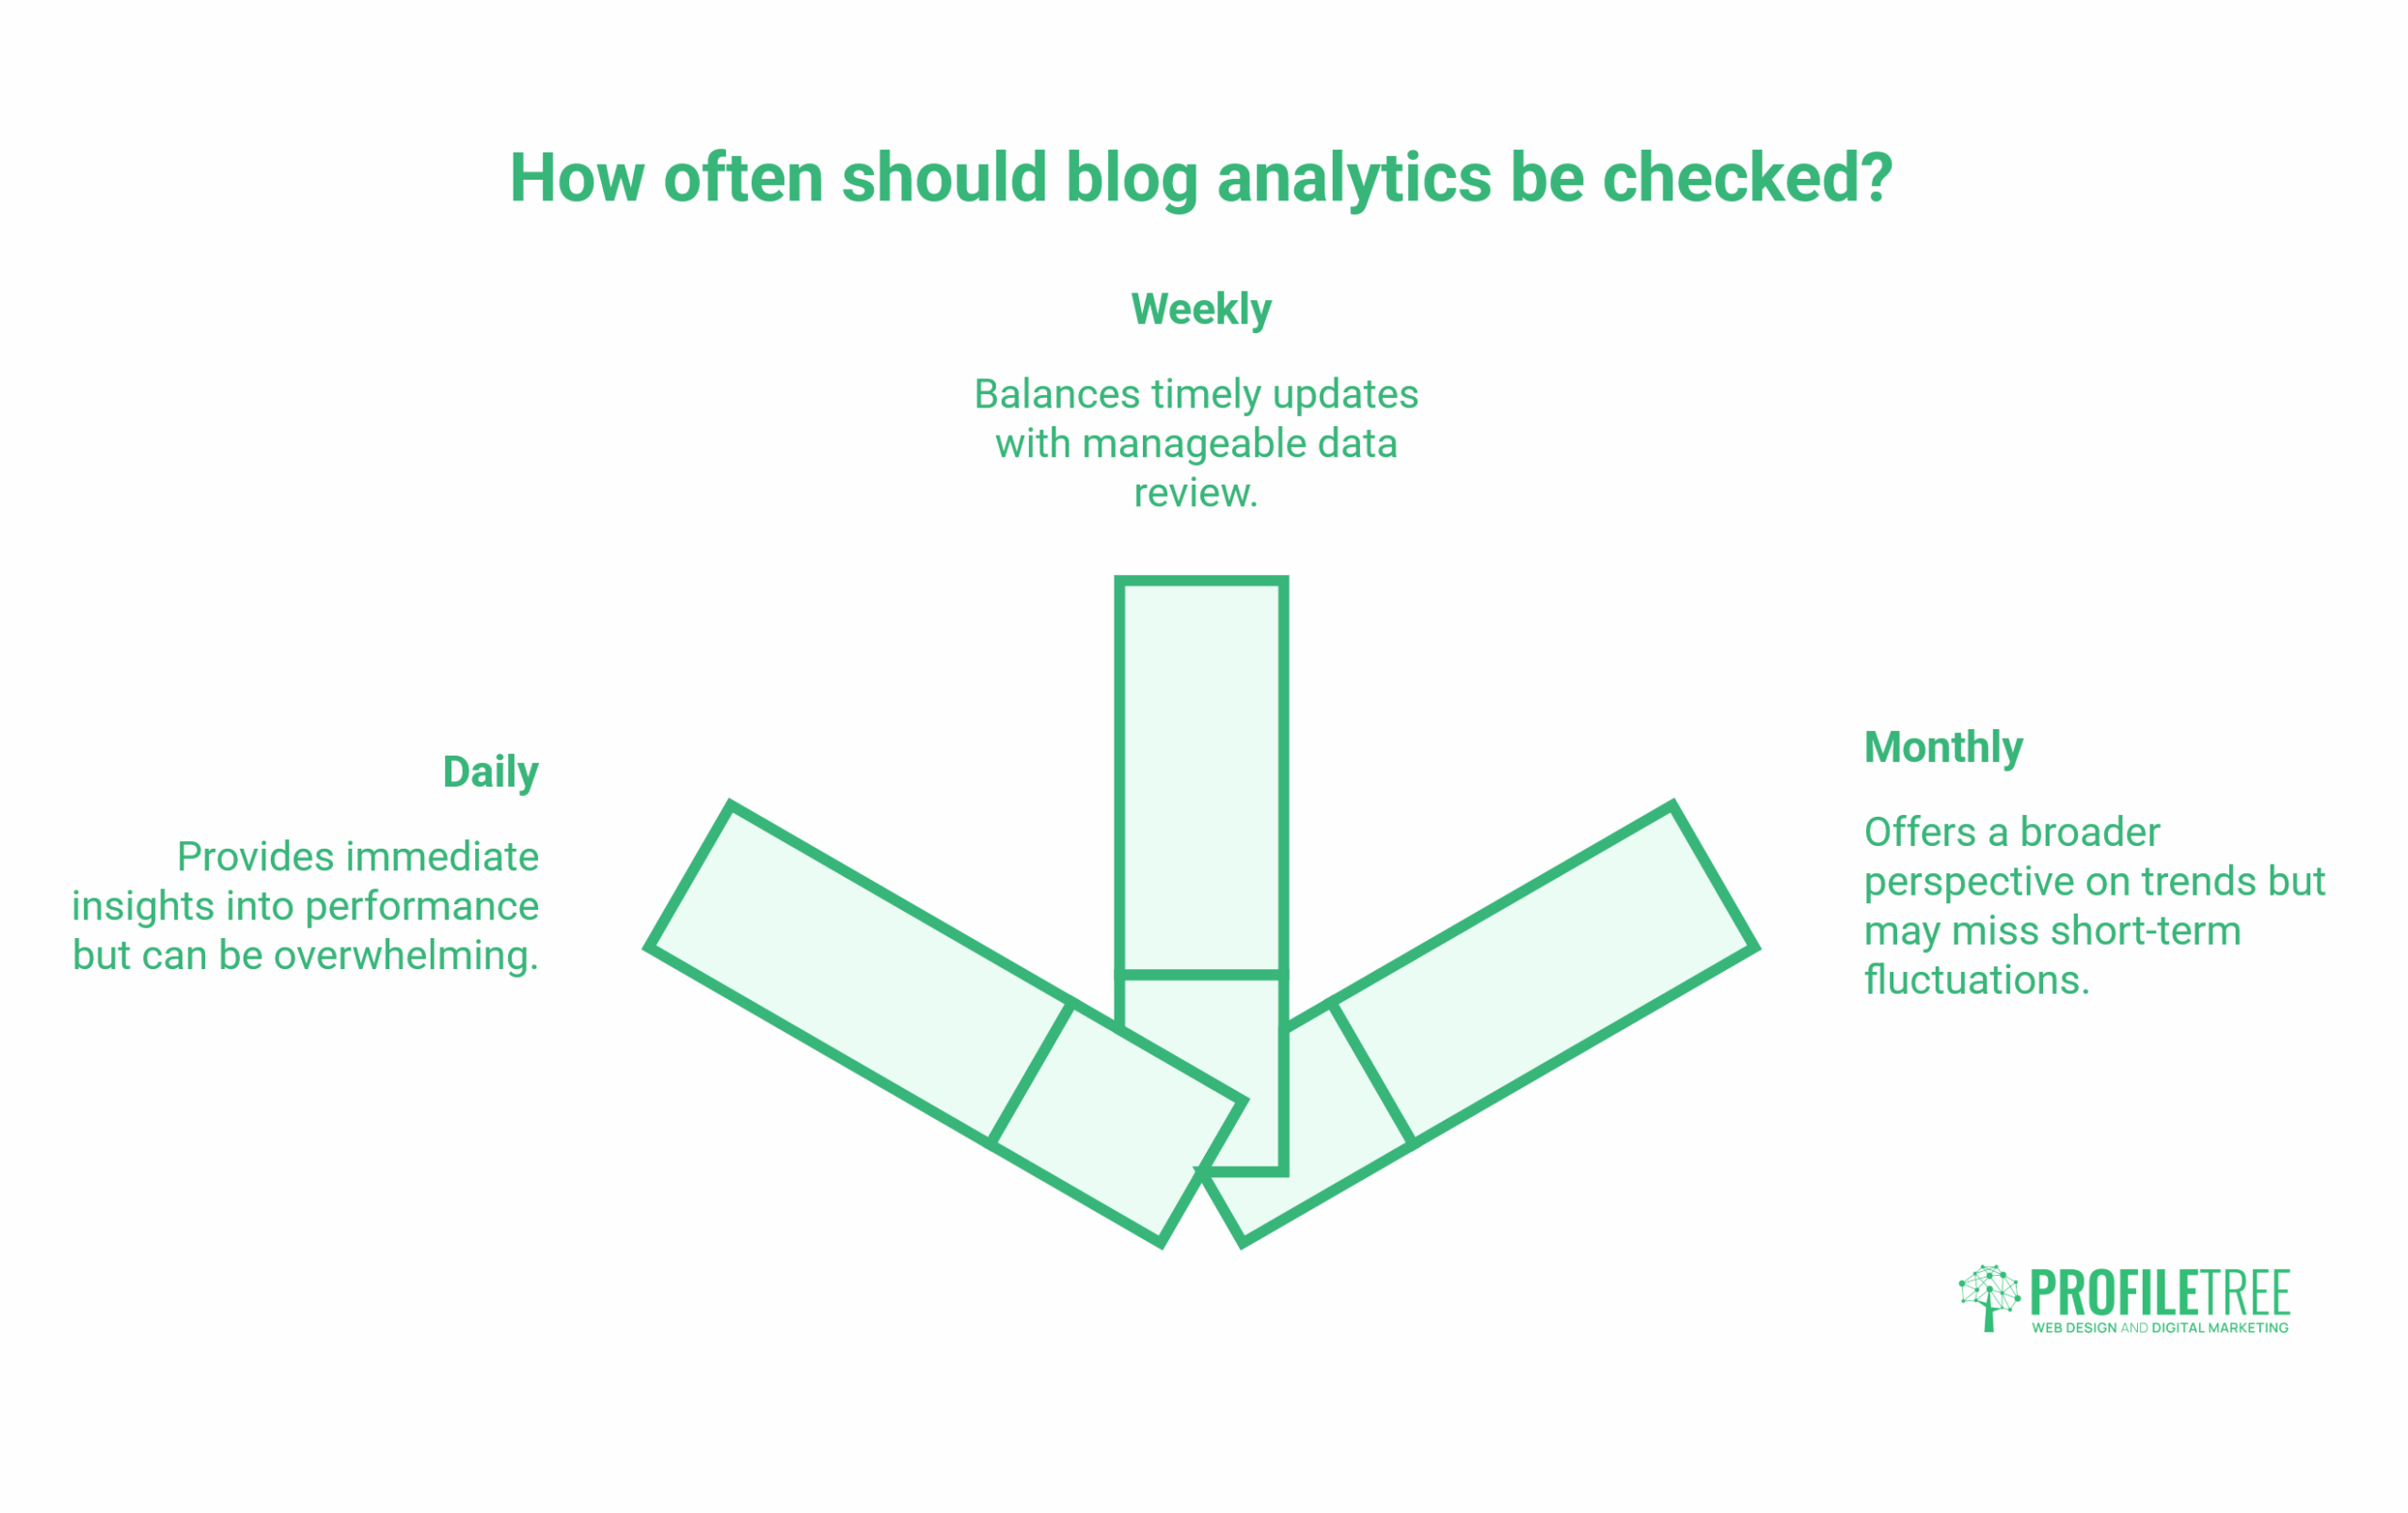
This is one of the most searched questions around blog analytics and one of the least well answered. Most guides say “regularly.” That is not useful.
Here is a practical cadence for SME marketing managers:
Daily: Technical health only. Check for any dramatic drops in traffic that might indicate a site error, a manual penalty, or a major algorithm update. You are not looking for trends at this frequency; you are looking for problems.
Weekly: Traffic trends and top-performing posts. Note which posts are attracting the most engaged visitors and whether any posts are showing unusual drops. This is also a good time to check Search Console for any new queries you are appearing for but not yet targeting.
Monthly: Full performance review. Compare the current month against the previous month and against the same month last year. Review conversion data. Identify posts that have dropped in position and flag them for a refresh. Update your content calendar based on the data.
Quarterly: Strategic review. Assess which content clusters are growing in authority and which are static. Review the overall keyword strategy. Decide which posts need a full refresh versus which should be consolidated or removed.
Conclusion
Blog analytics earns its place in your workflow only when it drives decisions, not just data. Set up GA4 and Search Console correctly, account for the data gaps created by UK privacy law, and use the “If this, then that” framework to turn patterns into actions. Check your data at a frequency that matches the decision you are trying to make, not because it is reassuring to open a dashboard.
If the data is clear but the next step is not, that is usually a signal to get a second perspective. ProfileTree’s content and SEO teams work with SMEs across the UK and Ireland to turn analytics reviews into content plans that improve rankings and generate real enquiries.
FAQs
What is a good engagement rate for a blog in GA4?
Above 50% is a reasonable baseline for most blogs. High-quality, long-form content targeting specific queries typically achieves 60–70%. Below 40%, the most common causes are slow page load times, poor mobile experience, or a mismatch between your content and the search intent driving traffic to it.
How do I check my blog analytics for free?
Google Analytics 4 and Google Search Console are both free. Connect them, and you get traffic data plus query-level data, which keywords drive impressions and clicks to each page without any subscription cost. Plausible offers a free trial if you want a simpler, cookie-free alternative.
What are the most important metrics for a blog?
For a business blog: engagement rate, organic traffic by post, conversion rate by post, and position data from Search Console. Pageviews are useful for context but rarely drive a specific action on their own.
How long should I wait before checking the data for a new post?
At least 30 days for SEO performance rankings often shift significantly in the first four to six weeks after publication. For social engagement, 48 hours is usually enough. Do not make decisions about a post’s search value based on data from the first two weeks.