Active and Passive Management: Statistics and Strategy
Table of Contents
Active and passive management sit at the heart of one of the longest-running debates in investment — and increasingly, in business strategy too. At its simplest, active management means making deliberate decisions to outperform a benchmark, while passive management means building a system that tracks it at lower cost and letting it run.
The statistics tell a fairly consistent story. Most active fund managers underperform their benchmarks over the long term once costs are factored in, and the gap compounds significantly over a decade or more. Passive funds, by contrast, deliver reliable market returns at a fraction of the price.
But the active-versus-passive framework extends well beyond investment portfolios. The same logic applies to how business owners allocate marketing budgets, whether to invest in always-on SEO or campaign-led activity, and whether to automate routine decisions using AI or manage them manually. Understanding the evidence behind active and passive management helps you make better-informed decisions in both contexts.
At a Glance: Active vs Passive Management
| Factor | Active Management | Passive Management |
|---|---|---|
| Primary goal | Outperform the benchmark | Match the benchmark |
| Typical cost (UK OCF) | 0.5%–1.5% per year | 0.05%–0.25% per year |
| Trading frequency | High (regular buying and selling) | Low (tracks an index) |
| Decision-making | Human judgement and analysis | Rules-based and algorithmic |
| Historical performance | Most active funds underperform long-term | Generally matches market returns |
| Flexibility | High (can respond to conditions) | Low (must follow the index) |
What Is Active Management?
Active management involves making deliberate decisions to outperform a benchmark. A portfolio manager selects and trades securities based on research, market analysis, timing, and sector allocation. The objective is to generate returns above the index, which is known as generating alpha.
The cost of active management reflects the work involved. UK investors typically encounter an ongoing charges figure (OCF) of 0.5% to 1.5% for actively managed funds, which is considerably higher than for passive equivalents.
The Case for Active Decision-Making
Active management carries a genuine appeal. If a skilled decision-maker can consistently identify better options than the market consensus, the additional return justifies the additional cost. In volatile or inefficient markets, there is stronger evidence that active management can add value. In smaller-company or emerging market funds, where pricing inefficiencies are more common, active managers have a better track record of earning their fees.
The human element is also relevant in specific circumstances. A fund manager who recognises early signs of deterioration in a sector can reduce exposure before an index is forced to hold those positions. In periods of significant market stress, that flexibility has real value.
The Cost Problem
The difficulty is that most active managers charge fees whether they outperform or not. Those fees compound over time. According to S&P Global’s SPIVA reports, the percentage of active funds underperforming their benchmark increases consistently over longer time horizons. Across equity markets, 82% of active managers underperformed their benchmarks over three years, 90% over five years, and 86% over ten years, according to the study’s findings. The statistics are not kind to the average active manager, however skilled the individual firm may be.
What Is Passive Management?
Passive management involves investing in a fund that tracks a market index rather than trying to beat it. The fund holds the same securities as the index, in the same proportions, and rebalances only when the index changes.
The UK equivalent of the American “expense ratio” is the ongoing charges figure (OCF). Passive funds, including index trackers and exchange-traded funds (ETFs), typically carry OCFs between 0.05% and 0.25%. That cost difference, compounded over decades, has a significant effect on long-term returns.
Why Low Costs Often Win Over Time
The mathematics are straightforward. If an active fund charges 1.2% annually and a passive fund charges 0.1%, the active fund must generate at least 1.1 percentage points of additional return each year just to break even. Given that most active managers fail to do this consistently, passive funds tend to deliver better net returns for the majority of long-term investors.
Passive management also removes the variability of human decision-making. Index funds do not have bad days, make emotional decisions, or shift strategy when market conditions become uncomfortable. That consistency is part of their structural advantage.
The Statistics: Performance Evidence Over Time
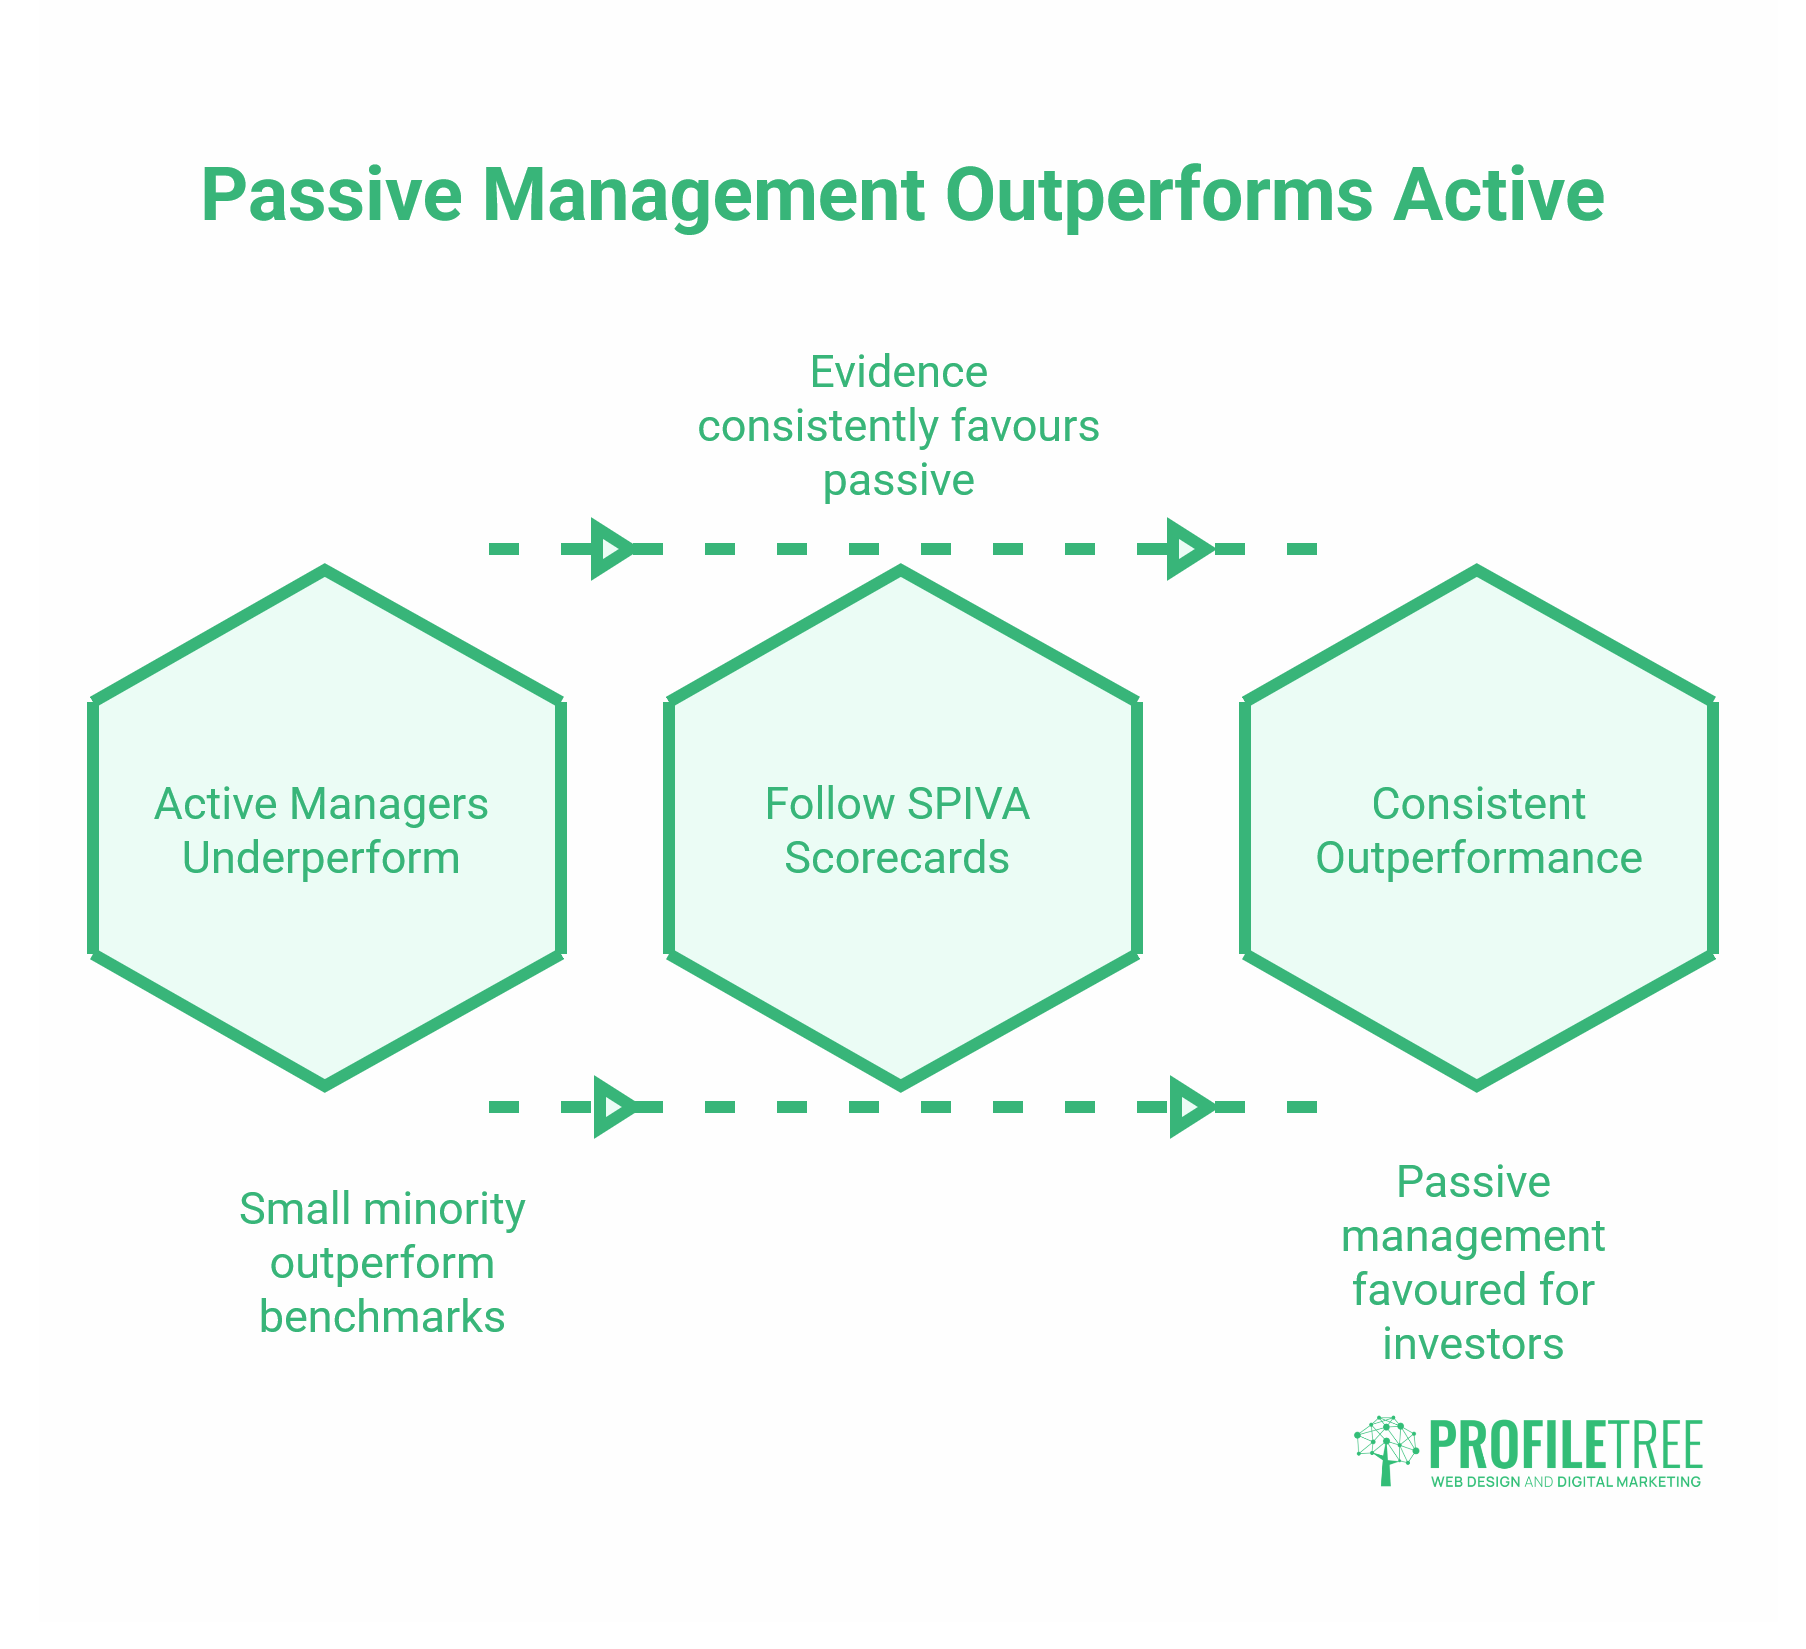
Historical performance data consistently favours passive management for most investors in most market conditions. The evidence from S&P Dow Jones Indices, which publishes the widely cited SPIVA scorecards, is clear: only a small minority of active managers consistently outperform their benchmarks across multiple time periods.
Understanding which statistics to trust here is important. If you are working with investment data or any business performance figures, the principles our team covers in our guide to misleading statistics in the media apply directly: survivorship bias, short measurement windows, and selective reporting all affect how investment performance data is presented.
Equity Markets
In large-cap equity markets, active management has the weakest track record. The market is highly liquid, heavily researched, and quickly prices in available information. There is little room for an active manager to find an advantage that is not already reflected in prices. The SPIVA data consistently shows that more than 80% of active UK equity funds underperform their benchmark over a ten-year period.
Bond Markets
The gap between active and passive narrows in fixed-income markets. Bond markets are less liquid and less uniformly priced than equity markets, which gives active managers more opportunity to add value through credit selection and duration management. The underperformance rate among active bond funds remains significant, but the margin over passive strategies is narrower than in equities.
Market Share: The Shift Towards Passive
The balance between active and passive management has shifted considerably over the past decade. Passive funds have grown from a niche product used mainly by institutional investors to the dominant structure for retail investment in many markets. In the US, passive funds now account for more than half of total fund assets, according to Morningstar data. The UK has followed a similar trajectory, with index trackers and ETFs taking a growing share of ISA and SIPP inflows.
The shift has been driven primarily by cost transparency. As platforms made it easier for investors to compare OCFs directly, the pricing disadvantage of active funds became harder to overlook. Regulatory changes requiring clearer fee disclosure have accelerated this.
This mirrors what happens in digital marketing budgets when business owners gain clearer visibility of channel-level ROI. Once the data is visible, resources move towards what works. Our article on statistics in business decision-making explores how the same analytical discipline that drives sound financial decisions also applies to marketing and operational choices.
Cost Analysis: What You Actually Pay
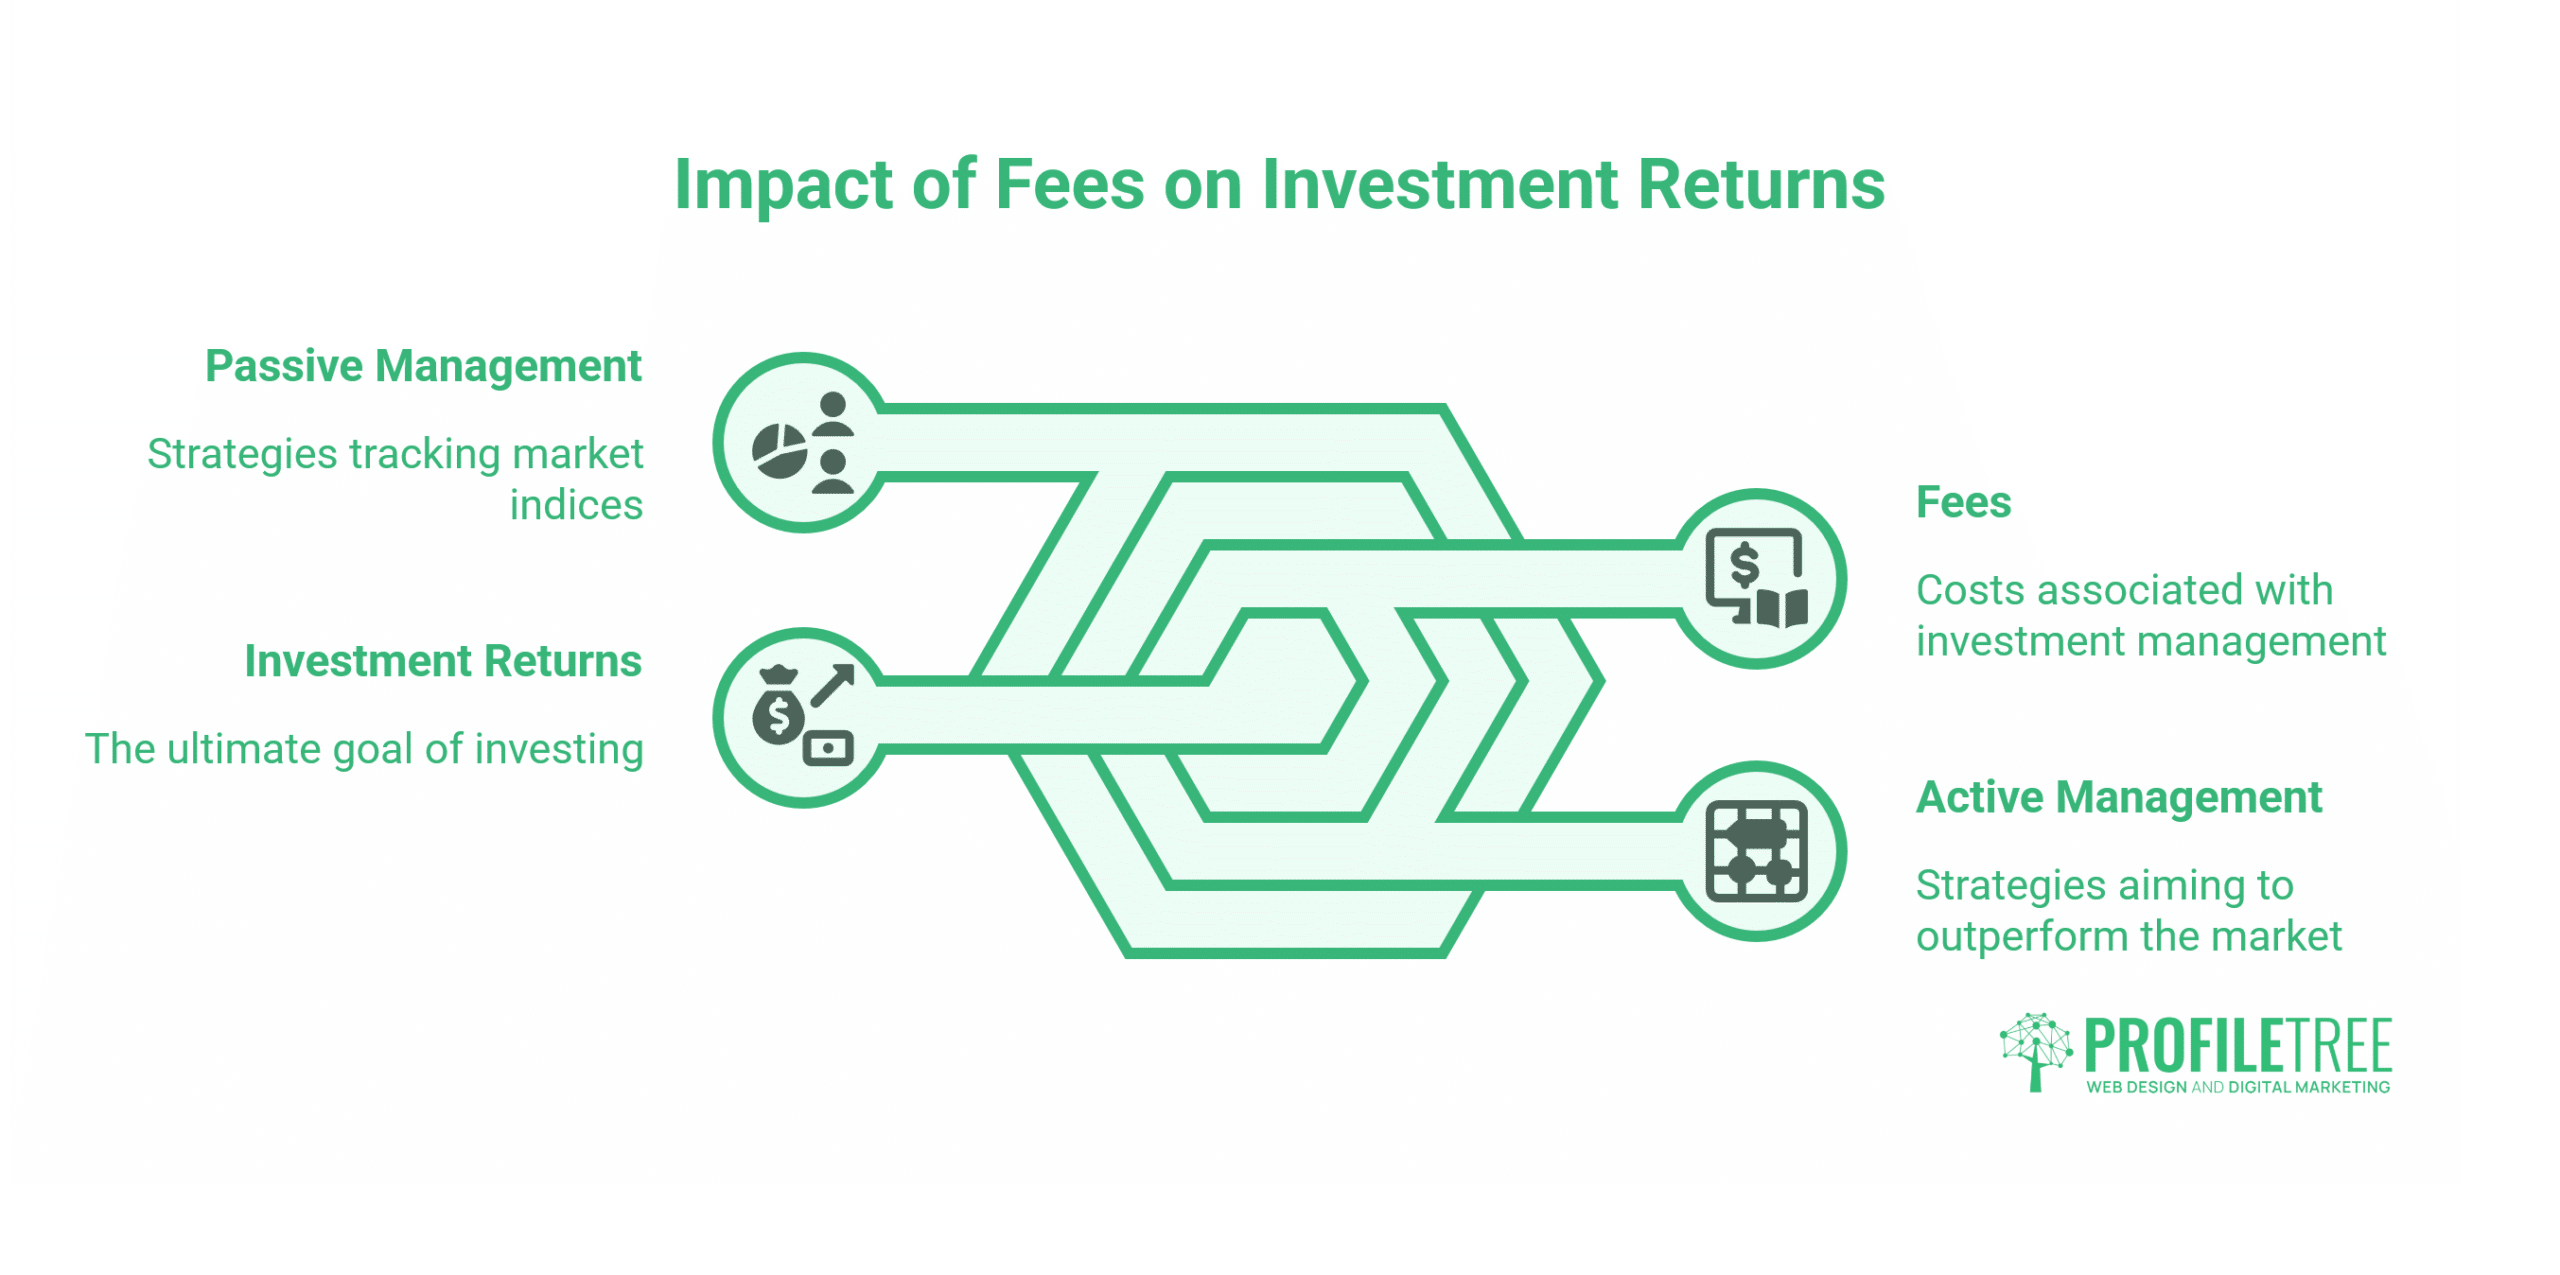
Fees are where the active-versus-passive debate becomes concrete. Understanding what you actually pay, and how those costs behave over time, matters more than most investors initially realise.
Ongoing Charges Figure (OCF)
The OCF is the standard cost metric for UK funds. It covers the fund management fee, administration costs, and other ongoing expenses, expressed as a percentage of assets per year. It does not include transaction costs or platform charges, which are separate.
For UK retail investors in 2024–25, typical OCFs run from 0.05% for basic tracker funds to 1.5% or more for specialist active strategies. The average OCF for UK active equity funds is around 0.8–1.0% according to Investment Association data; passive equivalents average 0.1–0.2%.
Transaction Costs
Active funds generate higher transaction costs because they trade more frequently. Each buy and sell order incurs costs, including broker commissions, bid-ask spreads, and market impact. These costs are not always fully visible in the headline OCF, which is why looking at the total cost of ownership matters.
For passive funds, transaction costs are minimal. The fund only trades when the underlying index changes its constituents, which happens infrequently.
The Compounding Effect of Fees
The impact of a 1% annual fee difference is not linear: it compounds. On a £100,000 portfolio over 25 years, assuming 6% annual returns before charges, the difference between a 0.1% and a 1.1% annual charge is substantial. The lower-cost portfolio ends up significantly larger because the fee savings compound alongside the investment return. This is why fee comparison matters as much as gross performance when evaluating active versus passive options.
The Hybrid Approach: Combining Active and Passive
The binary framing of “active or passive” overstates the choice most investors face. A growing number of portfolio managers and financial planners recommend a core-satellite structure: use low-cost passive funds to cover broad market exposure (the core), then allocate a smaller portion to active strategies where there is genuine evidence they can add value (the satellites).
This approach recognises that passive management wins on cost and consistency for large, efficient markets, while active management has a stronger case in less efficient segments, including smaller companies, specific geographic markets, and thematic strategies.
For a business owner thinking about their digital marketing budget, this framing is directly applicable. An always-on SEO strategy and a well-structured website that consistently earns traffic over time are the passive core: they compound value without constant intervention. Campaign-led activity, seasonal promotions, and paid media are the active satellites: higher cost, higher flexibility, targeted at specific opportunities.
AI and the Changing Nature of Active Management
Artificial intelligence is changing the economics of active management in ways that are only beginning to play out. Quantitative funds using algorithmic strategies have grown substantially, blurring the line between active and passive. These funds make rule-based decisions at high speed across large datasets, which is systematically active but not reliant on individual human judgment in the traditional sense.
Some of these AI-driven strategies charge lower fees than traditional active funds because the cost of running the algorithm is lower than the cost of a research team. The performance record of quant strategies is mixed, but the direction of travel is clear: decisions that once required expensive human expertise can increasingly be made by well-designed systems at lower cost.
This shift has a direct parallel for SMEs. Tasks that once required a full-time marketing manager, a dedicated data analyst, or an external agency can now be partially automated using AI tools that ProfileTree helps businesses implement and configure. Understanding the importance of data in AI implementation is the first step: AI systems are only as good as the data they run on, and businesses that invest in data quality before AI adoption get better results.
“The pattern we see with SMEs and AI is very similar to what happened with passive investing,” says Ciaran Connolly, founder of ProfileTree. “Business owners assume they need active human management of every process. Then they see how a well-configured AI system handles routine decisions faster, more consistently, and at lower cost, and the logic of delegating those decisions becomes obvious.”
Applying Active and Passive Logic to Business and Marketing Decisions
The active-versus-passive framework is genuinely useful for SMEs making resource-allocation decisions. The same evidence-based approach that favours passive investing for most retail investors supports a similar discipline in how business owners approach their digital marketing.
Content Marketing: Active vs Evergreen
Evergreen SEO content, well-researched articles that answer specific questions and earn organic traffic over time, functions like a passive investment. It compounds. A page that ranks well today continues to deliver traffic next year without additional spend. A paid social campaign runs while the budget is live and stops when it is switched off.
Most businesses underinvest in evergreen content relative to campaign activity because campaign results are more immediately visible. The evidence from long-term content performance data mirrors the investment statistics: the lower-cost, lower-visibility strategy tends to win over time.
Digital Marketing ROI: Seeing the Full Cost
One of the most common analytical errors in digital marketing mirrors the problem with active fund fees: business owners compare gross performance without accounting for management overhead. A paid media campaign might generate impressive top-line numbers, while the time cost of managing it, optimising creatives, and interpreting results adds a significant hidden charge. Our team explores this in detail in our guide to maximising ROI from digital marketing campaigns.
Decision-Making Under Uncertainty
Behavioural biases affect business decisions just as they affect investment choices. Overconfidence, familiarity bias, and loss aversion all appear in how SME owners allocate marketing budgets. Business owners who have always run a particular type of campaign tend to favour it even when the data does not support continuing with it. Our guide to decision-making covers structured frameworks that help reduce bias in business decisions.
Bringing more rigour to digital channel decisions, using clear metrics, consistent measurement periods, and honest comparisons of cost versus return, is the business equivalent of choosing a low-cost index fund over an actively managed one based on evidence rather than intuition.
Pros and Cons: A Structured Comparison
Both approaches have genuine merits depending on your circumstances, time horizon, and appetite for cost versus control. The evidence tilts clearly in one direction for most investors, but that does not mean active management has no place.
Active Management
Advantages: Can respond to changing conditions; potential to outperform in inefficient markets; personalised strategy tailored to specific objectives; human judgement in complex or unusual situations.
Disadvantages: Higher fees that compound over time; most active managers underperform benchmarks over long periods; dependent on the skill of individual decision-makers; higher transaction costs reduce net returns.
Passive Management
Advantages: Lower costs; consistent, predictable performance relative to the index; removes emotional decision-making; broad diversification; simpler to understand and monitor.
Disadvantages: Cannot outperform the market by design; no flexibility to avoid declining sectors; tracks the index, including its weakest components; in sharp market downturns, there is no defensive repositioning.
Conclusion
The statistics behind active and passive management tell a consistent story: for most investors, in most markets, over most time horizons, lower-cost systematic strategies outperform higher-cost discretionary ones. That conclusion holds not because active management is inherently flawed, but because the costs it must overcome are high and the edge it needs to find is consistently hard to sustain.
For business owners, the lesson is directly transferable. Building systems that deliver consistent results at lower ongoing cost, whether in SEO, content marketing, or AI-assisted operations, tends to outperform reactive, campaign-led activity over time. If you want to explore how a more evidence-based approach to digital strategy could work for your business, ProfileTree’s digital strategy and AI implementation team works with SMEs across Northern Ireland, Ireland, and the UK.
FAQs
What is the main difference between active and passive management?
Active management involves a manager making deliberate decisions to outperform a benchmark index, typically at a higher cost. Passive management tracks the index mechanically, aiming to match rather than beat market returns, at lower cost.
Is passive management safer than active management?
Neither is categorically safer. Passive funds carry full market risk: if the index falls, the fund falls with it, with no ability to reposition. Active funds carry manager risk in addition to market risk. For most long-term investors, the primary risk difference is cost rather than volatility.
Which performs better over the long term: active or passive management?
The evidence strongly favours passive for most investors. S&P Global’s SPIVA data consistently shows that more than 80% of active equity fund managers underperform their benchmark over ten years. The main reason is compounding costs, not a lack of skill among all active managers.
Why are passive funds cheaper than active funds in the UK?
Passive funds do not employ large research teams, trade infrequently, and do not need to pay for ongoing market analysis. Their ongoing charges figure (OCF) reflects this lower overhead. Active funds must charge enough to cover their research costs and, in many cases, a performance element on top.