
Conversion Rate Optimisation: The UK Business Guide
Table of Contents
Most businesses spend heavily on driving traffic to their websites. Fewer invest the same energy in what happens once visitors arrive. Conversion rate optimisation (CRO) addresses that gap by turning more of your existing traffic into leads, enquiries, or sales, without buying a single extra click.
This guide sets out how conversion rate optimisation works in practice, covering the research methods, testing approaches, and psychological factors that actually move the needle for UK businesses. It also addresses the compliance considerations that most CRO guides written outside the UK quietly ignore, and that you can’t afford to overlook.
What Is Conversion Rate Optimisation?
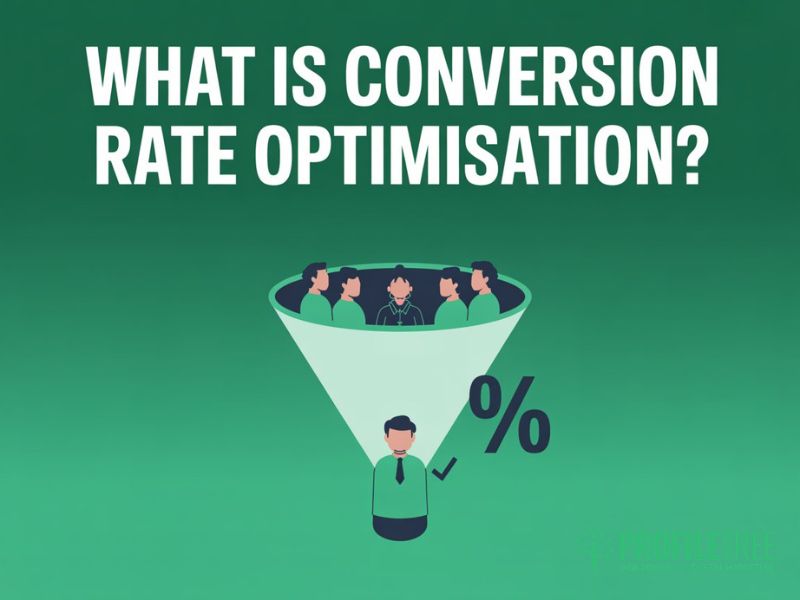
Conversion rate optimisation is the process of increasing the percentage of website visitors who take a desired action. That action could be completing a purchase, submitting an enquiry form, booking a call, downloading a resource, or signing up to a mailing list. Whatever outcome matters most to your business.
How to Calculate Conversion Rate
The formula is straightforward:
Conversion Rate (%) = (Number of Conversions ÷ Total Visitors) × 100
If your website receives 5,000 visitors per month and 100 complete an enquiry form, your conversion rate is 2%. The UK average for B2B websites sits around 2–3%, while e-commerce typically ranges from 1–4% depending on the sector. Understanding these benchmarks is the starting point for any conversion rate optimisation programme. Professional services sites tend to convert at the lower end of this range because the decision cycle is longer.
Macro vs Micro Conversions
Not every conversion carries equal weight. A macro conversion is your primary goal: a purchase or a qualified enquiry. Micro conversions are the smaller steps that lead there: a visitor adding a product to their basket, watching a video past the 50% mark, or downloading a product brochure. Tracking micro conversions gives you a detailed picture of user behaviour at each stage, telling you where in the journey visitors are dropping off before they reach the final step.
Why CRO Matters More Than Extra Traffic
Paid traffic costs money on every click. Organic rankings take months to build. Improving your conversion rate from 1.5% to 3% on an existing traffic base of 10,000 monthly visitors is the equivalent of doubling your traffic at no additional acquisition cost. That makes CRO one of the highest-return investments a business can make in its website.
The CRO Process: A Five-Step Framework
Sustainable conversion improvements come from a structured process, not guesswork. The following five-step cycle is the foundation of any credible conversion rate optimisation programme.
Step 1: Quantitative Research
Start with the numbers. Google Analytics 4 (GA4) shows you where visitors enter, where they exit, and how long they spend on each page. Set up funnel explorations to visualise the drop-off points between key steps: from landing page to enquiry form, or from product page to checkout. Pages with high exit rates and low engagement time are your first targets.
Key metrics to review at this stage include bounce rate by traffic source, time on page by device type, scroll depth, and the number of sessions it takes before a user converts. Mapping user behaviour across these dimensions lets you build a factual picture of where friction exists before you begin testing. For a structured introduction to the tools that support this work, see our overview of business analytics tools for SMEs. Segmenting by device is particularly important for UK businesses; mobile accounts for a growing share of B2B research, even when the final conversion happens on desktop.
Step 2: Qualitative Research
Numbers tell you what’s happening; qualitative research tells you why. User testing involves watching real people attempt to complete a task on your website: booking an appointment, finding a price, or submitting an enquiry. Even three to five sessions can surface friction points that no dashboard would reveal.
Exit surveys ask visitors who are about to leave a simple question: what stopped you from completing your task today? The answers are often blunt and useful in ways that analytics never are. Session recordings let you replay individual visits and observe user behaviour directly: seeing exactly where users hesitate, click repeatedly on non-clickable elements, or abandon a form halfway through.
Step 3: Building Hypotheses
Every test should begin with a clearly stated hypothesis. The structure that works consistently is:
Because we observed [data point or behaviour], we believe that changing [specific element] for [user segment] will result in [expected outcome], which we will measure by [metric].
For example: “Because we observed that 68% of mobile users exit the enquiry form before completing it, we believe that reducing the form from seven fields to three for mobile users will increase form completion rates, which we will measure by conversion rate on mobile devices.” A hypothesis that is specific and testable; a vague hunch that “the form looks too long” is not.
Step 4: Testing Execution
Once you have a hypothesis, choose the appropriate test type.
| Test Type | Complexity | Traffic Required | Best For |
|---|---|---|---|
| A/B Test | Low | Moderate | Single-element changes |
| Split URL Test | Medium | Moderate–High | Major design overhauls |
| Multivariate Test | High | High (10,000+ sessions) | Multiple simultaneous changes |
For most SME websites, A/B testing is the right starting point. Multivariate testing requires substantially more traffic to produce statistically significant results, and running it on a low-traffic site produces misleading data that can send your conversion rate optimisation efforts in the wrong direction.
Step 5: Post-Test Analysis and Iteration
A test result is only useful if you act on it. If the variation wins, roll it out and document what changed and why it worked. If the control holds, that’s also valuable: the hypothesis was wrong, and you now know more about your users’ behaviour. Either way, every test feeds the next cycle. Conversion rate optimisation has no finish line; it’s a continuous process of learning and refinement.
A/B Testing in Practice
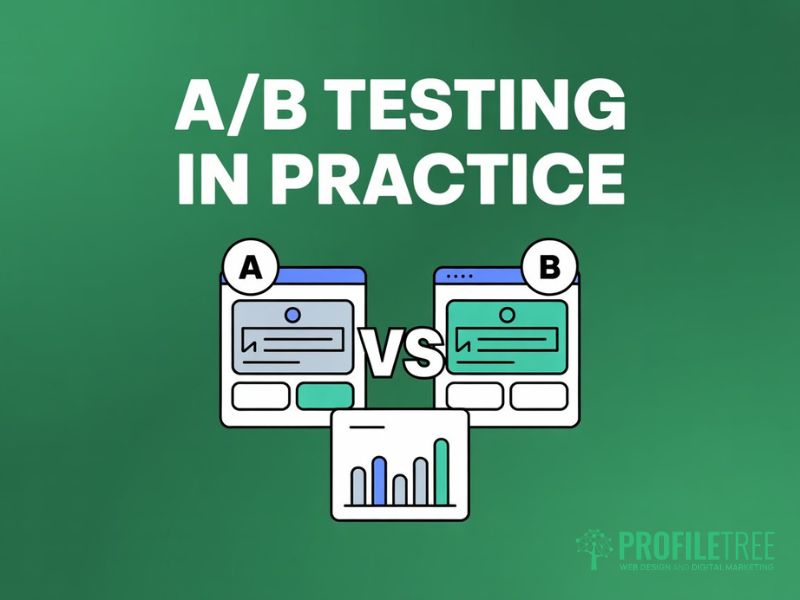
A/B testing compares two versions of a page or element to determine which performs better. One version (the control) remains unchanged; the other (the variation) incorporates the change you want to test. Traffic is split between the two, and the version that produces a higher conversion rate wins.
What to Test First
The highest-impact elements to test, in rough order of priority for most UK SME websites, are:
- Headlines and sub-headlines: these are the first things visitors read and often the first things they ignore
- CTA button copy and colour: “Get a free quote” tends to outperform “Submit” regardless of how the rest of the page reads
- Form length: every additional field reduces completion rates; test three-field against seven-field versions
- Trust signals: the placement of Google ratings, accreditation badges, and client logos affects both engagement and conversion
- Hero section layout on mobile: the stacked mobile view of a desktop-designed hero often buries the CTA below the fold
Statistical Significance
A test result is only meaningful if it’s statistically significant: if the probability that the result happened by chance is low enough to trust. The standard threshold is 95% confidence. Most A/B testing tools automatically calculate statistical significance, but this requires a sufficient sample size. Running a test for 48 hours on a low-traffic site and declaring a winner is one of the most common mistakes in conversion rate optimisation work.
As a practical rule, run every A/B test for a minimum of two full business weeks, regardless of when statistical significance is reached. This accounts for day-of-week patterns in user behaviour that would otherwise skew your results and produce a misleading read of the data.
Tools for A/B Testing
Several tools make A/B testing accessible without requiring developer resources for every experiment. Google Optimise was discontinued in 2023; its replacement functionality now sits within GA4’s experiments feature. If you’re setting up GA4 for the first time, our guide to using Google Analytics for content performance covers the core setup steps. Other widely used platforms include Optimizely, VWO, and AB Tasty. When selecting a tool, prioritise those with visual editors for non-technical teams, built-in statistical calculators, and native integration with your analytics platform.
Heatmaps and Behavioural Analytics
Heatmaps translate raw interaction data into a visual overlay of your page, making user behaviour immediately readable. Where analytics give you numbers, heatmaps give you a picture of where attention goes, and where it doesn’t. The three main types each reveal a different dimension of user behaviour:
- Click heatmaps: show where users click, tap, or interact; useful for identifying elements users expect to be clickable but aren’t
- Move heatmaps: show where the mouse travels across the page, which correlates with where users are reading on desktop
- Scroll heatmaps: show how far down the page visitors scroll before leaving; critical for understanding whether key messages and CTAs are being seen at all
On most standard business websites, scroll heatmaps reveal that a significant proportion of mobile visitors never scroll past the hero section. If your main CTA sits below a large introductory paragraph, this single finding can justify a restructure.
Reading Heatmap Data
Bright red areas indicate high activity; blue areas indicate low activity. The goal is not simply to maximise clicks everywhere, but to confirm that the interactions happening match the intent of each page. A click heatmap that shows heavy activity on a non-clickable product image suggests visitors expect to enlarge or interact with it; that is a design gap worth closing.
Session recording tools such as Hotjar or Microsoft Clarity complement heatmaps by letting you watch individual sessions. Look for rage clicks (repeated tapping on an element that isn’t responding), U-turns (visiting a page and immediately going back), and long pauses before form fields. These behaviours indicate friction that aggregate data cannot capture.
Combining Heatmaps with A/B Testing
Heatmaps are diagnostic; A/B tests are confirmatory. Use heatmap and session recording data to form a hypothesis, then use an A/B test to confirm whether the change you propose actually improves conversion rates. Without the test, you’re guessing. Without the heatmap, you’re testing blindly. Together, they make the CRO process materially more efficient.
UK GDPR, PECR, and Ethical Data Collection

Most CRO guides are written with a US audience in mind, and they largely ignore the data compliance context in which UK businesses operate. This is a significant gap: UK GDPR and PECR directly affect what conversion rate optimisation data you can legally collect, how you store it, and how long you can retain it.
What PECR Means for CRO
The Privacy and Electronic Communications Regulations (PECR) govern cookie use in the UK. Any cookie that is not strictly necessary for the service to function (and that includes most analytics and tracking cookies) requires explicit, freely given, informed user consent before it is set. This means:
- Heatmap tools that use cookies must be covered by a consent mechanism that users can meaningfully decline
- A/B testing platforms that set cookies without consent are non-compliant, regardless of how anonymised the data appears
- Pre-ticked consent boxes, consent bundled with terms of service, and “by continuing to use this site, you agree” notices are not compliant
The practical consequence for CRO is that your analytics data may undercount a meaningful proportion of users (typically those who decline cookies). This needs to be factored into how you interpret test results and draw conclusions from heatmap data. It’s a problem that won’t go away as consent rates continue to fall.
Testing Without Cookies
Server-side tracking collects interaction data without relying on client-side cookies, which makes it substantially more PECR-compliant and gives a more complete picture of actual traffic than consent-gated client-side tools. If a significant share of your audience declines cookies (which tends to be higher among B2B and professional audiences), it’s worth the technical investment in server-side collection.
First-party data is your most compliant and reliable CRO asset. Data collected directly from users through surveys, signed-in account behaviour, and form interactions with proper consent is not subject to the same limitations as cookie-based tracking.
Building Trust Through Compliance
For UK businesses, UK GDPR and PECR compliance is not just a legal requirement; it is also a trust signal. Visitors who see a well-designed, genuinely informative cookie consent mechanism are more likely to trust the site in general. A dark pattern that tries to manipulate users into accepting all cookies tends to erode exactly the credibility that conversion optimisation is trying to build.
Psychological Triggers for UK Consumers
Conversion rate optimisation goes beyond the technical. User behaviour is shaped by psychology, and understanding what makes UK consumers more or less likely to take action is a genuine competitive advantage.
Trust Signals That Work in the UK
UK consumers respond to particular forms of social proof that may have less weight in other markets. Google reviews with star ratings are widely trusted because they are perceived as harder to fabricate than testimonials on a company’s own site. Trustpilot carries credibility in sectors such as finance, insurance, and e-commerce. Professional body memberships, certifications, and local business associations signal that a company is established and accountable.
For B2B audiences, case studies with specific, verifiable outcomes consistently outperform general testimonials. A client from a recognisable Belfast institution saying “ProfileTree helped us improve our website’s organic enquiries by 40%” is more persuasive than a glowing five-word review.
Understanding what drives trust in your specific audience is something AI tools are increasingly being used to support. Our overview of how AI can improve your website’s user experience covers practical applications relevant to UK businesses.
CTA Copy and the Politeness Consideration
UK audiences often respond less favourably to high-pressure, American-style CTA language. Phrases like ‘Act now, limited time only’ can feel aggressive in a B2B context where the purchasing decision involves multiple stakeholders and a longer consideration period. More measured alternatives such as ‘See how it works’, ‘Request a walkthrough’, or ‘Get a tailored quote’ tend to perform better in professional services and technology sectors.
This doesn’t mean being passive. Clear, direct action language still outperforms vague copy. ‘Talk to our team today’ is specific and direct without feeling like a hard sell. Test the framing of your CTAs before assuming the US-standard version will work for a UK audience.
Reducing Perceived Risk
One of the most consistent findings across CRO work with UK B2B clients is that perceived risk is often a greater barrier than price or interest. Visitors may want the service, but they’re uncertain about commitment, contract length, or whether the solution will actually work for their business. Risk-reduction language (no long-term contracts, free initial consultation, money-back guarantees where appropriate) can shift hesitant visitors from browsing to enquiring.
CRO Tools for UK Businesses

Selecting the right tools depends on your budget, technical capability, and traffic volume. The following covers the core categories for conversion rate optimisation rather than producing a ranked list that would date quickly.
| Category | Tools | Best For |
|---|---|---|
| Behavioural Analytics | Hotjar, Microsoft Clarity, FullStory | Heatmaps, session recording, user feedback |
| A/B Testing | Optimizely, VWO, AB Tasty, GA4 Experiments | Testing page variants and tracking conversion lift |
| Web Analytics | Google Analytics 4, Plausible Analytics | Quantitative data, funnel analysis, traffic segmentation |
| User Research | Hotjar Surveys, Typeform, UserZoom | Exit surveys, post-conversion feedback, user testing |
Microsoft Clarity deserves a specific mention: it is free, provides unlimited session recordings and heatmaps, and integrates directly with GA4. For businesses working within tight budgets, it gives access to most of the behavioural analytics capabilities of paid platforms at no cost. The trade-off is a less polished interface and fewer advanced segmentation options.
Starting Your Conversion Rate Optimisation Programme
Conversion rate optimisation isn’t a one-time project. The businesses that see sustained results treat it as an ongoing cycle: gather data, form a hypothesis, test, learn, and repeat. Every iteration builds a clearer picture of how your specific audience behaves and what moves them to act.
The starting point doesn’t need to be complicated. Review your GA4 funnel data to find the page with the highest drop-off. Run a scroll heatmap to see how far visitors are getting. Form one testable hypothesis. Run it for two weeks. That single cycle, repeated consistently, is how meaningful conversion rate improvements are built.
For UK businesses, the compliance layer matters too. Building your CRO programme on first-party data and server-side tracking from the outset puts you in a stronger position as UK GDPR and PECR enforcement continues to tighten. It also tends to produce more accurate data, which means better decisions.
If you’d like ProfileTree to carry out an initial review of your website’s conversion performance, our team works with businesses across Northern Ireland, Ireland, and the UK to identify where visitors are dropping off and what testing would have the highest impact. Get in touch to start the conversation.
FAQs
1. How do you calculate conversion rate?
Divide the number of conversions by the total number of visitors, then multiply by 100. If 200 people visit a page and 6 submit an enquiry, the conversion rate is 3%. Most analytics platforms, including GA4, calculate this automatically once you have set up conversion events correctly.
2. What is a good conversion rate for a UK business website?
It depends on the sector. UK e-commerce typically achieves 1–4%, with fashion and beauty at the higher end and large-ticket items at the lower end; B2B professional services generally sit at 1–3% because decision cycles are longer. If your rate sits below 1% on a page designed for enquiries, that is a clear signal to investigate.
3. How long should an A/B test run?
A minimum of two full business weeks, regardless of when statistical significance is reached. Achieving statistical significance too early, on a small sample, is one of the most common mistakes in conversion rate optimisation; the result looks decisive but is driven by a skewed subset of your audience. If your site receives fewer than 1,000 sessions per week on the page being tested, you may need to run the test for four to six weeks to gather a reliable sample.
4. Can you do CRO without cookies?
Yes, and increasingly UK businesses should plan for exactly that. UK GDPR and PECR compliance means a growing share of visitors will decline cookie consent, making client-side tracking data incomplete; server-side tracking collects interaction data without this limitation, giving a more complete picture of actual user behaviour. First-party data collected through forms, surveys, and signed-in user sessions is fully compliant and often more actionable than cookie-based data.
5. What is the difference between CRO and SEO?
SEO brings more visitors to your website; conversion rate optimisation converts more of the visitors you already have. The two are complementary: SEO addresses visibility and traffic volume, while CRO determines what happens after the click. For a deeper look at how the two work together, see our SEO guide for UK businesses; a site that ranks well but converts poorly is wasting the value of its organic search performance.