
Google Analytics for Content Marketing and SEO Reporting
Table of Contents
Most businesses set up Google Analytics, glance at the traffic graph once a month, and leave the rest untouched. That’s a problem. Google Analytics 4 (GA4) contains enough data to tell you which content is driving organic growth, which pages are converting visitors into enquiries, and where your SEO investment is actually paying off, but only if you know where to look and how to build the right reports.
This guide covers the advanced Google Analytics techniques that content marketers and business owners in the UK and Ireland need to get real, actionable insight from GA4, from linking Google Search Console through to building custom reports and understanding why your data may not be telling the full story.
Why GA4 Changed How You Report on Content and SEO
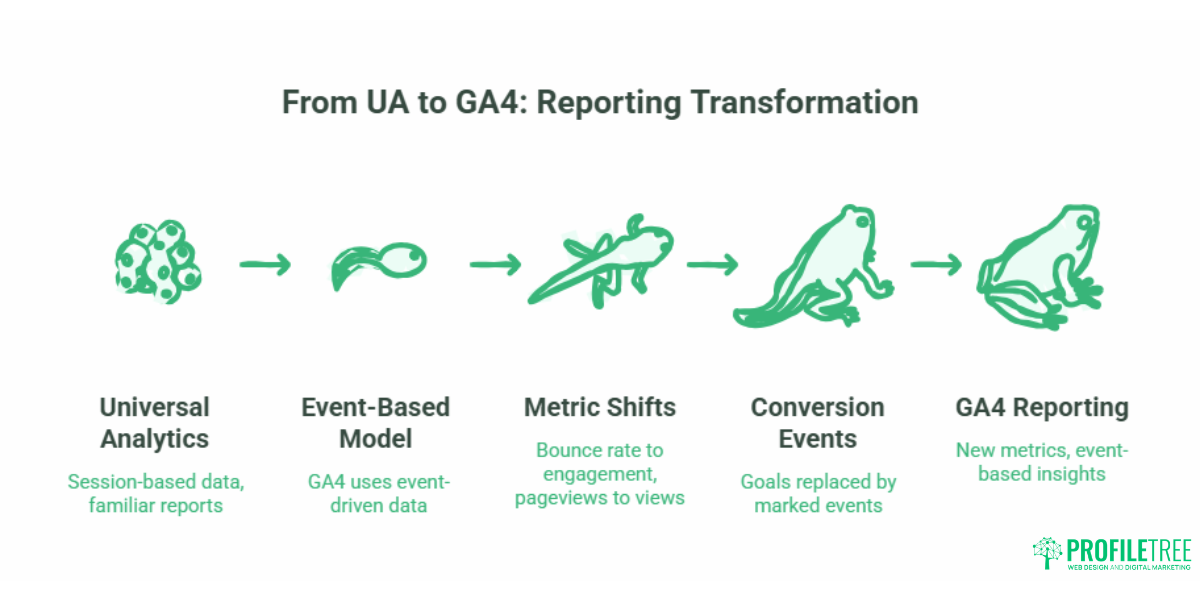
Google replaced Universal Analytics with GA4 in July 2023. If your business was still running UA when that happened, you lost historical data continuity, and many of the reports you relied on no longer exist in their previous form.
The shift matters because GA4 uses an event-based data model rather than the session-based model of Universal Analytics. In practice, this means standard metrics you may have tracked for years, including bounce rate, no longer work the same way.
UA vs GA4: The Metric Shifts That Matter
Here is a quick reference for the most important metric changes:
| Universal Analytics Metric | GA4 Equivalent | What Changed |
|---|---|---|
| Bounce Rate | Engagement Rate | The calculation now ties to users, not sessions. |
| Pageviews | Views | The calculatio,n now ties to users, not sessions. |
| Unique Pageviews | Active Users per page | GA4 counts all views, including repeat views, within a session. |
| Goals | Conversion Events | Goals are replaced by marking specific events as conversions. |
| Sessions | Sessions (event-based) | Sessions now reset at midnight regardless of activity, changing session counts for late-night traffic. |
Understanding these differences is not optional. If you are comparing GA4 data to old UA benchmarks, you will draw the wrong conclusions about whether your content is performing better or worse.
Step 1: Linking Google Search Console to GA4
This is the single most important configuration step for SEO and content reporting. Without it, GA4 cannot show you which search queries are driving organic traffic to your pages.
To link Google Search Console to GA4:
- In GA4, go to Admin (the cog icon, bottom left).
- Under the Property column, select Search Console Links.
- Click the link, then choose accounts to select your verified GSC property.
- Select the data stream you want to link (your website) and confirm.
The linkage takes 24 to 48 hours to begin populating data.
Publishing the GSC Report in Your GA4 Library
After linking, the Search Console reports are not visible in the left-hand navigation by default. This is one of the most common points of confusion. You need to publish the collection manually:
- In GA4, go to Reports in the left menu.
- Scroll to the bottom and click Library.
- Find the Search Console collection and click the three-dot menu.
- Select Publish to report navigation.
The Search Console section (showing organic queries and landing pages) will now appear under Reports. For SMEs who want to understand how Google Analytics tools strengthen the SEO and content marketing relationship, this is where that connection becomes visible: you can see search queries, landing page performance, and organic click data all in one place.
For a thorough set-up of your Search Console properties before linking, see the guide to SEO for UK businesses.
Step 2: Building Your Organic Content Reports in GA4
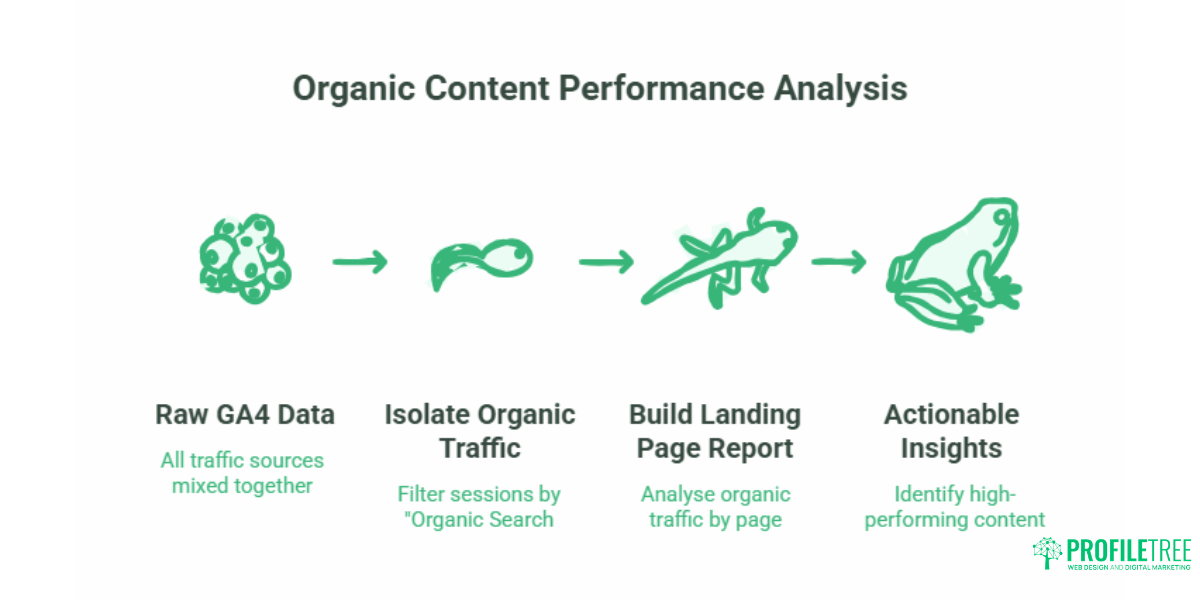
Once Search Console is linked and published, you can start building the reports that actually tell you how your content is performing in organic search.
Isolating Organic Search Traffic
Navigate to Reports > Acquisition > Traffic Acquisition. The default view shows all traffic sources. To isolate organic search:
- Click Add filter at the top of the report.
- Set the dimension to the Session default channel group and the value to Organic Search.
You can now see sessions, engaged sessions, engagement rate, and conversions attributed specifically to organic traffic.
Building an Organic Landing Page Report
The Traffic Acquisition report tells you how much organic traffic you receive. To see which pages are receiving it:
- Go to Reports > Engagement > Pages and Screens.
- Add the same organic search filter described above.
- Sort by Views or Active Users descending.
This report shows you which content pieces are doing the most work in organic search. Compare engagement rate and session conversion rate across landing pages to identify which articles are attracting organic visitors and converting them, and which are attracting traffic but losing it immediately.
This kind of content performance analysis sits at the core of any serious content marketing strategy. If you want external support in interpreting and acting on this data, ProfileTree’s digital marketing strategy services include regular analytics reviews for SME clients across Northern Ireland, Ireland, and the UK.
Step 3: What UK and Irish Businesses Need to Know About Data Loss
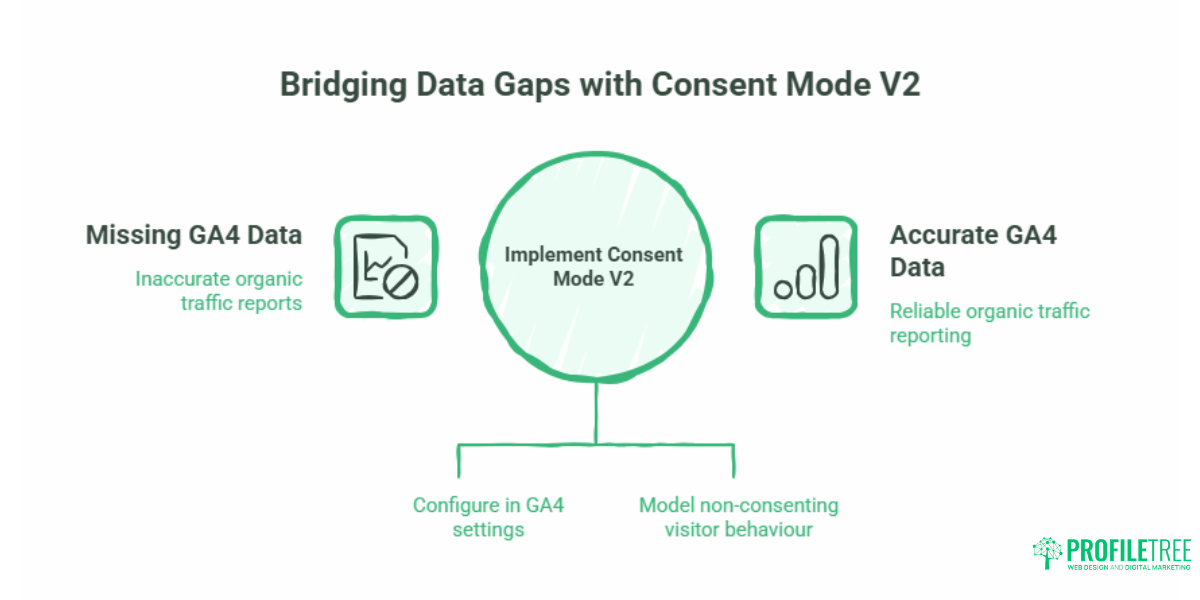
This is the section most guides skip. If your website uses a cookie consent banner (which it should, under UK GDPR and European ePrivacy regulations), and a meaningful percentage of your GA4 data may be missing.
When a visitor declines cookie tracking, their session is not recorded in GA4 at all unless you have configured Consent Mode V2. Research from GA4 implementation specialists indicates that consent opt-out rates of 20–40% are common on UK and Irish websites, particularly in sectors where users are privacy-conscious (financial services, healthcare, legal).
How Cookie Consent Affects Your Content Reports
Without Consent Mode V2, your organic traffic data has a systematic gap. If 30% of your visitors decline cookies, your GA4 reports show roughly 70% of your actual traffic. This means:
- Your top organic landing pages look less popular than they are.
- Your engagement rate calculations are based on a non-representative sample.
- Conversion data underestimates actual organic-driven enquiries.
The problem is not the consent banner itself (that is a legal requirement). The problem is the absence of behavioural modelling to fill in what is missing.
Activating Consent Mode V2 and Behavioural Modelling
Consent Mode V2 allows GA4 to send anonymised pings when a user declines tracking. Google’s machine learning then uses these pings, alongside data from consenting users, to model the likely behaviour of non-consenting visitors. This does not recover individual-level data; it produces statistical estimates that make your aggregate reporting far more accurate.
To check whether Consent Mode is active on your site:
- In GA4, go to Admin > Data Streams > [your stream] > Configure Tag Settings > Consent Mode.
- If it shows “Not Configured”, your site is operating with unmodelled data gaps.
Implementing Consent Mode V2 correctly requires changes to your Google Tag Manager setup or your cookie consent platform. For SMEs managing this in-house for the first time, ProfileTree’s digital training programmes cover GA4 configuration in practical, business-focused sessions.
Ciaran Connolly quote required here: suggested angle: the shift from reading exact figures to reading trends and modelled data; how modern analytics requires comfort with statistical estimation rather than absolute numbers. Flag for Ciaran’s approval before publication.]
Step 4: Advanced Google Analytics Techniques: Custom Explorations
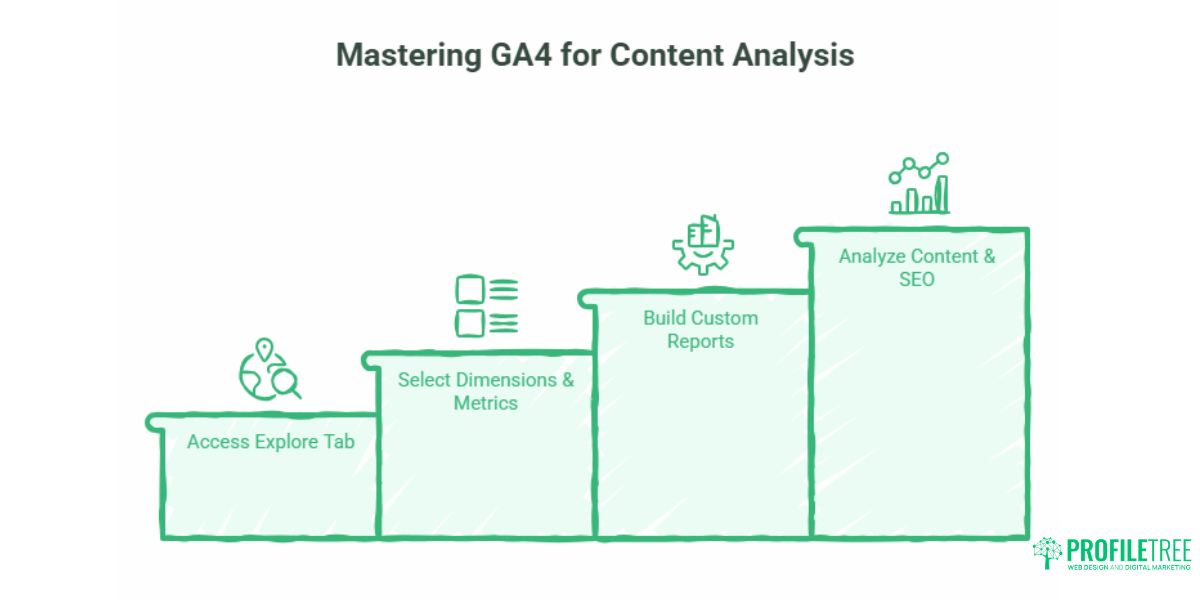
The standard reports in GA4 are fine for a monthly overview. For genuine content and SEO analysis, the Explore tab is where the advanced Google Analytics techniques live.
Explorations let you build fully custom reports using any combination of dimensions and metrics, with no filters or sampling constraints imposed by the standard reporting UI.
Building an Organic Entry Points Report
This exploration shows you which pages organic visitors land on first, and what they do next:
- Go to Explore in the left navigation.
- Create a Blank exploration.
- In the Dimensions panel, add: Landing page + query string, Session source/medium, Country.
- In the Metrics panel, add: Sessions, Engaged sessions, and Session conversion rate.
- Drag the Landing page into Rows and your chosen metrics into Values.
- Apply a segment filtering for Organic traffic only.
The result is a custom report showing every organic landing page, with conversion rate data, that the standard reports do not surface cleanly.
Setting Up a Keyword Queries Report
To see which search queries are driving traffic to specific pages:
- In Explore, create a new Free-form report.
- Add the Search term dimension (from the Search Console data import).
- Add a landing page as a secondary dimension.
- Add metrics: Clicks (GSC) and Sessions (GA4).
This table shows you the queries that bring people to each piece of content, and lets you compare GSC click data against GA4 session data side by side. Which brings us to a question that trips up almost every SME marketing team doing this for the first time.
Why Google Search Console and GA4 Numbers Never Match
If your Search Console shows 500 clicks to a page last month and GA4 shows 380 organic sessions, something has gone wrong. Or has it? Actually, this discrepancy is normal, and understanding it matters for anyone presenting analytics to stakeholders.
Here is a clear breakdown of why the numbers differ:
| Factor | Google Search Console | GA4 |
|---|---|---|
| What is counted | Clicks on your search result | Sessions that trigger your GA4 tag |
| Cookie opt-outs | All clicks counted | Unconsented visits not counted (without Consent Mode V2) |
| Bot and crawler traffic | Excluded | Some may be counted |
| Data latency | 2–3 days | Near real-time |
| PDF and non-HTML pages | Included if in index | Not tracked by default |
| Session attribution | N/A | Can be overridden by UTM parameters |
The practical rule: treat GSC data as your source of truth for search performance (impressions, clicks, positions), and GA4 as your source of truth for on-site behaviour (engagement, conversions, user flow).
For a consistent reporting framework that integrates both, ProfileTree’s content marketing services include monthly reporting dashboards that draw from both sources, presented clearly for non-technical stakeholders.
Step 5: Automating Your SEO Reporting with Looker Studio
If you are producing monthly content or SEO reports for a team or client, running manual exports from GA4 every month is a poor use of time. Looker Studio (formerly Google Data Studio) connects directly to both GA4 and Google Search Console, pulling live data into a shareable dashboard that updates automatically.
A practical SME setup in Looker Studio for content and SEO reporting should include:
- Organic traffic trend (GA4 source: Sessions filtered by Organic Search, over 13 months)
- Top organic landing pages (GA4 source: Pages and Screens, organic filter)
- Search queries and positions (GSC source: Queries report)
- Engagement rate by page (GA4 source: Pages and Screens)
- Conversion events from organic (GA4 source: Conversions, organic filter)
- UK/regional traffic split (GA4 source: User attributes: Country/Region)
This setup replaces the manual in-and-out of the GA4 interface with a single URL you can bookmark and share.
For SMEs whose marketing teams want to build and manage these dashboards themselves, GA4 and digital analytics training from ProfileTree covers the practical build process from scratch.
What Good Content Looks Like in GA4
Once your reporting infrastructure is in place, use it. The metrics that matter most for evaluating content marketing performance in GA4 are not the same ones most marketers default to.
Engaged sessions over sessions. A page with 500 sessions and a 70% engagement rate is performing better than one with 1,000 sessions and a 25% engagement rate. Chasing raw traffic numbers without checking quality leads to bad content decisions.
Session conversion rate by landing page. Which organic landing pages result in enquiry form submissions, phone call clicks, or other conversion events? This is the direct line between your content investment and commercial outcome.
Scroll depth events. GA4 fires a scroll event automatically when a user reaches 90% of a page. Compare this figure across your content pieces. If you have a 2,000-word article where only 12% of users hit 90% scroll depth, either the content is not delivering on its opening promise or the page structure needs attention.
New vs returning users from organic. Organic traffic should skew towards new users (people finding you for the first time). If a high proportion of organic visitors are returning, your content may be resonating well with existing customers, but it’s worth checking whether new audience growth has stalled.
Understanding these patterns is at the core of what ProfileTree does when auditing content performance for SME clients. If you’d like a review of what your current content is actually delivering, our SEO services include an analytics audit as part of the initial assessment.
Frequently Asked Questions
Can Google Analytics 4 track organic keywords?
GA4 alone cannot show you which keywords are driving organic traffic, because Google withholds this data to protect user privacy. Most organic keyword data appears as “(not provided)” in standard GA4 reports. However, linking Google Search Console to GA4 gives you access to a Queries report under the Search Console collection, which shows the actual search terms users typed before clicking through to your site. This is why the GSC linkage covered in Step 1 is not optional: it is the only way to see keyword-level organic data inside GA4.
Why does my organic traffic look different in Google Search Console versus GA4?
The two tools measure different things. Google Search Console counts clicks on your result in the search engine results page. GA4 counts sessions, meaning your tracking tag must fire successfully on the landing page. Visits from users who decline cookies (without Consent Mode V2), bot traffic filtered differently across the two platforms, and PDF pages indexed in GSC but not tracked in GA4 all contribute to the discrepancy. The gap is normal; a 15–30% difference is common on UK websites with consent banners.
How do I fix the “(not set)” landing page error in GA4 reports?
“(not set)” in landing page reports usually means a session started without a page_view event firing. This can happen when: your GA4 tag fires with a delay and the user navigates away before it loads; there is a custom event configuration that starts a session without an associated page view; or GA4 is applying data thresholding on low-traffic segments, hiding specific rows to protect user privacy. To investigate, go to Admin > Reporting Identity and switch from “Blended” to “Observed” to reduce thresholding effects on your reports.
Is GA4’s engagement rate the same as the old bounce rate?
No, they measure opposite things. Bounce rate in Universal Analytics measures the percentage of sessions where a visitor leaves without triggering a second hit. Engagement rate in GA4 measures the percentage of sessions where the visitor stayed 10 or more seconds, viewed two or more pages, or triggered a conversion event. A 70% engagement rate in GA4 broadly corresponds to a 30% bounce rate in UA terms. Do not compare the two numbers directly.
Does GA4 data thresholding affect content marketing reports?
Yes. If you run reports filtered to small audience segments, for example, organic traffic from Northern Ireland only, or organic traffic from a specific device type, GA4 may apply thresholding and hide individual rows to prevent identifying individual users. This makes the total numbers look artificially low. The workaround is to change your Reporting Identity in Admin settings from “Blended” to “Observed only”, which reduces (but does not eliminate) thresholding on lower-traffic segments.
Do I need Looker Studio to report on content and SEO performance?
You can run all the reports described in this guide inside GA4 directly. Looker Studio is not required, but it is strongly recommended for anyone producing regular reports for a team or external stakeholders. It connects GA4 and Search Console data into a single shareable dashboard, removes the need to rebuild reports manually each month, and presents data in a much cleaner format for non-technical readers. Building a basic Looker Studio SEO dashboard takes two to three hours the first time; after that, it updates automatically.
Conclusion
GA4 rewards businesses that go beyond the default reports. The combination of Search Console linkage, Consent Mode V2 configuration, custom Explorations, and a Looker Studio dashboard gives any SME content team a reporting setup that is both accurate and actionable. The data is there; the question is whether the setup is in place to surface it properly. If you want support getting that infrastructure right, ProfileTree’s digital marketing team works with SMEs across Northern Ireland, Ireland, and the UK to turn analytics access into a genuine competitive advantage. nel performance.