Hotjar Heatmaps: How to Read and Act on Your Website Data
Table of Contents
Most business owners know their website isn’t working as well as it could. Bounce rates are high, enquiries are low, and the contact page isn’t getting the traction it should. But pinpointing the actual cause is where things get difficult. That is where using heatmaps with Hotjar becomes genuinely useful.
Hotjar is a behaviour analytics platform that overlays your website with colour-coded maps showing how real visitors interact with each page. Rather than staring at numbers in a spreadsheet, you see directly where people click, how far they scroll, and which parts of your page they ignore entirely. For SMEs across Northern Ireland, Ireland and the UK, this kind of data can be the difference between a website that generates enquiries and one that quietly haemorrhages potential customers.
“The businesses that get the most from tools like Hotjar are the ones that treat heatmap data as the start of a conversation, not the end of one,” says Ciaran Connolly, founder of ProfileTree. “The map tells you there’s a problem. Your job is to work out why.”
This guide covers everything you need to know about using heatmaps with Hotjar practically: what the different heatmap types reveal, how to use them when you don’t have massive traffic volumes, and how to turn observations into changes that actually improve your site’s performance.
What Is a Hotjar Heatmap?
A Hotjar heatmap is a visual representation of user behaviour on a single page of your website. It uses a colour spectrum (warmer colours like red and orange for high-activity areas, cooler colours like blue for low-activity areas) to show how visitors are interacting with the page.
Hotjar generates heatmaps by collecting data from real visitor sessions via a small tracking script installed on your website. Once it has gathered enough sessions, it overlays that data onto a snapshot of your page, giving you an at-a-glance picture of what’s working and what isn’t.
Using heatmaps with Hotjar is particularly valuable in three scenarios: when you have redesigned a page and want to check whether users are behaving as expected, when a high-traffic page has a low conversion rate, and when you’re planning a redesign and want evidence to guide your decisions.
The Three Core Heatmap Types
| Heatmap Type | What It Tracks | What It Reveals |
|---|---|---|
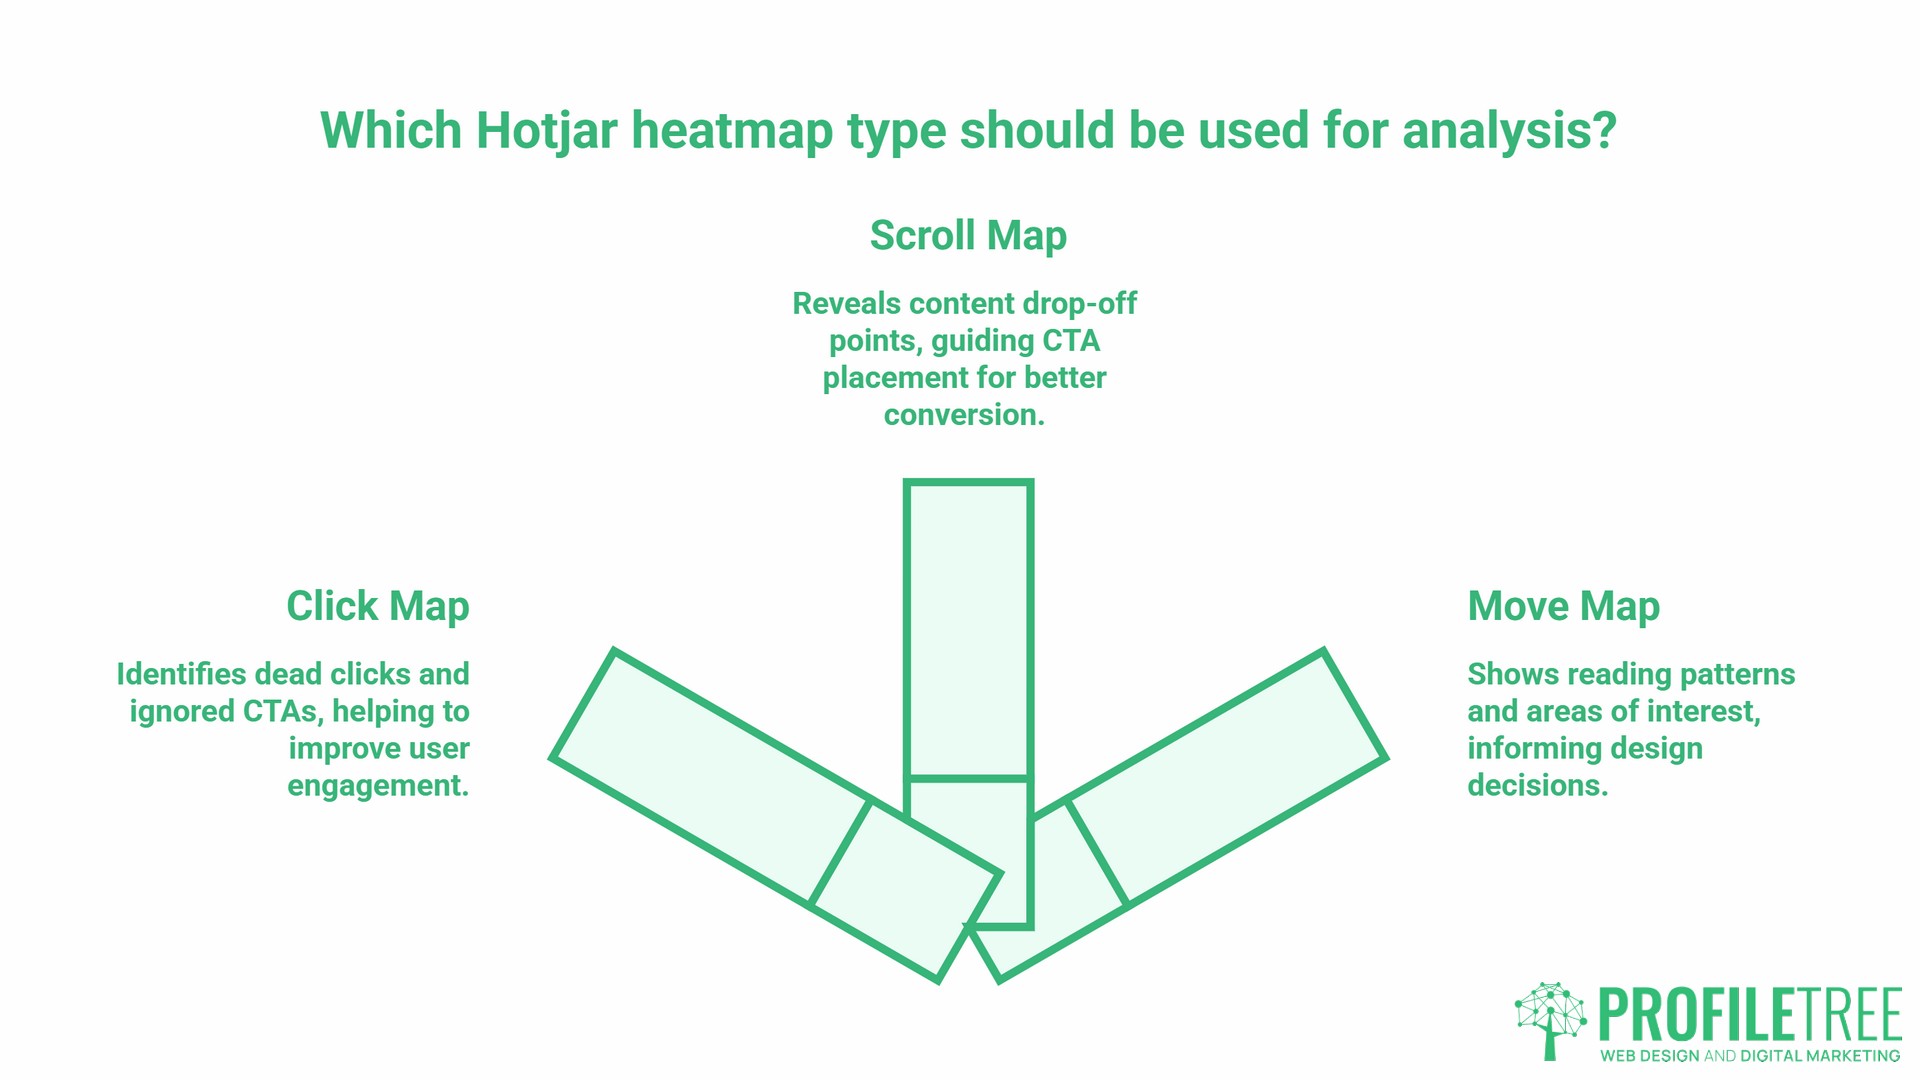
| Click Map | Where users click (or tap on mobile) | Dead clicks, ignored CTAs, navigation confusion |
| Scroll Map | How far down the page users scroll | Content drop-off points, CTA placement issues |
| Move Map | Where the mouse cursor moves on desktop | Reading patterns, areas of hesitation or interest |
Each type serves a different diagnostic purpose. Using all three together gives you a much fuller picture than any one alone.
Click Maps: Finding Dead Clicks and Ignored CTAs
When using heatmaps with Hotjar, the click map is usually the first place to look. It shows every point on your page where visitors have clicked during the tracking period. High-activity areas appear in red or orange; areas that receive little attention appear in blue or are not overlaid.
What to Look For
Dead clicks are clicks on elements that are not actually links. When visitors click on an image, a piece of bold text, or a graphic that looks like a button but does nothing, they’re telling you they expected that element to be interactive. This creates frustration and interrupts the user journey. The fix is usually straightforward: either make the element clickable and link it somewhere relevant, or remove the visual cue that’s misleading users.
Ignored CTAs are the opposite problem. If your primary call-to-action button is sitting in cool colours on the click map, users are not engaging with it. This could mean it’s placed too low on the page, doesn’t stand out visually, or the copy on the button isn’t compelling enough. When ProfileTree audits a web design before a rebuild, click map data from the existing site often confirms what common sense already suggests: CTAs buried halfway down the page get far fewer clicks than those visible without scrolling.
Navigation patterns on click maps also show whether users are finding what they’re looking for through your menu. If secondary navigation items are consistently outclicking your primary ones, your information architecture may need revisiting.
Scroll Maps: Finding Where Your Page Loses People
The scroll map is among the most telling outputs you get from using heatmaps with Hotjar. It shows what percentage of visitors reach each point on a page. The top of the page is always the warmest. As you move down, the colours cool, showing where visitors are dropping off.
The Fold Problem
The “fold” is the point on a page where content disappears below the visible screen before a visitor scrolls. Scroll map data helps you understand where your fold actually sits for most visitors, and this varies significantly across device types. Hotjar lets you filter heatmaps by device, which is important: your fold on a 27-inch monitor is nowhere near the same as on a mobile.
If your scroll map shows that 70% of visitors are dropping off before they reach your main service description or testimonials section, you have two options: move that content higher up, or improve the content above the fold to give visitors a stronger reason to keep scrolling.
Using Scroll Maps for Content Strategy
Scroll depth data is directly relevant to content marketing decisions. If you can see that visitors consistently stop reading around the third section of a blog post, that is a signal about content quality, structure, or length. It may mean the introduction isn’t strong enough to carry readers through, or that the subheadings aren’t giving people a clear enough reason to continue.
For SMEs using content marketing as a lead-generation channel, a scroll map analysis of your key blog posts and service pages is a quick way to identify where your writing effort is being wasted.
Move Maps: Reading Between the Lines
Move maps are the third heatmap type available when using heatmaps with Hotjar, and they track cursor movement on desktop browsers. Research into cursor behaviour suggests it correlates reasonably well with eye movement, though it’s not a direct proxy. What move maps show reliably is where users are pausing, backtracking or hovering without clicking.
Areas of dense cursor movement that don’t result in clicks are worth investigating. They often indicate that visitors are reading carefully in that area, which is a good sign for that content, but they may also indicate confusion: users hovering over something because they’re not sure whether it’s interactive.
Move maps are less decisive than click or scroll maps on their own. They’re most useful when combined with session recordings, which let you watch individual user journeys in full and understand the context behind the patterns.
Using Heatmaps with Hotjar When You Have Low Traffic
Most heatmap guides are written for businesses with hundreds of thousands of monthly visitors. For an SME in Belfast, Dublin or across the UK with a few hundred or a few thousand monthly visitors, the guidance around “statistical significance” can feel discouraging.
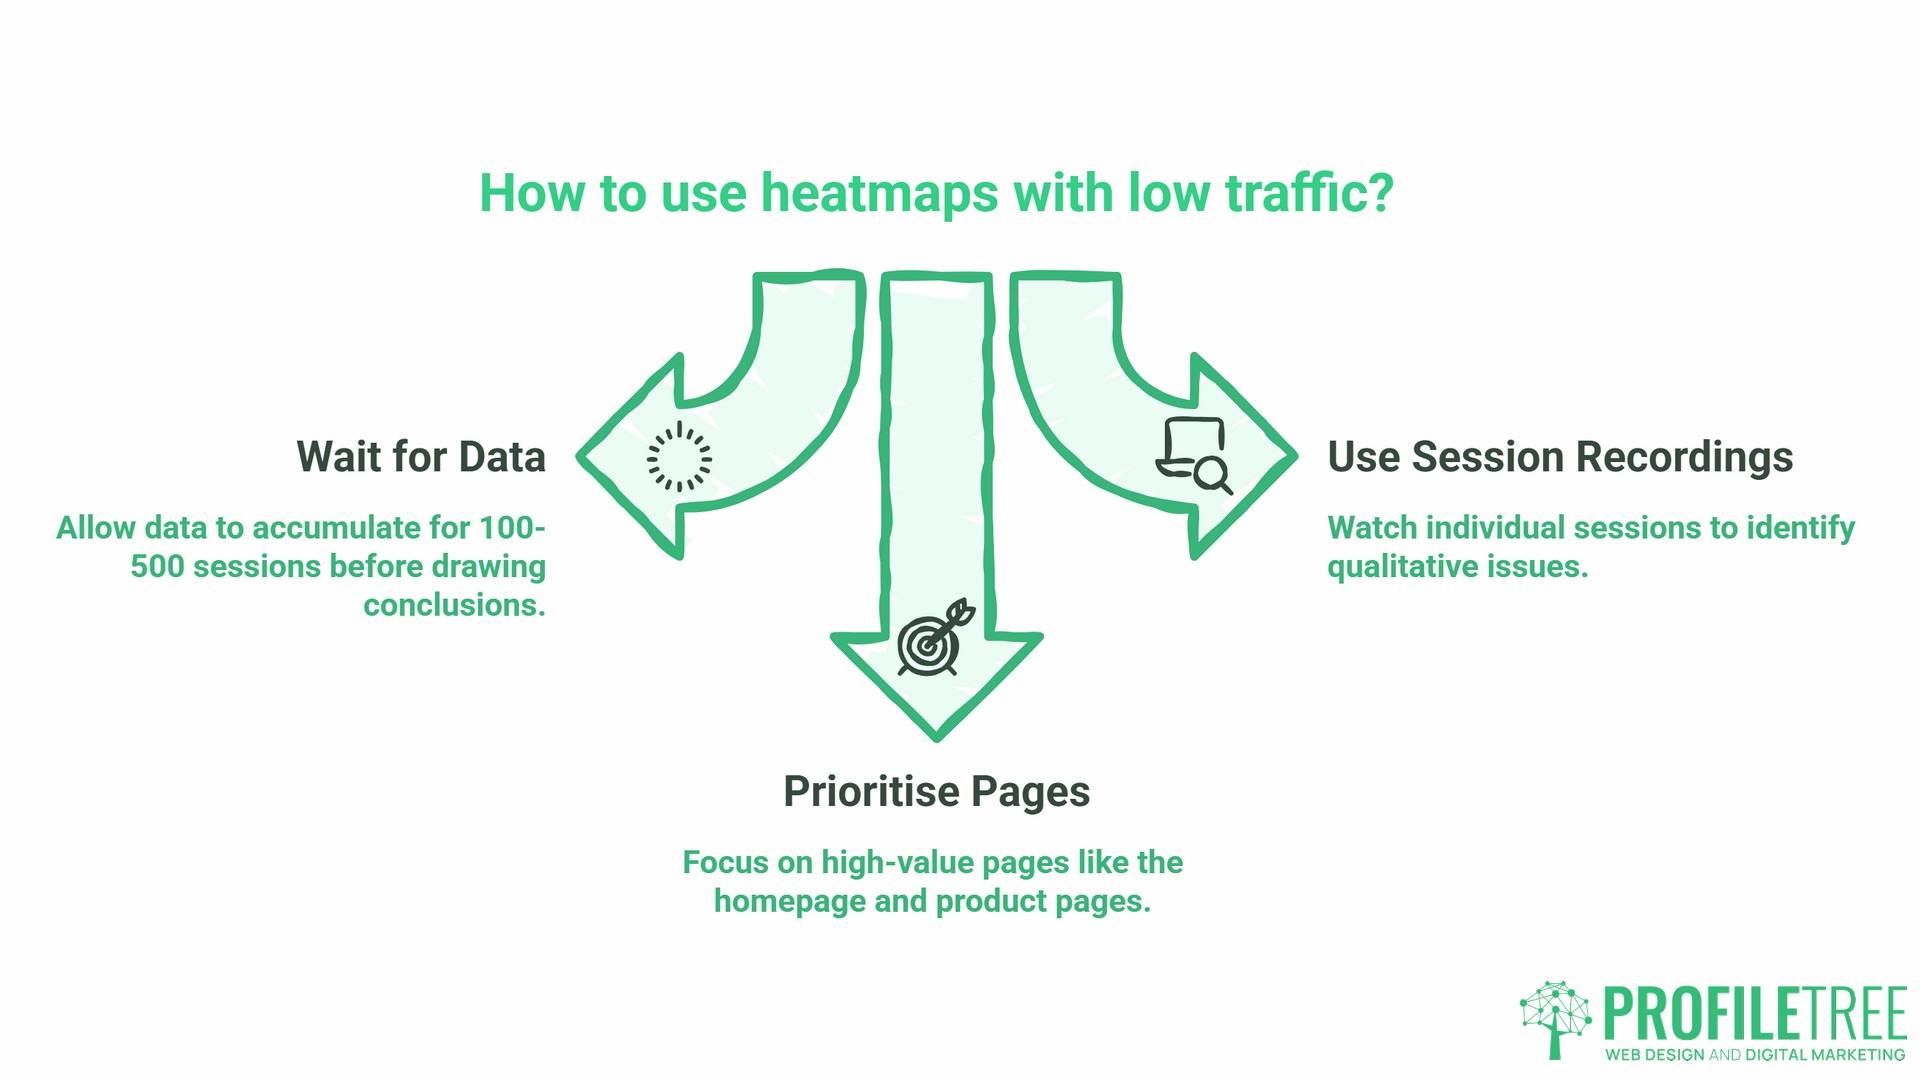
The practical reality is that using heatmaps with Hotjar is still worthwhile at lower traffic volumes, but you need to adjust your expectations about certainty. As a general rule, most UX and CRO professionals suggest waiting at least 100 sessions on a page before drawing any conclusions, and closer to 500 before making structural changes. For a page that receives 200 visitors a month, that means letting data accumulate for two to three months before acting on it.
When traffic is genuinely low, Hotjar’s session recordings become more important than the heatmaps themselves. Watching 20 to 30 individual sessions on a key page often reveals problems that a heatmap with thin data would obscure. You might notice that multiple visitors attempt to click the same non-interactive element, or that everyone scrolls past your enquiry form without stopping. Those qualitative observations are valid evidence even when the quantitative data isn’t yet substantial enough to act on alone.
Prioritising the Right Pages
Not every page needs a heatmap. For SMEs, the highest-value pages to track are: your homepage, your primary service or product pages, your contact page or enquiry form, and any landing pages running paid traffic. These are the pages where user behaviour directly affects your revenue, and where even small improvements to click or scroll patterns can translate into more conversions.
The “So What?” Framework: Turning Observations Into Actions
Heatmap data has no value until it produces a change. This is where many SMEs stall: they install Hotjar, generate some colourful maps, find the data interesting, and then do nothing. Using heatmaps with Hotjar effectively means treating each observation as the start of a hypothesis.
| What You See in the Heatmap | What It Likely Means | The Fix |
|---|---|---|
| Clicks on a non-linked image | Users expect that image to be clickable | Add a link or remove the clickable visual cues |
| CTA button in cool colours | Button is not visible, compelling or well-positioned | Move higher, change copy, increase contrast |
| Scroll drop-off before key content | Content above the fold isn’t holding attention | Strengthen intro or restructure page hierarchy |
| Dense cursor movement around a price or term | Visitors are unsure or uncertain | Add a tooltip, clarify the copy, or add a FAQ nearby |
| Mobile scroll depth much lower than desktop | Mobile layout is creating friction | Review mobile page structure and load speed |
Each observation leads to a hypothesis. Each hypothesis leads to a change. Each change should then be monitored to see whether it produces the expected improvement. This cycle, install and observe, form a hypothesis, make a change, measure the result, is the basis of any serious website optimisation programme.
For businesses working with ProfileTree on web design or development projects, this kind of data often feeds directly into the redesign brief. Rather than redesigning based on aesthetic preference, the heatmap data provides an evidence-based that makes every design decision defensible.
GDPR and Hotjar: What UK and Irish Businesses Need to Know
This is the section most guides skip, and it matters significantly for businesses operating under UK GDPR and the Irish Data Protection Act 2018.
Hotjar collects behavioural data from your website visitors. That means it is a data processor, and your use of it must comply with your privacy obligations. The key considerations are:
- Cookie consent: Hotjar’s tracking script should only fire after a visitor has given consent for analytics or tracking cookies, depending on how you’ve categorised it in your cookie policy. If your cookie banner allows visitors to decline analytics, Hotjar should not run for those visitors. Hotjar provides a User Suppression API specifically for this purpose.
- Data masking: By default, Hotjar suppresses text input fields (such as form fields) from recordings and heatmaps. You should verify this is enabled in your Hotjar settings and extend it to any other areas displaying sensitive information.
- IP anonymisation: Hotjar offers IP address anonymisation, which should be enabled for UK and EU visitors to align with data minimisation principles under UK GDPR.
- Data retention: According to Hotjar’s official documentation, heatmap data is retained for 365 days from the date of creation, and this applies to all plans. After 365 days, data is automatically deleted and cannot be retrieved. Review this against your own data retention policy, particularly if you need to retain behavioural data for longer periods for internal reporting.
For most SMEs, the practical implication is that their cookie consent mechanism must be properly integrated with Hotjar’s suppression features. If you’re running a Hotjar installation that fires for all visitors regardless of consent status, that is a compliance gap worth addressing before you do anything else.
Hotjar and Your Wider Digital Strategy
Using heatmaps with Hotjar works best when they sit within a broader analytics setup rather than operating in isolation. The natural pairing is with Google Analytics 4, which gives you the quantitative data: traffic volumes, traffic sources, session duration, and goal completions. Hotjar provides the qualitative layer: what people are doing on individual pages once they arrive.
When you connect Hotjar to Google Analytics 4, you can filter session recordings by GA4 events, letting you watch how users who completed a specific action (such as a form submission or product view) behaved on the page beforehand. This gives you a qualitative layer on top of GA4’s quantitative data that is hard to replicate any other way.
The integration is available on Hotjar’s Business and Scale plans. To connect the two tools, go to your Hotjar account, navigate to Integrations in the left-hand menu, and select Google Analytics. From there you can link your GA4 property and choose which events to sync across. Note that for the integration to work correctly, Google Analytics should be installed directly on your site rather than via Google Tag Manager, as the current integration does not support GA installations via GTM.
For businesses investing in SEO or content marketing, Hotjar’s scroll depth data also provides a signal of content quality that you cannot easily get from Google Analytics alone. If your highest-traffic blog posts are showing scroll depths of under 30%, that suggests the content isn’t delivering on what the title and meta description promised, which is an SEO issue as much as a content one.
Getting Started: A Five-Step Hotjar Setup for SMEs
The steps below apply whether you are starting from scratch or picking up a dormant account. Following this order means you’ll use Hotjar heatmaps on the right pages, with privacy correctly configured, before a single session is collected. Hotjar provides a script that is injected into the header of your website. On WordPress sites, this can be added via a plugin or directly into the theme header. Hotjar’s free plan allows data collection on up to 35 daily sessions, which is sufficient for initial setup and testing.
- Step two: Configure privacy settings before you start collecting data. Enable IP anonymisation, check that form fields are suppressed, and verify that your Hotjar script fires only after consent where required. Do this before your first session is recorded.
- Step three: Create heatmaps for your priority pages. Set up click, scroll and move heatmaps for your homepage, primary service pages and contact page. Set each heatmap to capture a minimum of 100 sessions before you review the data.
- Step four: Set up session recordings alongside your heatmaps. Recordings give you the full context for the patterns you see in heatmaps. Start with a sample of 20 to 30 recordings per key page.
- Step five: Schedule a monthly review. Set a recurring reminder to review your heatmap data and recordings. Document any observations, form a hypothesis for each, and assign the change to whoever manages your website. Without this step, the data sits unused.
Hotjar Plans: What SMEs Actually Need
Hotjar’s heatmap and recording functionality is part of its Observe product, which has four tiers. The free Observe Basic plan captures 35 daily sessions with unlimited heatmaps, making it a practical starting point for SMEs who want to trial the tool before committing to a budget.
Observe Plus (around €32 per month on annual billing) increases daily session capture to 100 and adds data filtering and segmentation, which becomes important once you want to compare behaviour across different audience segments or time periods.
Observe Business (around €80 per month on annual billing) raises the daily session limit to 500 and adds custom integrations, including the Google Analytics integration covered in the previous section. This is also the minimum plan required to use Hotjar’s GA4 integration.
Observe Scale is aimed at larger organisations with high traffic volumes and enterprise requirements, including single sign-on, funnel analysis, and dedicated support. Most SMEs will not need it.
For most SMEs tracking four to six key pages with modest traffic, the free Observe Basic or Observe Plus plan provides everything needed to run a useful optimisation programme. The key consideration when choosing a plan is whether it will capture enough of your sessions on the pages you care most about. If your contact page receives 400 visits a month and your plan captures 35 daily sessions (roughly 1,050 per month), you have a workable sample. If traffic is significantly higher, moving to Plus or Business gives you a more representative data set.
Note: Hotjar was acquired by Contentsquare in July 2025, and plan names and pricing are subject to ongoing changes as the two platforms integrate. Check Hotjar’s current pricing page before purchasing to confirm the latest tier structure.
Using heatmaps with Hotjar is one of the most accessible ways for an SME to move from guesswork to evidence in website decision-making. The data is visual, the tool is affordable, and the fixes it points to are often straightforward. The challenge is not in understanding the colours; it’s in building the habit of acting on what they show.
Start with your highest-value pages, get privacy settings right before collecting data, and treat every heatmap observation as a hypothesis to test rather than a conclusion to accept.
FAQs
Is Hotjar GDPR compliant for UK and Irish businesses?
Hotjar can be used in a GDPR-compliant way, but it requires configuration. You need to enable IP anonymisation, suppress sensitive form fields, and confirm Hotjar only fires after a visitor has given valid cookie consent. Hotjar provides a User Suppression API to support this. Review Hotjar’s own data processing documentation and verify your use aligns with your privacy policy.
How much traffic do I need for a Hotjar heatmap to be useful?
A minimum of 100 sessions on a page gives you a basic pattern to work from. For higher confidence before making structural changes, aim for 500 sessions. If a page gets fewer than 100 visitors a month, session recordings are more useful than heatmaps at that stage.
What is a dead click, and why does it matter?
A dead click is when a visitor clicks on an element that isn’t a link. It indicates the visitor expected that element to be interactive. Repeated dead clicks on the same element suggest a design cue (such as an underlined word, a shadowed image, or a button-shaped graphic) that is misleading users and creating friction in the journey.
Does Hotjar slow down my website?
Hotjar loads its script asynchronously, meaning it should not block your page from loading. That said, any third-party script adds some weight, and on sites with many scripts already running, the cumulative effect can be noticeable. Test your page speed before and after installing Hotjar using Google PageSpeed Insights to check the impact.
Should I use Hotjar on every page of my website?
For most SMEs, tracking every page is unnecessary and dilutes your focus. Prioritise high-intent pages: your homepage, service pages, landing pages receiving paid traffic, and your contact or enquiry form. These are where behaviour changes have the most direct impact on your business outcomes.
How long should I run a Hotjar heatmap before reviewing the data?
Run each heatmap until you’ve captured at least 100 sessions on that page, regardless of how long that takes. For low-traffic pages, this may mean leaving the heatmap running for several months. Avoid drawing conclusions from a single week of data, particularly if your traffic has seasonal patterns.