Digital Marketing Analytics: A Practical Guide for UK Business Owners
Table of Contents
Most business owners know they should review their analytics. Fewer know what they’re actually looking at. Sessions, bounce rates, impressions, conversions, and a Google Analytics 4 dashboard can surface dozens of numbers without making it obvious which ones should change what you do next.
Digital marketing analytics is the discipline of turning that data into decisions. Done well, it tells you which parts of your website are working, which campaigns are earning their budget, and where potential customers are dropping out of the buying process. Done poorly or ignored entirely, it leaves you spending money on marketing activities you can’t evaluate.
This guide covers what digital marketing analytics actually means for a UK or Northern Ireland SME, which metrics deserve your attention, how to measure return on investment honestly, and what tools make the process manageable without a dedicated data team.
What Digital Marketing Analytics Means in Practice
Digital marketing analytics is the process of collecting, measuring, and interpreting data from your online marketing activity websites, search campaigns, social media, email, and paid advertising to understand what’s working and make better decisions.
The definition sounds straightforward. The challenge for most businesses is the gap between having data and knowing what to do with it.
From Data to Decisions
A retail business in Belfast might know it has 4,000 website visitors a month. Without an analytics context, that number is almost meaningless. With the right analysis, the same business can see that 68% of visitors arrive via organic search, that visitors from mobile devices leave within 20 seconds at a rate far higher than desktop users, and that the product pages that convert best are those with more than 4 images. Each of those findings points toward a specific action: SEO investment, mobile site performance, or photography.
That movement from raw numbers to specific next steps is what analytics is for. It’s less about dashboards and more about removing the guesswork from where you spend time and money.
Web Analytics vs Marketing Analytics
These terms are often used interchangeably, but they’re not identical. Web analytics focuses on what happens on your website: which pages are visited, how long people stay, where they came from, and where they go. Marketing analytics is broader; it covers the performance of every channel that drives traffic and enquiries, including paid search, social media, email campaigns, and video.
A complete analytics picture brings both together. Your website data tells you what happens when people arrive. Your channel data tells you which routes brought the right people in the first place.
Why This Matters More Now
Two developments have made analytics both more important and more complex for UK businesses in recent years. The first is the phase-out of third-party cookies, which has reduced the accuracy of cross-site tracking and shifted focus toward first-party data gathered directly from your own website and customers. The second is the rise of AI-powered search, where appearing in AI-generated answers now requires a different kind of content visibility than traditional organic rankings.
Both changes mean that businesses with solid analytics foundations, proper tracking, clear goals, and reliable data have a clearer view of their position than those relying on legacy tools and assumptions.
The Four Types of Marketing Analytics
Most businesses operate almost entirely in one of the four categories below without realising the others exist. Understanding the distinction is useful because each type answers a different question.
Descriptive Analytics: What Happened?
Descriptive analytics is what most people mean when they talk about “checking the analytics.” It summarises past performance: how many website visitors you had last month, your email open rate, and which pages were most viewed. Google Analytics 4, social media insights dashboards, and standard email platform reports are all descriptive analytics tools.
This is the baseline. Without it, you have no record of performance and no way to spot trends. With it alone, you know what happened but not why, and not what to do about it.
Diagnostic Analytics: Why Did It Happen?
Diagnostic analytics asks why. If website traffic dropped by 30% in March, descriptive analytics shows the drop. Diagnostic analytics investigates the cause: was it a Google algorithm update, a technical issue that broke the site on mobile, a competitor that outranked a key page, or a seasonal pattern that occurs every year?
This requires combining data sources: comparing your traffic data with Google Search Console, checking for technical errors, and reviewing any site changes made around that time. The process is closer to investigation than reporting.
Predictive Analytics: What Is Likely to Happen?
Predictive analytics uses historical patterns to forecast future performance. At its simplest, this might be recognising that your enquiries always rise in September and planning campaign activity accordingly. More sophisticated implementations use machine learning to identify which types of website visitors are most likely to convert, or which keywords are gaining search volume before they become competitive.
Google Analytics 4 has predictive audience features built in, including purchase and churn probability scoring, previously available only to enterprise businesses with data science teams. These are now accessible to SMEs, though they require sufficient data volume and a correct setup to function reliably.
Prescriptive Analytics: What Should We Do?
Prescriptive analytics moves from insight to recommendation. Given what the data shows, it suggests a specific action: reallocate budget from underperforming paid campaigns to organic content, A/B test the homepage headline, or prioritise mobile page speed before the next campaign launch.
In practice, prescriptive analytics usually requires human judgement to translate data patterns into business decisions. The tools can surface the signal; someone who understands both the data and the business has to decide what to do with it. This is where digital marketing strategy and analytics intersect and where working with a team that understands both the technical and commercial dimensions pays off.
The Metrics That Matter for SMEs
There are hundreds of metrics available across digital marketing platforms. Most of them aren’t worth your time. The following are the ones that actually connect to business outcomes for a small or medium-sized business in the UK or Ireland.
Traffic and Acquisition Metrics
Organic sessions visitors arriving from unpaid search results. The primary measure of SEO performance. Track this by channel in GA4 to separate organic from paid, direct, and referral traffic.
Organic click-through rate (CTR) is the percentage of people who see your page in search results and click through. This comes from Google Search Console, not GA4. A page ranking in position 4 with a 1% CTR is underperforming and likely has a weak title or meta description.
Traffic by channel understanding whether your visitors come from organic search, paid ads, social media, email, or direct navigation tells you which channels are actually working. Many businesses are surprised to find that most of their traffic comes from one or two sources, which represents both a dependency risk and an opportunity.
Engagement Metrics
Engagement rate (GA4): the percentage of sessions that lasted longer than 10 seconds, included a conversion event, or involved more than one page view. This replaced bounce rate as the primary engagement signal in GA4. A higher engagement rate generally indicates that the content is relevant to the people who are arriving.
Average engagement time: How long, on average, do engaged sessions last? For content-led pages like guides or blog posts, this indicates whether visitors are actually reading. A 400-word page with an average engagement time of 45 seconds is being skimmed. A 2,500-word guide with an average engagement time of 3 minutes is being read.
Pages per session — how many pages a visitor views in a single session. Higher numbers suggest visitors are finding the site useful enough to explore. Very low numbers (1.0 to 1.2) on commercial pages can indicate unclear navigation or a lack of internal linking.
Conversion Metrics
Conversion rate: the percentage of visitors who complete a desired action: submitting an enquiry form, making a purchase, booking a consultation, or calling the business. This is the most important metric for commercial pages. A web design or development project that raises a page’s conversion rate from 1% to 2% doubles the commercial output of the same traffic.
Customer acquisition cost (CAC) is the total marketing spend divided by the number of new customers acquired in a period. This requires combining your analytics data with your actual sales figures. Many SMEs have a rough sense of their marketing costs; far fewer know what each new customer actually costs to acquire.
Customer lifetime value (CLV) is the total revenue a typical customer generates over the course of the relationship. When you know CLV, you can make rational decisions about how much to spend to acquire a customer. Without it, budget decisions are largely guesswork.
A Metric Alignment Table
| Technical Metric | What It Actually Means | Business Action |
|---|---|---|
| High impressions, low CTR | Content is interesting, but the page doesn’t convert | Page ranks, but the title/description doesn’t persuade clicks |
| High traffic, low engagement rate | Visitors arrive and leave quickly | Review content relevance or page load speed |
| High engagement, low conversion | Content is interesting but the page doesn’t convert | Review CTA placement, form design, or trust signals |
| High CAC relative to CLV | Marketing spend is unsustainable | Review channel mix or improve retention |
How to Measure Digital Marketing ROI
Return on investment (ROI) in digital marketing is calculated by comparing the cost of marketing activities with the revenue or profit they generate.
The formula is:
ROI = (Revenue from marketing – Cost of marketing) ÷ Cost of marketing × 100
If a campaign costs £2,000 and generates £6,000 in revenue, the ROI is 200%. The calculation looks simple. The difficulty is in accurately attributing revenue to specific marketing activity.
Attribution: Giving Credit Where It’s Due
Attribution is the process of identifying which marketing touchpoints contributed to a conversion. A customer who finds you through an organic blog post, returns via a Google ad two weeks later, and then books via a direct visit, which channel gets credit?
Different attribution models answer this differently:
Last-click attribution gives full credit to the final touchpoint before conversion. It’s the default in many platforms and consistently overstates the value of bottom-of-funnel activity like branded search and retargeting ads.
First-click attribution gives full credit to the first touchpoint, which overstates the value of awareness channels at the expense of everything that nurtures the decision.
Data-driven attribution (available in GA4 for accounts with sufficient data) distributes credit across touchpoints based on their actual contribution to conversions. This is the most accurate model for most businesses, though it requires enough conversion volume to be reliable.
For most Northern Ireland and UK SMEs, the practical recommendation is to use data-driven attribution in GA4 where possible, review assisted conversions regularly alongside last-click data, and treat attribution as directional rather than definitive.
Reporting to Non-Technical Stakeholders
One of the most common challenges in analytics is explaining what the numbers mean to business owners, directors, or clients who aren’t immersed in the details. A dashboard full of sessions, bounce rates, and goal completions rarely communicates business impact clearly.
A useful approach is to map metrics to business outcomes before you present them:
- Instead of “organic sessions increased by 22%”, say “search engines sent 22% more potential customers to the site, without additional ad spend.”
- Instead of “conversion rate is 2.4%”, say “roughly 24 in every 1,000 visitors become enquiries.”
- Instead of “average engagement time is 2 minutes 40 seconds”, say “visitors reading our main service pages are spending nearly 3 minutes on them, which indicates genuine interest.”
“The analytics challenge for most business owners isn’t the data, it’s making it mean something,” says Ciaran Connolly, ProfileTree Founder. “The moment you connect a metric to a specific business decision, the whole conversation changes.”
ProfileTree’s digital marketing strategy work includes regular reporting that frames analytics in commercial terms rather than platform metrics, which is one of the most practical forms of digital training available to SME teams.
Analytics Tools for UK Businesses
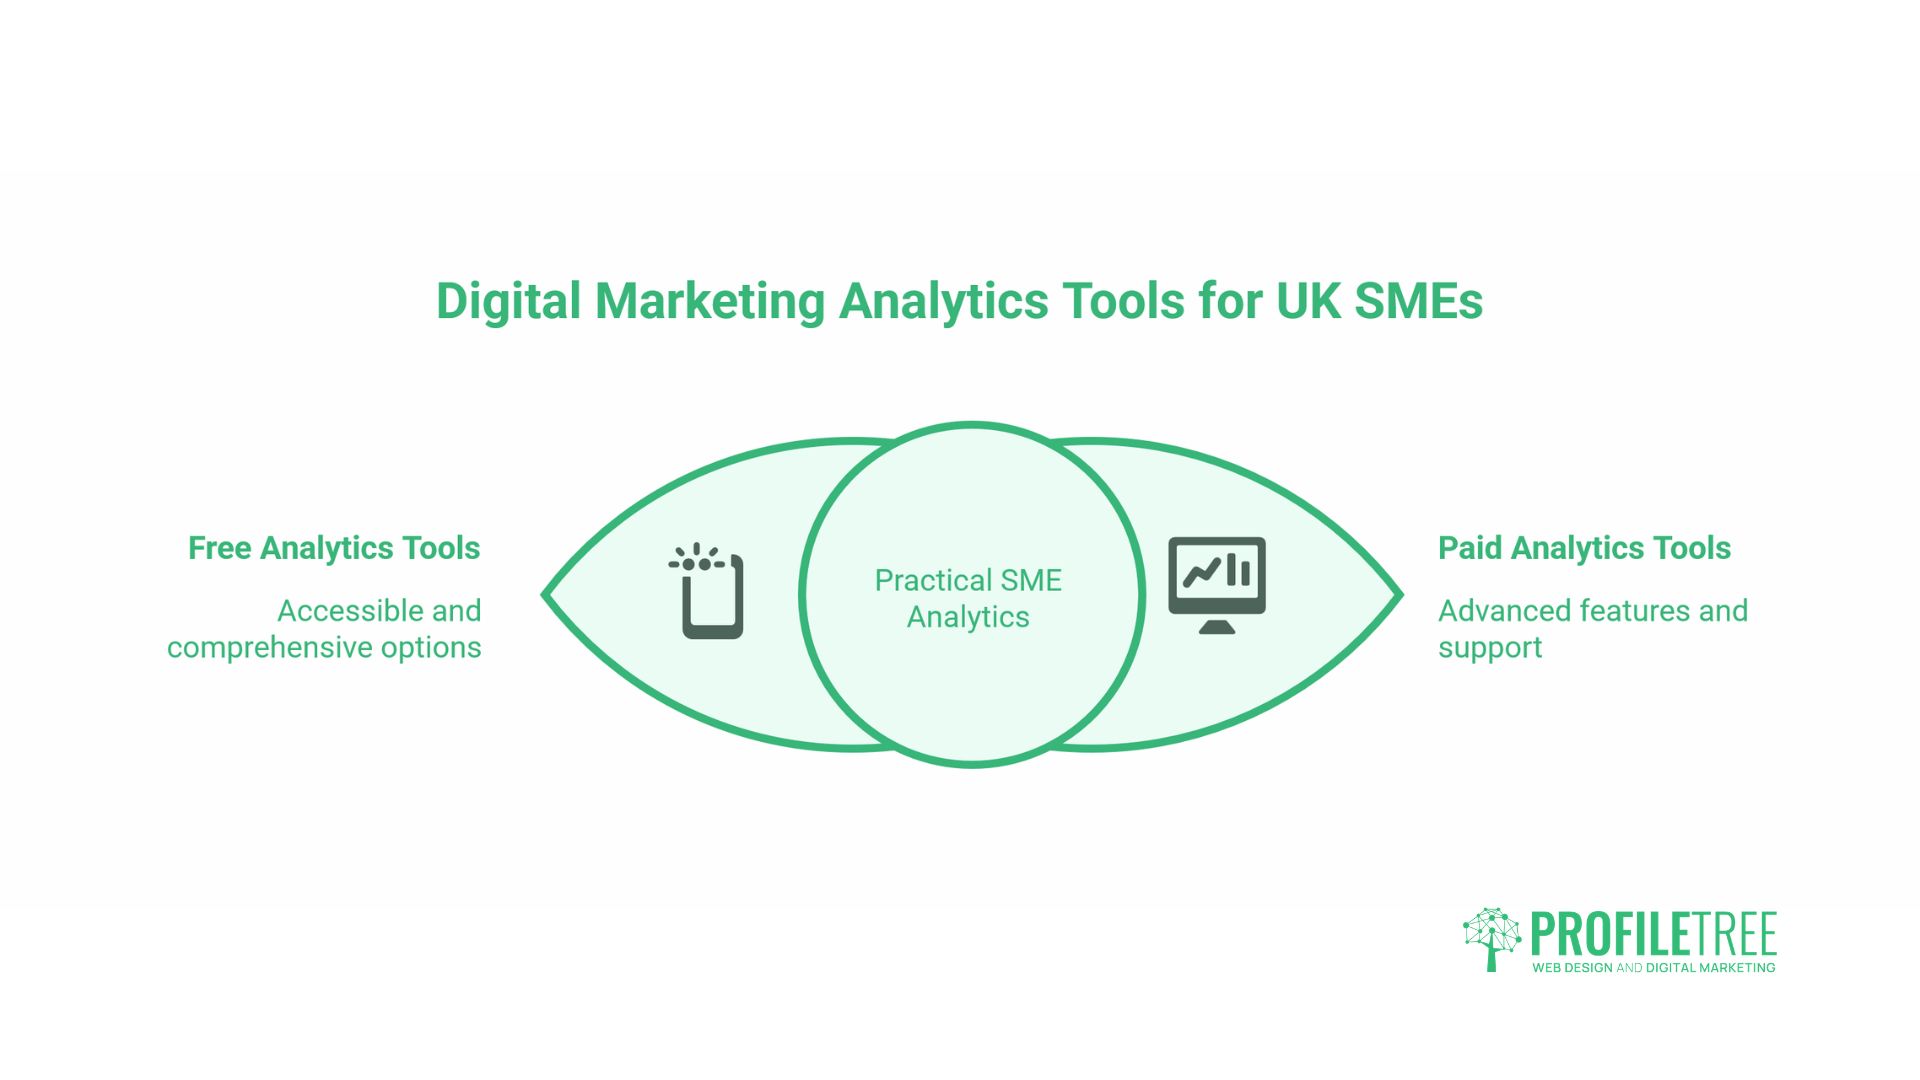
The tools available for digital marketing analytics range from free and comprehensive to enterprise-level and expensive. For most UK SMEs, a combination of free tools covers most practical needs.
Google Analytics 4
GA4 is the current version of Google’s web analytics platform and is free for most businesses. It replaced Universal Analytics in 2023 and takes a fundamentally different approach: it’s event-based rather than session-based, which means it tracks specific user actions rather than simply logging visits.
Key features relevant to SMEs include engagement rate tracking, conversion events, traffic channel breakdown, basic predictive audiences, and integration with Google Search Console and Google Ads. The learning curve is steeper than Universal Analytics, but the data model is more flexible and better suited to businesses with both web and app properties.
One important note: GA4 uses modelled data to fill gaps created by users who decline cookies or browse in privacy modes. This means the numbers in GA4 are estimates, not exact counts. For most decision-making purposes, this is fine; you’re looking for patterns and trends, not forensic accuracy.
Google Search Console
Search Console shows you how your website performs in Google search results specifically. It’s free, and the data it provides, impressions, clicks, CTR, and average position by query, is not available anywhere else. It’s the primary tool for tracking SEO performance.
For SMEs investing in SEO services, Search Console is where you verify that keyword rankings are improving and that the right search queries are driving traffic. If a page has thousands of impressions but a CTR below 1%, that’s a signal that the title tag and meta description need attention.
Privacy-Centric Alternatives
UK and European data protection requirements have pushed some businesses toward analytics tools that don’t rely on cookies and don’t transfer data to US servers. Piwik PRO and Matomo are the most commonly used alternatives. Both offer similar functionality to GA4, with data hosted either on EU servers or on-premises. For businesses in regulated sectors or those particularly conscious of UK-GDPR compliance, these tools are worth evaluating.
| Tool | Cost | Strengths | Considerations |
|---|---|---|---|
| Google Analytics 4 | Free | Comprehensive, integrates with Google Ads and Search Console | US data residency; modelled data gaps |
| Google Search Console | Free | Only source of actual search query data | Search performance only, no on-site behaviour |
| Piwik PRO | Free up to 500k actions/month | EU data hosting, strong privacy compliance | Smaller ecosystem, steeper setup |
| Matomo | Free (self-hosted) | Full data ownership, no sampling | Requires hosting and technical setup |
Video and Content Performance
For businesses using video production and YouTube marketing as part of their content strategy, YouTube Studio provides detailed analytics on video performance: watch time, audience retention by timestamp, traffic sources, and subscriber impact. When video content is used to drive website traffic or brand awareness, connecting YouTube analytics with GA4 referral data gives a clearer picture of the full audience journey.
ProfileTree’s YouTube channels for digital marketing and web development provide an example of how video analytics data can inform content decisions, identifying which topics retain viewers, which calls to action drive clicks through to the website, and which video lengths suit different audience segments.
UK Data Privacy and Your Analytics Setup
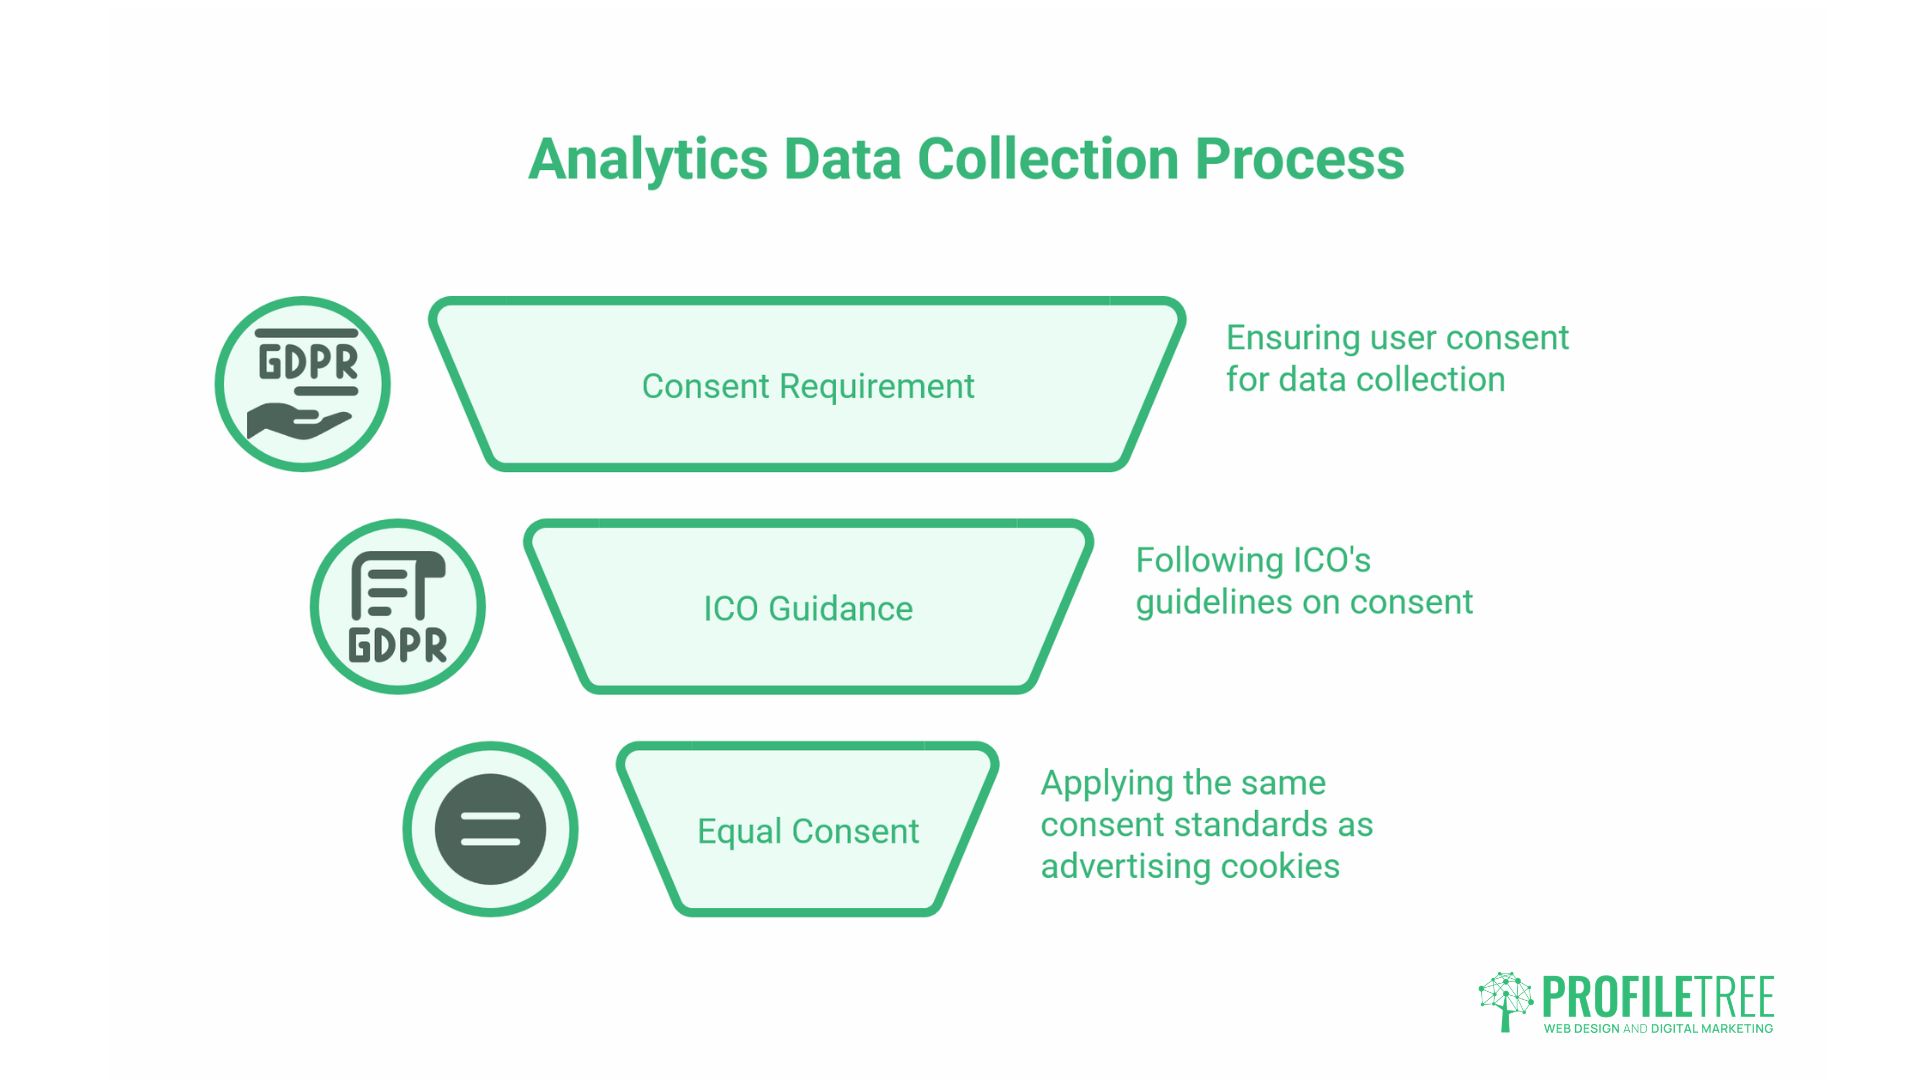
UK businesses operating under the UK GDPR and the Privacy and Electronic Communications Regulations (PECR) have specific obligations regarding the collection of analytics data. This isn’t a peripheral concern: the Information Commissioner’s Office (ICO) has issued guidance that analytics cookies require the same level of consent as advertising cookies.
What UK-GDPR and PECR Mean for Analytics
PECR requires that non-essential cookies, including analytics cookies, cannot be set without the user’s prior consent. This means your consent banner must give users a genuine choice to decline analytics tracking, and that choice must be respected. Pre-ticked boxes or designs that make declining deliberately difficult are non-compliant.
In practice, this means that a proportion of your visitors will decline tracking. The size of that proportion depends on how your consent banner is designed and on the percentage of your audience that is privacy-conscious. GA4 uses modelled data to estimate the behaviour of non-consenting users, but this should be treated as an approximation rather than a precise count.
Consent Mode v2
Google’s Consent Mode v2 is a technical framework that allows GA4 to adjust its data collection based on a user’s consent choices, rather than simply switching tracking on or off. When implemented correctly alongside a compliant consent management platform (CMP), it allows GA4 to continue modelling aggregate behaviour without identifying individuals who have declined tracking.
For UK businesses using Google Analytics, implementing Consent Mode v2 is now considered standard practice for compliance. If your website doesn’t have it in place, this should be a priority.
First-Party Data as a Long-Term Asset
As third-party tracking becomes less reliable, first-party data information collected directly from your own customers and website visitors becomes more valuable. Email lists, CRM records, enquiry form submissions, and loyalty scheme data are all first-party assets. Building analytics infrastructure that better uses this data, rather than relying on third-party cookies, is a more durable, long-term approach.
ProfileTree’s AI implementation and digital strategy increasingly involve helping SMEs understand and structure their first-party data, connecting website behaviour with CRM records to build a clearer picture of the customer journey without relying on third-party tracking.
Conclusion
Digital marketing analytics isn’t about having more data. It’s about having the right data, set up correctly, interpreted clearly, and connected to decisions that affect your business. For most SMEs, that starts with ensuring GA4 and Google Search Console are properly configured, conversion goals are defined, and someone is reviewing the numbers with enough context to act on them.
ProfileTree works with businesses across Northern Ireland, Ireland, and the UK on the full journey from analytics setup through to strategy and implementation. If your current reporting leaves you uncertain about where to focus next, get in touch with our digital marketing team to discuss a more structured approach.
FAQs
What is digital marketing analytics?
Digital marketing analytics is the process of collecting and interpreting data from online marketing activity, search, social media, email, paid advertising, and website behaviour to understand what’s working and inform decisions about where to spend time and budget.
What are the four types of marketing analytics?
Descriptive (what happened), diagnostic (why it happened), predictive (what’s likely to happen), and prescriptive (what you should do about it). Most small businesses primarily use descriptive analytics. The diagnostic and predictive types are where most of the strategic value lies.
How do I measure digital marketing ROI?
The basic formula is: (Revenue from marketing – Cost of marketing) ÷ Cost of marketing × 100. The practical difficulty is attribution. Using data-driven attribution in GA4 and connecting your analytics data with actual sales figures gives a more accurate picture than last-click attribution alone.
Do I need to comply with the UK GDPR for analytics?
Yes. Under UK-GDPR and PECR, analytics cookies require explicit user consent before they are set. Google’s Consent Mode v2 should also be implemented if you’re using GA4, to ensure tracking adapts correctly based on each user’s consent choices.