
Social Media Statistics: UK and Global Data for Business Decisions
Table of Contents
Social media statistics only earn their keep when they change a decision. For businesses across Northern Ireland, Ireland, and the UK, the useful numbers are rarely the ones in the headlines. They are the platform, demographic, engagement and video figures that tell you where your customers actually are and what they respond to.
This social media statistics guide brings verified data together in one place, drawn from Ofcom, DataReportal, GWI, Socialinsider and platform filings. It covers global and UK usage, who uses which platform, realistic engagement benchmarks, video performance, and a practical way to read your own account numbers rather than someone else’s averages.
2026 At-a-Glance: Key Global Benchmarks
Before the platform details, it helps to set the global baseline. The global social media statistics below come from DataReportal’s April 2026 mid-year update and give a reference point for everything that follows. ProfileTree’s digital marketing services use this kind of data to decide where a client’s budget goes rather than spreading it thinly.
| Metric | Figure |
|---|---|
| Total social media user identities worldwide | 5.79 billion (April 2026) |
| Share of the global population active on social | 69.9% |
| Annual growth | +5.4% (294 million new identities year on year) |
| Internet users who use social media each month | 94.7% |
| Average platforms used per person each month | 6.5 |
| Average daily time spent on social | 2 hours 21 minutes |
One caveat worth carrying through the whole guide: DataReportal counts user “identities”, not unique humans, and notes that duplicate and inauthentic accounts inflate the total. The multi-platform reality is the bigger planning point. Users do not sit on one platform; they move between six or seven, which shapes where you spend production time.
Global Users, Growth and the Plateau Effect
The headline user count keeps rising, but the growth rate has slowed from the double-digit increases of 2018 to 2022 to around 5% a year. New users now come almost entirely from populations coming online for the first time in Africa, South Asia and Southeast Asia. In the UK, Ireland and North America, adoption is close to saturation. Reading the right social media statistics is what separates a targeted strategy from one that wastes budget on vanity metrics.
The UK was home to 55.5 million social media user identities in October 2025, roughly 79.7% of the population (DataReportal, October 2025), and Ireland had 4.26 million, around 80.1% of its population. Growth in both markets is now driven by younger people reaching social media age rather than large, untapped adult groups.
Behaviour is shifting as much as headcount. Ofcom’s Online Nation 2025 report points to rising passive consumption, with users more inclined to scroll and watch than to post or comment. Feeds are becoming quieter on the user-generated side, which is an opportunity for businesses that show up consistently with something worth watching.
The money has followed the maturity. Global social media ad spend is projected in the region of $317 billion in 2026, close to a quarter of all digital advertising, and Meta captures around 60% of it. The businesses seeing the best returns pair consistent organic content with a small, targeted paid budget rather than relying on either alone.
Platform User Statistics: Global and UK
Platform user counts are the social media statistics businesses ask about first. Monthly Active User figures show which platforms command the largest audiences, and the gaps are wider than most marketers assume. Treat platform-reported counts with some caution: methodologies differ, users overlap heavily across apps, and reported MAUs include duplicate and inactive accounts, which is why DataReportal (April 2026) counts user “identities” rather than unique people. Time spent and engagement data are steadier guides than raw headcounts.
| Platform | Global Monthly Active Users (Q1/April 2026) |
|---|---|
| 3.07 billion (first platform to reach 3 billion) | |
| ~3.0 billion | |
| YouTube | ~2.85 billion (undercounts logged-out viewing) |
| ~2.4 billion | |
| TikTok | ~1.8 billion, ex-Douyin (ad-reach estimates exceed 2 billion) |
| 1.3 billion members (~310 million active monthly) | |
| Snapchat | 946 million |
| X (formerly Twitter) | ~611 million |
| 631 million | |
| Threads | 400 million (~141 million daily active) |
| BlueSky | ~42 million |
Figures combine company earnings disclosures with estimates from DataReportal and Kepios (Q1/April 2026). They are not additive, because one person counts once on each platform they use.
The UK market picture shapes a channel decision for a business selling here. Ofcom’s Online Nation 2025 report, published in December 2025 and based on Ipsos iris measurement, records reach among UK online adults as follows.
| Platform | Reach (UK online adults, Ofcom 2025) | Avg. daily time |
|---|---|---|
| YouTube | 94% (46.3 million) | 51 minutes |
| Facebook and Messenger | 93% (45.9 million) | 43 minutes |
| 90% | 17 minutes | |
| 78% (38.5 million) | 19 minutes | |
| 60% (up 28% year on year) | Not reported | |
| TikTok | 56% (74% among 18 to 24s) | 28 minutes |
Two points stand out for planning. YouTube now works almost like a utility, ahead of every other platform on both reach and time spent, which makes vertical video a numbers-led choice rather than an aesthetic one. And Reddit’s climb to 60% UK reach, growing faster than any established platform, is one to watch for search-adjacent discovery. WhatsApp is the quiet giant of UK habits: much of the real sharing happens in private messages and groups that analytics cannot see, so social’s true influence on buying runs higher than dashboards suggest.
Social Media Demographics: Who Uses What
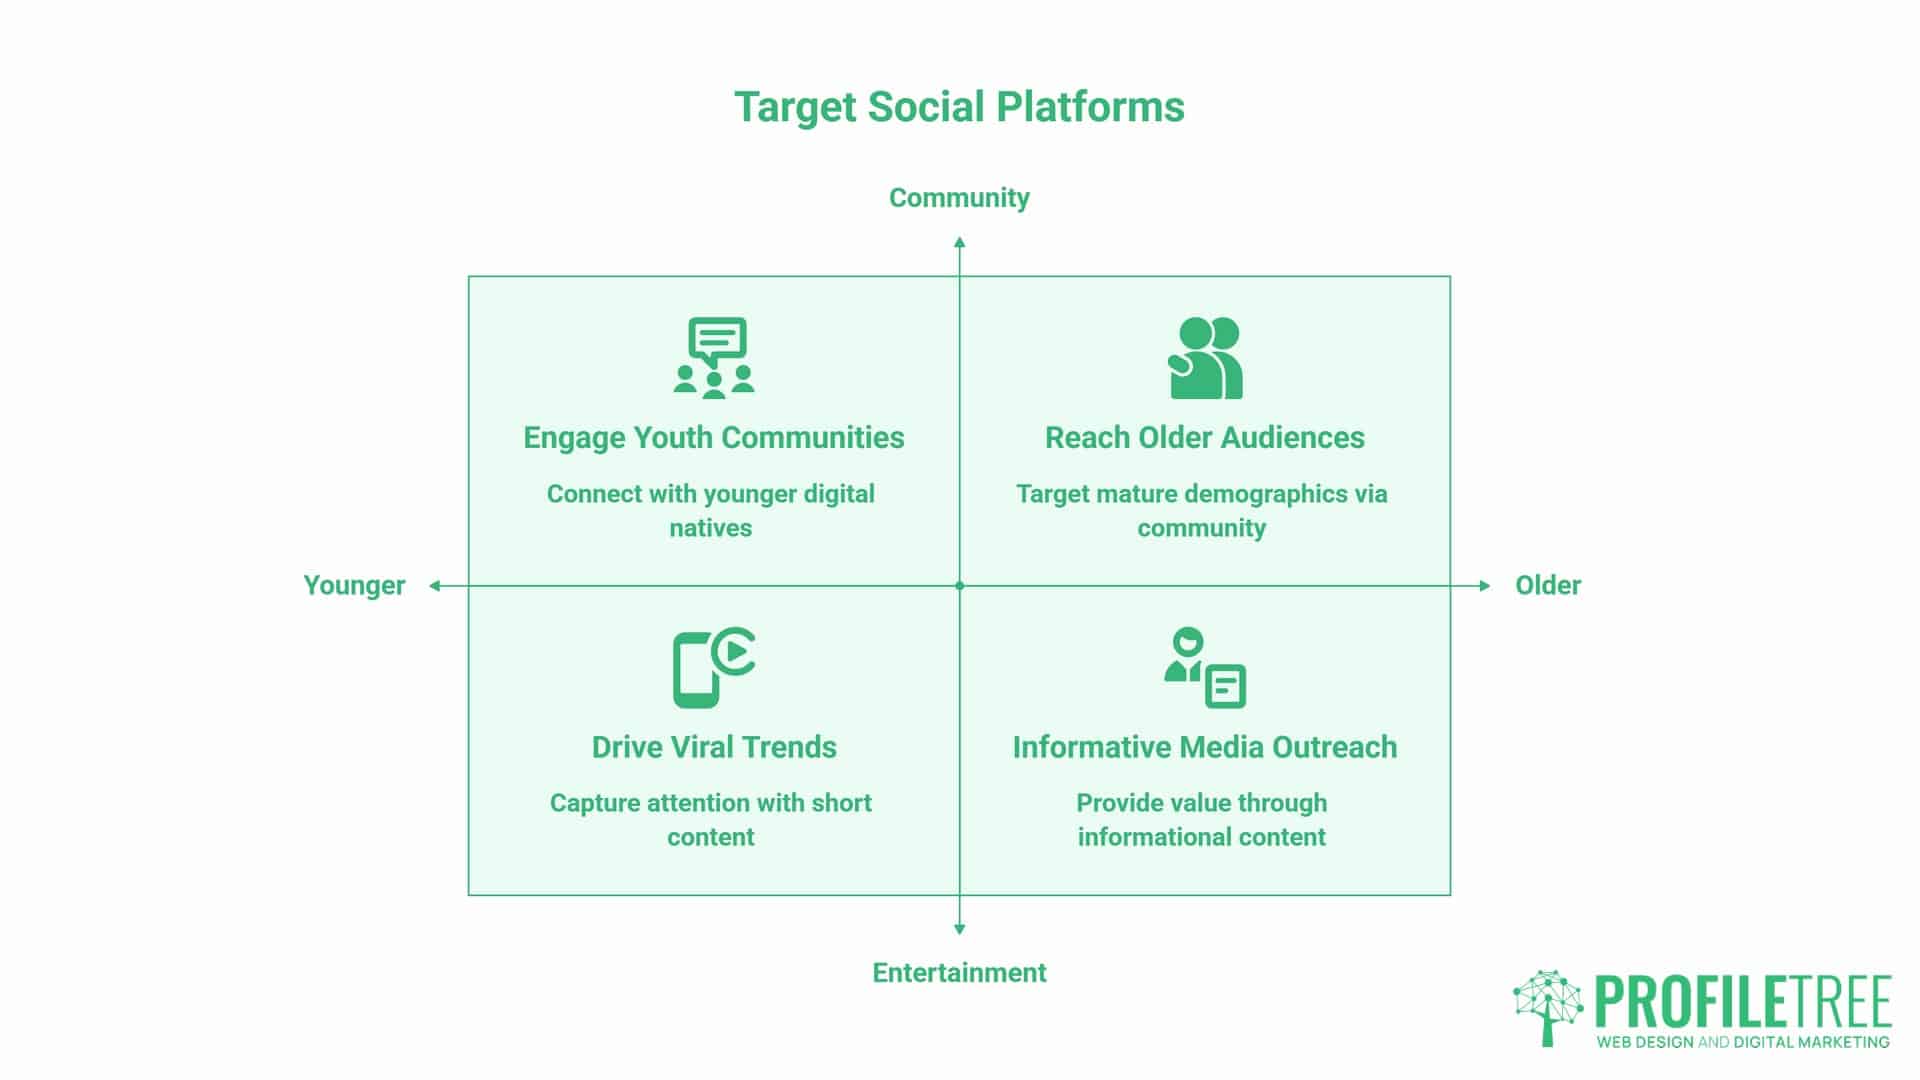
Demographic social media statistics matter as much as the headline totals. Age shapes platform choice more than any other variable, so knowing which cohort dominates each platform is the difference between reaching your buyers and missing them.
Gen Z spreads its time across more platforms than any older cohort, with TikTok, Instagram and YouTube dominant and Snapchat strong among under-25s (GWI 2026). Gen Alpha is the first group for whom gaming-social hybrids such as Roblox (132 million daily active users, Roblox Q1 2026) are the primary social space rather than a feed. Millennials remain the most active group on traditional platforms and hold the purchasing power that aligns with advertising, which keeps Facebook and Instagram the main paid channels for reaching them in the UK.
Gen X and Baby Boomers are the two most underserved and often most commercially valuable groups. Facebook is the primary platform for both, used for news, family and local community groups, and Ofcom confirms Facebook holds the highest proportion of older visitors of any top-ten platform. Older audiences respond better to informational and community content than to trend-led short videos, so format matters as much as platform.
Engagement Rate Benchmarks
In a saturated market, the social media statistics worth watching are about engagement rather than audience size. Reach tells you how many people saw a post; engagement tells you how many did something as a result. The figures below are median rates for business accounts (Socialinsider 2026) and should be read as directional.
| Platform | Median Engagement Rate (business accounts) |
|---|---|
| TikTok | 3.70% (up around 49% year on year, highest of the majors) |
| ~4.7% on company pages, driven by document carousels | |
| 0.48% across all post types | |
| ~0.15%, though UK reach rebounded in 2025 | |
| X (formerly Twitter) | 0.12%, the lowest of the majors |
Read these with care. Different providers report wildly different rates for the same platform in the same year because they use different formulas, so compare your numbers against accounts of similar size and sector rather than a single headline average. Format now moves the needle more than platform: carousels and short videos outperform static posts everywhere, with LinkedIn document carousels reaching a median near 21% and Instagram carousels around 7% (Buffer 2026).
Shares and saves grew faster than likes or comments throughout 2026, with TikTok shares up around 45%, reflecting a broader shift toward private sharing. A higher comment-to-like ratio usually signals a genuine community, and private sharing means true engagement often runs 20% to 30% above what public metrics show.
Video Statistics for UK Businesses
The social media statistics on video all point the same way: it is now the dominant format across every major platform. Wyzowl’s 2026 State of Video report found that 91% of UK businesses use video as a marketing tool, the highest figure recorded, and 87% of video marketers report positive returns. The UK-specific engagement picture is below.
| Platform | Avg. UK Engagement | Primary Demographic | Recommended Length | Relative Cost |
|---|---|---|---|---|
| TikTok | 5.96% | 18-34 | 30-60 seconds | £ |
| Instagram Reels | 3.79% | 25-44 | 15-30 seconds | £ |
| YouTube | 1.63% | 25-54 | 7-15 minutes | £££ |
| 0.54% | 30-55 (B2B) | 1-3 minutes | ££ | |
| 0.27% | 35-60+ | 1-5 minutes | ££ |
Two production facts shape everything else. Around three-quarters of all video plays happen on mobile, and studies put the share of social video watched with the sound off at between 69% and 85% (Verizon Media). Every social video needs to carry its message visually, with captions or text overlays doing the work, or it loses viewers before the first ten seconds.
Budget is where most SMEs stall, and the assumption that good video needs heavy spend is the least accurate belief in the sector. UK production runs from roughly £500 for a smartphone-shot social clip edited professionally, to £5,000 to £15,000 for a fully produced brand video with scripting, crew and post-production, with corporate animation around £3,000 to £8,000.
On TikTok and Instagram Reels, low-fidelity, authentic content consistently outperforms high-gloss production because trust signals come from authenticity. On YouTube, LinkedIn and paid placements, a higher production standard does correlate with longer view times. The decision should be platform-led, not budget-led. ProfileTree’s video production services and animation services support businesses at both ends of that range.
Social Search: The New Discovery Channel
One of the biggest shifts of recent years has had little coverage in mainstream roundups: for a growing share of users, social platforms are where the search process begins. Adobe’s 2023 research found that 64% of Gen Z users treat TikTok as a search engine, and Google’s own internal research, reported by Search Engine Land, found that around 40% of young people in the US turn to TikTok or Instagram rather than Google when looking for a place to eat or a product to buy. Ofcom’s 2025 data reinforces the trend, with UK consumers increasingly using platforms such as TikTok, Instagram and Reddit for product and creator discovery.
This does not replace Google for transactional queries. Someone searching “accountant Northern Ireland” is still doing that on Google. What social search replaces is the discovery phase. Users meet brands through social video, then later validate their choice through a Google search or a direct visit. A Belfast restaurant that ranks well on Google but has no TikTok presence is simply invisible to a large slice of its potential customers. Social content and search need to work together, which is why ProfileTree’s digital marketing strategy maps content formats across the full awareness-to-conversion path.
From Numbers to Decisions: The Metric-to-Action Framework
Social media statistics are only useful if they change what you do next. The table below maps common account-level statistics to the decision each one should trigger.
| Statistic | What It Tells You | Action |
|---|---|---|
| High reach, low engagement | Content is seen but not connecting | Test different hooks, formats or calls to action |
| High save rate | Content has reference or utility value | Produce more educational or checklist-style content in that format |
| Audience skews outside your service area | Organic reach is misaligned with commercial targets | Adjust hashtags, location tags and posting times to local peak hours |
| Video outperforms static posts | Audience responds better to motion | Reallocate production time toward short-form video |
| Low click-through on profile links | The call to action or bio link is weak | Test different copy and a link-in-bio tool with multiple destinations |
| High engagement from one age group | Organic audience differs from your target buyer | Adapt content, or assess whether that group is an untapped segment |
Saves and shares are the signals that most directly indicate content worth: someone saving a post plans to return to it, and across 2026, these private actions grew faster than public likes. Track format, topic, posting time and saves across a month and the patterns become obvious without any statistical training.
Industry Signals: How Platform Value Differs by Sector
Platform effectiveness varies significantly by sector, and generic advice ignores that.
For retail and e-commerce, Instagram and TikTok deliver the strongest organic reach where the product photographs well or has a clear use case, and shoppable posts shorten the distance between discovery and purchase. For professional services and B2B, LinkedIn is the primary channel; case studies, honest commentary on sector problems and useful professional content perform well, and email combined with LinkedIn outperforms any other channel pairing for lead generation. For local trades and construction, Facebook Groups and Google Business Profile often beat paid social at a fraction of the cost, with before-and-after project photography and short smartphone walkthroughs driving strong local engagement.
The Disadvantages SMEs Rarely Hear About
Most social media statistics guides are written by companies selling social tools, which builds in a bias toward positive data. The trade-offs deserve equal space.
- Time cost. The Federation of Small Businesses consistently names time as the main barrier to effective social media use. Quality content, comment replies and staying current across several platforms is a real ongoing commitment, and thin effort across four platforms reliably performs worse than concentrated effort on one or two.
- Declining organic reach. Every major platform has cut the organic reach of business accounts over the past decade as it shifted toward paid advertising. A Facebook page with 2,000 followers will typically reach fewer than 200 of them organically. That is the business model, not a fault to fix.
- Algorithm dependency. A strategy built entirely on social media sits on infrastructure you do not own. Algorithm changes, account restrictions and policy shifts can cut your reach overnight. Social should sit alongside owned channels such as your website and email list, not replace them.
- Measurement gaps. Many small businesses cannot attribute revenue to social activity. Without UTM parameters, conversion goals in analytics, or at a minimum, a record of where enquiries come from, it is hard to know whether the channel earns its time.
Tracking Statistics Responsibly: GDPR and UK Compliance
Not all social media statistics come from native dashboards. Many businesses add third-party tracking, such as the Meta Pixel, LinkedIn Insight Tag, or Google Tag Manager, to collect behaviour data from website visitors who arrived via social. That is where UK GDPR and ICO guidance become relevant.
The practical distinction is simple. Reviewing aggregated, anonymised statistics within a platform’s own dashboard (Instagram Insights, LinkedIn Analytics, TikTok Analytics) is fully compliant and requires no cookie consent, because that data never leaves the platform and contains no personally identifiable information. Installing a pixel on your own site and tracking individual journeys requires clear, specific opt-in consent via a compliant cookie banner.
The UK’s Online Safety Act, with enforcement provisions arriving through 2024 and 2025, also places duties on platforms and, by extension, on businesses running larger community pages. For businesses in Northern Ireland, the position is slightly more involved because of dual data-protection frameworks across the UK-Ireland context, and the ICO’s guidance on cookies is the authoritative reference for anyone unsure whether their setup is compliant.
A Weekly 10-Minute Statistics Audit
You do not need a paid analytics platform to benefit from social media statistics. The native dashboards give enough to make weekly decisions in under ten minutes.
- Monday check-in. Open each platform’s analytics for the previous week. Note your top three posts by engagement rate rather than reach, and record the format, topic and posting time of each. Note anything that clearly underperformed and what those posts had in common.
- What to record. Keep a simple spreadsheet: post date, format, topic category, reach, engagement rate and saves. After four weeks the patterns are clear.
- One action per week. Commit to a single change for the following week, whether a different format, posting time, hook or topic focus. Test it, then check whether the numbers move. ProfileTree’s digital marketing training covers this kind of analytics reading in sessions built for marketing managers rather than technical specialists.
What This Means for Your Strategy
The social media statistics in this guide point to a few consistent conclusions for most SMEs in Northern Ireland, Ireland and the UK. Platform selection should follow your own audience data, not trend headlines; if your customers are 40-plus local consumers, Facebook and YouTube will usually outperform TikTok, whatever the global growth figures say. Format drives reach more than posting frequency, so one well-made Reel a week tends to beat five static posts. Two or three platforms done well beat six done thinly. And your own account analytics always outrank platform-level averages, because they tell you where your specific customers actually are.
Ciaran Connolly, founder of ProfileTree, puts it plainly: “The biggest mistake we see Northern Irish SMEs make is copying a social strategy they have seen work for a London-based brand. The audience composition here is different, the platforms that convert are sometimes different, and the content that connects with local customers does not always look like what the global case studies show.”
For a fuller view of where digital budget delivers, our B2B social statistics and small business statistics cover adjacent benchmarks.
The Short Version
The era of easy audience growth in the UK and Ireland is over, but the chance to build genuinely engaged communities on the right platforms is stronger than ever. Passive scrolling is up, organic reach is tightening, and the businesses pulling ahead treat social as a precision tool rather than a broadcast channel. The social media statistics point one way: engagement over reach, depth over breadth, consistency over volume, all connected to a website built to convert.
FAQs
How many people use social media in the UK?
The UK had 55.5 million social media user identities in October 2025, around 79.7% of the population (DataReportal). Ofcom’s Online Nation 2025 report shows YouTube reaching 94% of online adults, Facebook and Messenger at 93%, and WhatsApp at 90%, with TikTok dominant among 16- to 24-year-olds.
Is social media still growing in 2026?
Globally, yes, but slowly, at around 5.4% a year, with almost all new users coming from Africa and South and Southeast Asia. In the UK and Ireland, audience growth has effectively plateaued. The change now is behavioural, with more passive scrolling and less active posting, rather than large numbers of new users joining.
Which social media platform has the most users?
Facebook leads globally with around 3.07 billion monthly active users as of April 2026, the first platform to pass 3 billion, followed by WhatsApp and YouTube at roughly 2.8 to 3 billion each, then Instagram with nearly 2.4 billion. In the UK, YouTube has the broadest reach, while WhatsApp is the most-used app for daily messaging.
What are social media demographics by platform?
TikTok skews youngest and holds the highest time-on-app; Instagram concentrates in the 18 to 34 range; Facebook now skews toward 35-plus and remains strongest among Gen X and Boomers; LinkedIn reaches professionals across 25 to 54. Gen Z is spread across most platforms, while Gen Alpha largely lives in gaming-social spaces such as Roblox.
Which platform has the highest B2B ROI?
LinkedIn consistently outperforms other platforms for B2B lead generation, with targeting by job title, industry and seniority that no other network matches. Its median company-page engagement is now among the highest of any platform, helped by document carousels.
What is a good engagement rate on Instagram?
Median Instagram engagement across all post types sits around 0.48% for business accounts in 2026 (Socialinsider), down again year on year. Carousels and Reels outperform that figure. Always benchmark against your own history and against accounts of similar size, since rates vary widely by formula and sector.
What do social media video statistics show for UK businesses?
91% of UK businesses now use video, and 87% of video marketers report positive returns (Wyzowl 2026). Most video is watched on mobile, and a large majority with the sound off, so captions are a functional necessity. Low-fidelity authentic clips outperform polished production on TikTok and Reels, while YouTube and LinkedIn reward higher production standards.
What percentage of UK SMEs use social media?
The majority. The Federation of Small Businesses and the Office for National Statistics both find social media to be the most widely used digital marketing channel among UK SMEs, ahead of email and paid search, with Facebook the most commonly adopted platform.
What are the benefits of tracking social media statistics?
Read correctly: platform data replaces guesswork about content format, budget, and targeting without paying a research agency. It shows who is engaging, which formats earn saves and shares, whether your organic reach matches your service area, and where paid budget will work hardest.
How is social search changing SEO?
TikTok, Instagram and Reddit are increasingly used for product and local discovery, particularly among under-35s. This does not replace Google for transactional searches, but it means social content needs to feed a website that can rank and convert once the same user searches later.