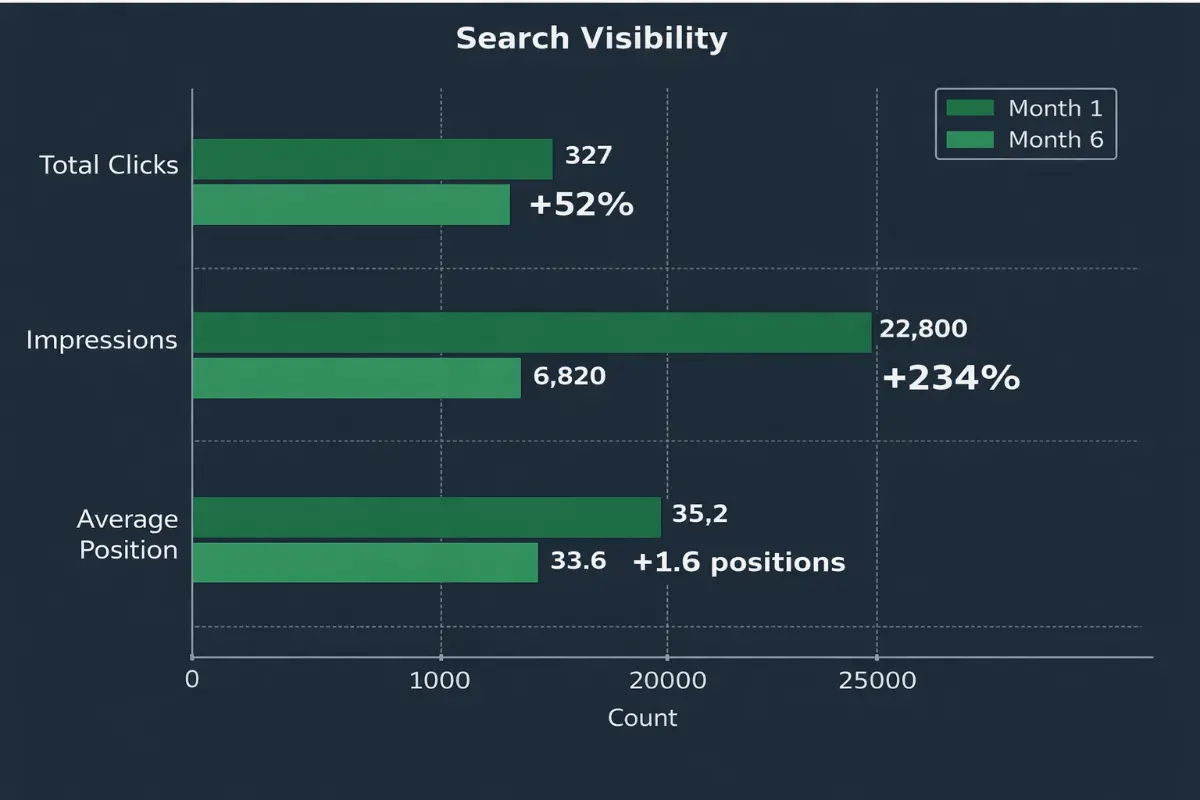
Google Search Console data tracked across the full engagement period shows clear, consistent growth. The numbers below reflect the difference between the first month and the sixth month of the retainer.
Search Visibility
| Metric |
Month 1 |
Month 6 |
Change |
| Total Clicks |
215 |
327 |
+52% |
| Impressions |
6,820 |
22,800 |
+234% |
| Average Position |
35.2 |
33.6 |
+1.6 positions |
The threefold increase in impressions reflects the site appearing for a significantly wider set of search queries by month six. Impressions typically grow ahead of clicks as new rankings build, which is consistent with this pattern.
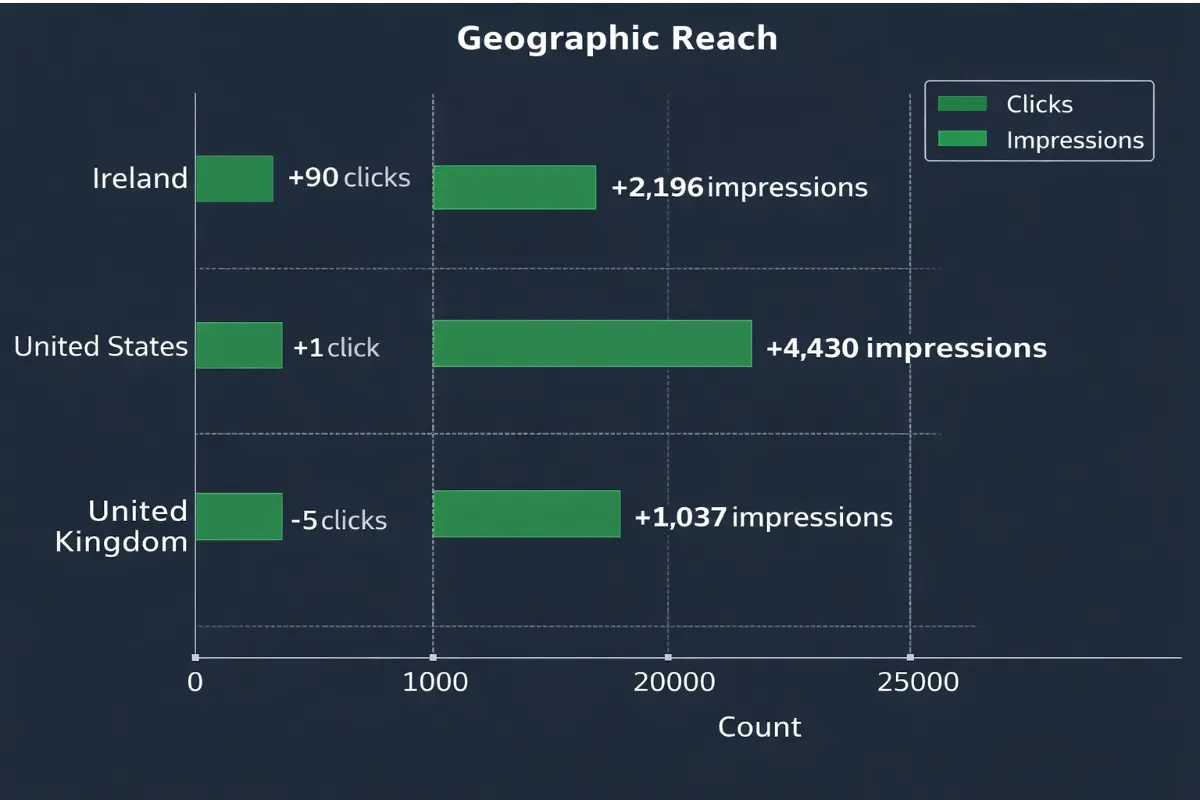
Geographic Reach
| Market |
Clicks Change |
Impressions Change |
| Ireland |
+90 clicks |
+2,196 impressions |
| United States |
+1 click |
+4,430 impressions |
| United Kingdom |
-5 clicks |
+1,037 impressions |
Growth in the Irish market was the most commercially significant, given the client’s primary customer base. The United States impressions growth, while not yet converting to clicks, indicates the content is gaining traction in a larger market.
Top Performing Pages
| Page |
Impressions Growth |
Clicks Growth |
| Homepage |
+4,327 |
+84 |
| Blog post |
+3,758 |
+12 |
| Gift set page |
+1,596 |
+6 |
| Product page |
+1,052 |
+3 |
| Collection page |
+888 |
+2 |
The blog post’s performance is worth noting. It ranked among the top visibility drivers despite not being a commercial page. This reflects the value of topic-led content in building site-wide authority, which then lifts the commercial pages it links to.
Domain Authority Growth
| Metric |
Start |
End |
Change |
| Authority Score |
12 |
16 |
+4 points |
Authority score growth of four points in six months reflects consistent backlink acquisition from credible sources. Domain authority compounds: gains made in months one through six accelerate ranking potential in months seven onwards.